Grafana Cloud Pricing in 2026: Plans, Usage Rates, and a Complete Overview
If you are pricing Grafana Cloud, the $19 platform fee is the number you will see first, and the one you will remember least.
The bill that arrives is decided by the usage rates behind it. Metrics, logs, traces, sessions, and synthetics each carry their own charge.
Grafana Cloud is a popular managed choice for teams already using Prometheus, OpenTelemetry, and Grafana dashboards. The appeal is genuine, and so is the cost governance it asks for.
To write this, I went through every published rate, what the free tier covers, and how a monthly bill actually adds up. I also studied review themes across G2, Gartner, and Capterra.
You get a genuine always-free tier and a low starting price. The limitation is that two teams with identical infrastructure can pay very different amounts, depending on how their telemetry is shaped.
So this is a complete guide on what Grafana Cloud costs in 2026, and where a different platform might suit your team better. Let's get into it.
Grafana Cloud Pricing at a Glance
Short on time? Here are the three plans and what each one is for.
Plan | Price | Best suited for |
Free | $0, always free | Personal projects, early-stage startups, evaluation |
Pro | From $19 / month plus usage | Teams needing more retention and pay-as-you-go scaling |
Enterprise | From $25,000 / year spend commit | Teams needing security, compliance, and deployment options |
The Free tier includes limited usage across all services, community support, and 14 days of retention for metrics, logs, traces, profiles, and k6 tests.
Pro adds pay-as-you-go usage above the free allowance, 8x5 email support, 13 months of metrics retention, and 30 days for logs, traces, profiles, and k6.
Enterprise adds premium support, custom retention, and deployment flexibility across public cloud, federal cloud, or bring your own cloud.
Two things this table cannot show. Grafana Cloud is not one flat bundle, so each product has its own rate and its own free allowance.
The second is that the $19 platform fee is only the entry point. Metric series, log volume, and trace volume are what move the bill at scale.
If you want observability pricing quoted to your environment rather than spread across many separate charges, Motadata ObserveOps is worth a look. You can book an ObserveOps demo and walk your own telemetry through it first.
What is Grafana Cloud?
Grafana Cloud is Grafana Labs' fully managed observability platform. It lets teams collect, store, visualize, query, and alert on telemetry without running the backend themselves.
It is built on the LGTM stack: Loki for logs, Grafana for dashboards, Tempo for traces, and Mimir for metrics.
The platform covers metrics, logs, traces, profiles, dashboards, frontend monitoring, application observability, Kubernetes monitoring, database observability, synthetic monitoring, k6 performance testing, and incident response.
Its main strength is flexibility for teams on open standards. It is OpenTelemetry-native and Prometheus-compatible, so teams keep open telemetry pipelines rather than adopting a proprietary agent.
It is worth being precise about the trade. Grafana Cloud is powerful but less plug-and-play than proprietary APM tools, since teams still manage labels, queries, dashboards, and telemetry volume.
How Grafana Cloud Pricing Works
The single most important fact is that Grafana Cloud is not priced as one flat observability bundle. Each product has its own usage rate.
Metrics are billed by billable series. Logs, traces, and profiles are billed by GB across process, write, and retain components.
Frontend observability is billed by sessions, synthetics by test executions, and k6 by virtual user hours. Some curated products use host-hour pricing instead.
That design has a direct consequence. Two teams with the same host count can get very different bills, depending on metric cardinality and telemetry volume.
How Grafana Cloud Measures Usage
Understanding the units matters more here than on most platforms, because each one is a separate line on your bill.
Metrics use billable series, based on active series and data points per minute. This is the charge most teams underestimate.
Logs, traces, and profiles use GB processed, GB written, and GB retained. A curated host is a physical or virtual instance that has sent signals in the last 15 minutes.
Host-hour billing counts active hours across the month, so teams do not pay for hosts that are spun down during off-hours.
Grafana Cloud Pricing: Every Usage Rate
Grafana publishes full pricing, so here is what each product costs on the Pro plan, alongside its free allowance.
Product | Free tier | Pro pricing |
Metrics | 10K active series | $6.50 per 1K billable series |
Logs | 50 GB / month | $0.05/GB process, $0.40/GB write, retain extra |
Traces | 50 GB / month | $0.05/GB process, $0.40/GB write, retain extra |
Profiles | 50 GB / month | $0.05/GB process, $0.40/GB write, retain extra |
Frontend Observability | 50K sessions | $0.75 per 1K sessions |
Synthetics API Testing | 100K executions | $5 per 10K executions |
Synthetics Browser Testing | 10K executions | $50 per 10K executions |
k6 Performance Testing | 500 virtual user hours | $0.15 per virtual user hour |
Application Observability | 2,232 host hours | $0.025 per host hour |
Kubernetes Monitoring | 2,232 host + 37,944 container hours | $0.01/host hour, $0.0007/container hour |
Every Pro product is charged above the $19 monthly platform fee. Volume discounts apply automatically, so the marginal rate falls as usage rises.
A few details are worth calling out for budgeting.
Metrics are the charge to watch. At $6.50 per 1K series, a few exporters, labels, and short-lived pods can build series quickly.
Logs and traces split into process, write, and retain, so the headline $0.05 process rate is only part of the GB cost.
Synthetics have a wide gap between API and browser testing, at $5 versus $50 per 10K executions.
Adaptive tools exist to reduce spend. Grafana states Adaptive Metrics can cut billable series by up to 80 percent and Adaptive Logs up to 50 percent.
Our guide to logs versus metrics explains why each signal is priced and retained differently.
What Does Grafana Cloud Actually Cost? Three Cost Scenarios
A rate list does not tell you your bill. So here are three worked estimates, built from Grafana's published Pro rates.
One caveat first. These are directional planning estimates, not quotes. Actual invoices shift with metric cardinality, data points per minute, retention, session counts, synthetic design, and discounts.
Metrics use a billable-series figure, not host count. The estimates below assume default paid retention and exclude profiles, k6, AI usage, and curated host-hour products.
Scenario 1: Small Team With About 50K Active Series
A small production team running around 10 hosts, producing roughly 1.1 TB of telemetry a month across logs, traces, and metrics.
They need infrastructure visibility, application troubleshooting, and light synthetic checks.
Component | Assumption | Monthly cost |
Platform fee | Fixed Pro fee | $19 |
Metrics | 40K billable series x $6.50 / 1K | $260 |
Logs | 670 billable GB x $0.45 process and write | ~$302 |
Traces | 310 billable GB x $0.45 process and write | ~$140 |
Estimated total | Metrics, logs, and traces | ~$721 / month |
Synthetic usage stays inside the free allowance here, so it adds nothing. Even so, the bill is already well above the $19 platform fee, driven by series and telemetry volume.
Scenario 2: Growing Team With About 250K Active Series
A growing SaaS team running around 50 hosts, producing roughly 5.4 TB of telemetry a month, with more services and customer traffic.
They need metrics, logs, traces, and both API and browser synthetics.
Component | Assumption | Monthly cost |
Platform fee | Fixed Pro fee | $19 |
Metrics | 240K billable series x $6.50 / 1K | $1,560 |
Logs | 3,550 billable GB x $0.45 process and write | ~$1,598 |
Traces | 1,750 billable GB x $0.45 process and write | ~$788 |
Synthetics | API and browser overages | ~$250 |
Estimated total | Growing app and infra | ~$4,215 / month |
This is where telemetry design starts to matter. Metric labels, trace sampling, and log levels each move the total, so cost governance becomes part of the job.
Scenario 3: Mid-Market Team With About 750K Active Series
A mid-market team running around 250 hosts, producing roughly 27 TB of telemetry a month across many clusters, services, and customer workloads.
They need metrics, logs, traces, frontend monitoring, and heavy synthetics.
Component | Assumption | Monthly cost |
Platform fee | Fixed Pro fee | $19 |
Metrics | 740K billable series x $6.50 / 1K | $4,810 |
Logs | 17,950 billable GB x $0.45 process and write | ~$8,078 |
Traces | 8,950 billable GB x $0.45 process and write | ~$4,028 |
Frontend Observability | 150K billable sessions x $0.75 / 1K | ~$113 |
Synthetics | API and browser overages | ~$1,300 |
Estimated total | Mid-market setup | ~$18,348 / month |
At this scale, most teams would negotiate Enterprise pricing rather than stay on Pro. Logs are the largest single line, and active series is the second.
The pattern holds at every size. Grafana Cloud cost tracks active series and telemetry volume, and each signal scales on its own rate.
What Increases Your Grafana Cloud Costs
Five things push a Grafana Cloud invoice higher than the $19 platform fee suggests.
Active metric series: This is the charge teams underestimate most. High-cardinality labels and short-lived pods multiply series and cost at $6.50 per 1K.
Log volume: Logs bill across process, write, and retain, so verbose logging in production adds up across three components.
Trace volume: Traces use the same process, write, and retain model, and high sampling rates on busy services raise all three.
Retention: Extended retention beyond the Pro defaults is a separate cost, and it compounds with volume.
Synthetic design: Browser testing costs ten times API testing per execution, so check frequency and type matter more than they first appear.
The takeaway is not that Grafana Cloud is overpriced. It is that the parts moving most are series and telemetry volume, not the low platform fee on the pricing page.
Grafana Cloud User Reviews: What Teams Actually Say
This section is based on our analysis of Grafana Cloud reviews across G2, Gartner Peer Insights, and Capterra.
Across those sites, the ratings are steady. Gartner Peer Insights shows Grafana Cloud around 4.6 out of 5, and G2 and Capterra carry consistent review themes for the platform.
Three points of praise show up most often. First, the dashboards are flexible, and Grafana is widely regarded as the standard for visualization.
Second, the open ecosystem draws steady approval, since teams keep Prometheus and OpenTelemetry pipelines. Third, monitoring visibility is strong for technical teams that invest in it.
The criticism is just as consistent. The learning curve is the leading complain of the users, since the platform rewards teams that understand labels, queries, and dashboard design.
Setup complexity is the second point, and cost forecasting is the third. Reviewers describe the many-rate model as hard to predict without active governance.
These reflect public review patterns rather than universal facts, so your experience will depend on your telemetry discipline and how you deploy.
Looking for a Grafana Cloud Alternative?
Let’s understand alternatives of the Grafana Cloud observability platform.
1. Motadata ObserveOps
Best for: enterprise IT and NOC teams, plus SRE and DevOps groups in regulated industries (BFSI, telecom, government, healthcare) that want quote-based pricing and on-prem control.
Motadata ObserveOps is a unified observability platform that brings metrics, logs, flows, traces, and topology together under one AI engine.
It runs on Motadata's Deep Learning Framework for IT Operations (DFIT). The AI is adaptive and needs no pre-training, so anomaly detection does not wait weeks for baselines.
The main difference from Grafana Cloud is the pricing model. There is no set of separate charges to model. Pricing is subscription-based and quoted to your environment.
That gives you a number you can forecast and defend. If that predictability is what your finance team wants, you can start a free ObserveOps trial and test it on your own telemetry.
Its application performance monitoring traces requests across Java, .NET, PHP, Node.js, Python, Go, and Kubernetes. The log analytics engine parses millions of lines with live tail and pattern matching.
Its real user monitoring tracks Core Web Vitals across React, Angular, Vue, and Next.js. Motadata cites up to 45 percent less downtime and 80 percent MTTR reduction (marketed figures, not independently audited).
Pros
- Predictable, quote-based pricing instead of several usage rates to model
- On-prem, private-cloud, and hybrid options for data residency and compliance
- Combined log, metric, and flow analysis for faster root cause
- One platform replaces separate NPM, APM, log, and AIOps tools
Cons
- Smaller third-party review presence than Grafana
- Quote-based pricing means you cannot self-estimate from a public page
- Less open-source ecosystem depth than the Grafana and Prometheus community
To compare the platforms directly, visit the Motadata comparisons page, or book an ObserveOps demo to walk a workload through it.
How ObserveOps Pricing Differs From Grafana Cloud
The core difference is what your bill tracks. Grafana Cloud tracks a set of separate charges, while ObserveOps is quoted to your environment.
Factor | Grafana Cloud | Motadata ObserveOps |
Pricing model | Many separate usage rates | Subscription, quoted to environment |
Metrics billing | Per billable series | No per-series charge |
Cost predictability | Requires telemetry governance | Forecastable from the quote |
Deployment | SaaS, with Enterprise options | SaaS, on-prem, private and public cloud |
Free tier | Always-free with limits | Trial, then quoted |
OpenTelemetry | Native | Native OTLP ingestion |
Data residency | Grafana-hosted by default | On-prem and private cloud options |
2. Datadog
Datadog is a broad SaaS observability platform, with infrastructure, APM, logs, RUM, synthetics, and security sold as separate products.
Its published pricing lists Infrastructure Pro at $15 per host per month billed annually, with APM starting at $31 per host per month. Log management and other products carry their own rates on top.
For teams that want packaged APM and native logs in one place, Datadog is easier to adopt than Grafana. You get more out of the box, with less assembly and tuning.
The trade-off is cost as you scale. The many separate products add up quickly, and Datadog's bill is known for surprising teams that grow hosts, custom metrics, or log volume. It is the more polished option, and usually the more expensive one.
3. New Relic
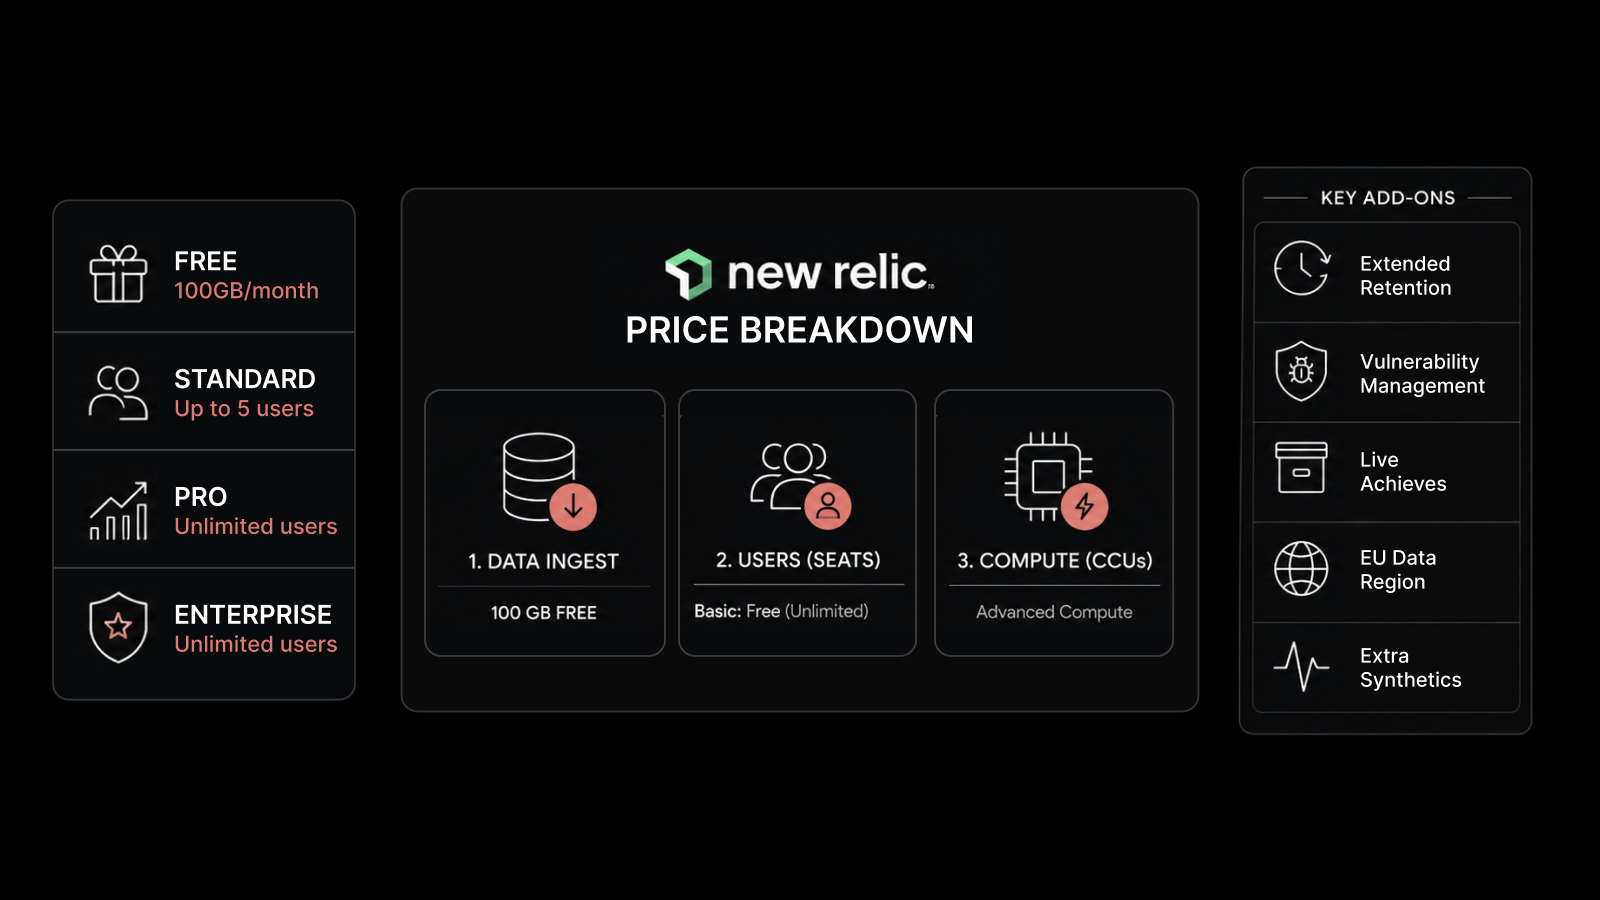
New Relic uses a data-ingest plus user model, which is simpler to estimate than active-series billing. Its published pricing includes 100 GB free per month, then $0.40 per GB.
The per-user side is where cost can rise. Full-platform users are charged separately from the data itself, so large teams should model both parts before committing.
That model favours teams that think in GB per month and want one number to plan around. It is a gentler on-ramp than Grafana for teams that do not want to manage telemetry pipelines themselves.
The trade-off is depth. New Relic does not match the Grafana dashboard ecosystem or the openness of the Prometheus and OpenTelemetry stack that Grafana is known for.
4. SigNoz
SigNoz is an OpenTelemetry-native platform, available cloud-hosted or self-hosted. Its cloud plan starts at $49 a month including usage credits, with unlimited teammates.
The self-hosted option is the draw for many teams. It is open-source, so you can run it on your own infrastructure and keep data in your environment at no licence cost.
It is easier to adopt for OTel-first teams that want simpler pricing and a single tool for metrics, logs, and traces. For smaller teams, the entry cost is lower than a full Grafana Cloud setup.
The trade-off is maturity. SigNoz is a younger platform, so it does not match the managed LGTM services, integrations, and dashboard ecosystem Grafana has developed over years.
Is Grafana Cloud the Right Choice?
The answer comes down to a few questions about how your team works and what you value.
Are you already using Grafana and Prometheus? If so, Grafana Cloud is a strong fit. The managed LGTM stack removes the burden of running Loki, Tempo, and Mimir yourself.
Is your environment Kubernetes-native or OpenTelemetry-first? The platform suits these teams well, along with platform engineering groups that want flexible visualization and open pipelines.
Do you need pricing you can predict without effort? If yes, Grafana Cloud is a weaker fit. The many-rate model needs active governance to stay predictable.
Do you have strong cardinality controls? Without them, active series can grow the bill quickly, so teams that lack this discipline often find the cost harder to manage.
Do you want plug-and-play APM out of the box? Grafana Cloud rewards teams that invest in configuration, so it is a weaker fit if you want packaged APM with minimal setup.
Do you need on-premises deployment or a fixed quote? If either matters, a platform like ObserveOps is worth evaluating.
Choose the Right Observability Platform for Your Needs
The main point on Grafana Cloud pricing is simple. The platform fee is low, but the usage rates are what decide your bill.
The Free tier is genuinely useful, and Pro starts at just $19 a month. But metrics, logs, traces, sessions, and synthetics each scale on their own rate.
That is not a reason to rule it out. For a team that manages its telemetry well and already uses Grafana, the platform is a strong choice.
It is a reason to work out the full cost first, counting active series, log and trace volume, retention, and synthetic use before you commit.
If you want to see how predictable, quote-based observability compares against your own telemetry, you can start a free ObserveOps trial and run a live workload through it.
FAQs
How Much Does Grafana Cloud Cost?
Grafana Cloud has a Free tier at $0, a Pro tier from $19 a month plus usage, and an Enterprise tier starting at a $25,000 per year spend commit. Pro usage is billed per product above the free allowances.
Is Grafana Cloud Free?
Yes. Grafana Cloud has an always-free tier with limited usage across all services, community support, and 14 days of retention for metrics, logs, traces, profiles, and k6 tests.
How Does Grafana Cloud Charge for Metrics?
Grafana Cloud charges for metrics by billable series. The Free tier includes 10,000 active series, and Pro pricing is $6.50 per 1,000 billable series above that allowance.
How Does Grafana Cloud Charge for Logs and Traces?
Logs and traces use a process, write, and retain model. Pro rates start at $0.05 per GB process and $0.40 per GB write, with retain charges where applicable.
What Increases Grafana Cloud Cost the Most?
The largest factors are active metric series, log volume, trace volume, retention, and synthetic test design. Frontend sessions, k6 usage, and curated host-hour products add cost when enabled.
Is Grafana Cloud Priced per Host?
Not mainly. Core metrics, logs, traces, and profiles are not priced per host. Curated products such as Application Observability and Kubernetes Monitoring can use host-hour pricing.
How Does Motadata ObserveOps Compare on Pricing?
Grafana Cloud uses several usage rates with published prices, which is flexible but hard to forecast. ObserveOps uses subscription-based, quote-to-environment pricing, which trades rate-level detail for a number you can predict. ObserveOps also offers on-premises and private cloud deployment.
Can I Send OpenTelemetry Data to Grafana Cloud?
Yes. Grafana Cloud is OpenTelemetry-native and Prometheus-compatible, so teams can keep open telemetry pipelines. Motadata ObserveOps is also OTLP-native if you want portable instrumentation.
Author
Poonam Lalani
Content Strategist
Poonam Lalani is a B2B content strategist and writer with a background in computer engineering and experience across enterprise technology domains, including AI, cloud, DevOps, data engineering, and IT operations. She specializes in creating research-driven content that simplifies complex ideas and supports product education, thought leadership, and business growth.