Top 10 Grafana Alternatives in 2026
Grafana is free to license but running it in production is not free. Full observability on the Grafana stack means operating four separate tools, learning three query languages, and keeping an engineer on all of it.
You need Grafana for dashboards, Loki for logs, Tempo for traces, Mimir or Prometheus for metrics.
This workload is the most common reason teams start searching for Grafana alternatives.
Two recent changes have added to the pressure. Grafana Labs relicensed the core project to AGPLv3 in 2021, and in March 2026 it archived the OnCall OSS repository, moving incident response toward the paid Grafana Cloud IRM (Grafana Labs, 2026).
Ten tools compared on deployment models, pricing predictability, AI and correlation depth, and how much of the Grafana stack each one replaces.
Both kinds of Grafana alternatives get covered: full platforms that retire the LGTM stack, and lighter tools that only swap the dashboard layer.
A comparison table and detailed reviews carry honest cons for every tool on the list.
A decision guide matches your team type to a tool, and the conclusion says plainly where Grafana still wins.
By the end, you will know whether your problem is the dashboards or the stack underneath them, and which of these ten tools deserves a trial against your own telemetry.
What Counts as a Grafana Alternative?
Alternatives to Grafana split into two different tool categories, depending on which problem sent you searching.
If the dashboards themselves are the pain (the learning curve, dashboard sprawl, sharing them with people who do not write PromQL), you are really looking for Grafana dashboard alternatives.
These offer a new visualization layer that reads from the backends you already run, and Perses is the credible pick in that lane.
If the stack behind the dashboards is the pain (operating Loki, Tempo, and Mimir, correlating across them, staffing all of it), you want a platform that replaces the whole assembly, which is what the other nine tools here do.
BI tools like Power BI and Tableau show up in these searches too, but they answer business-analytics questions on warehouse data, and they were never built for live operational telemetry.
We have labeled every tool below by which of the two real jobs it serves.
Why Do Teams Look for a Grafana Alternative?
Teams look for a Grafana alternative for three main reasons. Here they are in detail:
1. The LGTM Stack Is Four Tools to Run, Not One
Full-stack observability on Grafana means operating four systems: Grafana for dashboards, Loki for logs, Tempo for traces, and Mimir or Prometheus for metrics.
Each one has its own architecture, scaling model, upgrade cycle, and failure modes. Each also speaks its own query language, so your team learns PromQL, LogQL, and TraceQL just to follow one incident across three signals.
The storage layer has sharp edges of its own. Loki keeps its index deliberately small to stay cheap, which works until you filter on high-cardinality fields like user IDs or request IDs.
Those queries splinter into thousands of log streams and drag response times down, which is exactly when you need them fast.
2. Dashboards Show Symptoms Without Connecting Causes
Grafana is a visualization layer, so correlation is largely your job. When forty panels go red at once, someone still has to work out which alert is the cause and which thirty-nine are the echo, and that triage happens in a person's head rather than in the product.
Purpose-built AIOps platforms do that alert noise reduction for you, and its absence is the complaint that grows loudest as an estate scales.
The incident-response story now points at the paid tier too. Grafana Labs moved OnCall OSS to maintenance mode in 2025 and archived the repository in March 2026.
So, self-hosted teams that built on-call workflows around it are being steered toward Grafana Cloud IRM, or out looking for Grafana OnCall alternatives with incident workflows built in.
3. Pricing Gets Complicated on Both Paths
Grafana Cloud bills across per-user fees, usage-based telemetry charges, and host-hour pricing for some products, which makes the invoice hard to model before it arrives.
Teams comparing Grafana Cloud alternatives usually name that billing mix as the trigger. Self-hosting dodges the invoice and replaces it with infrastructure spend plus the engineer time from reason one.
Either way you pay, and the AGPLv3 license change from 2021 adds a legal review step for any team embedding dashboards in its own product.
None of this makes Grafana a bad tool. It remains the most flexible visualization layer in the market, and the honest framing is that its trade-offs stop being worth it at a certain scale, not that it stopped working.
How We Evaluated These 10 Tools
We evaluated these ten Grafana alternatives using vendor documentation, pricing pages, current G2 and Gartner Peer Insights sentiment, and the recommendations that keep surfacing in r/devops and r/sre threads, the way a buyer actually researches a switch.
We did not run a lab benchmark against every platform, and pricing reflects public information at the time of writing, so confirm current numbers before you commit.
We weighed the following five factors:
Stack coverage: Whether the tool replaces the whole Grafana stack or just one layer of it, since both are legitimate answers to different problems.
Telemetry breadth: Whether metrics, logs, and traces sit in one full-stack observability platform or across separate backends you correlate by hand.
Cost predictability: What the bill looks like at two and five times your current volume, including the hidden bill of engineer time on self-hosted stacks.
AI and correlation depth: Anomaly detection, alert correlation, and how fast the platform reaches a useful baseline.
How far the loop closes: Whether an alert can open a ticket on its own or dead-ends in a dashboard.
The 10 Best Grafana Alternatives Compared
Here is the shortlist at a glance. The type column carries the distinction that matters most in this list: three of these tools replace one layer of the Grafana stack, and seven replace all of it.
Tool | Best For | Type | Deployment | Pricing Model | Free Trial |
Motadata ObserveOps | Hybrid, regulated, ITSM-tied estates | Full platform | On-prem, private/public cloud | Quote-based | Yes, 30 days |
Datadog | Managed all-in-one at scale | Full platform | SaaS | Per-host plus usage | Yes, 14 days |
Dynatrace | Enterprise AI-driven APM | Full platform | SaaS, hybrid | From $350/host/year | Yes, 15 days |
New Relic | Developer-led teams | Full platform | SaaS | Free tier, then per-user plus usage | Free tier instead |
Splunk Observability | Teams already running Splunk | Full platform | SaaS | Per-host, quote-based | Yes, 14 days |
Elastic Observability | Log-heavy environments | Full platform | Cloud or self-managed | Usage-based | Yes, 14 days |
SigNoz | OTel-native open source swap | Full platform | Self-hosted or cloud | Free self-host, usage-based cloud | Yes, 30 days (cloud) |
OpenObserve | Single-binary, storage-cost focus | Full platform | Self-hosted or cloud | Free self-host, usage-based cloud | Free tier instead |
VictoriaMetrics | Scaling Prometheus metrics | Metrics backend | Self-hosted or cloud | Free OSS, licensed enterprise | Free OSS |
Perses | Dashboards-as-code | Dashboard layer | Self-hosted | Free, open source | Free OSS |
Detailed Overview of the 11 Best Grafana Alternatives
The table gives you the shape of the list. Now, let’s see the trade-offs, the pricing, and the honest cons, starting with the platform we know best.
1. Motadata ObserveOps
Best for: Enterprise IT and NOC teams running hybrid or multi-cloud estates that want the backend, the dashboards, and the correlation engine as one product, with alerts that can open and close service desk tickets.
Rating: 4.6/5 on G2, 4.3/5 on Gartner Peer Insights.
ObserveOps is a unified observability platform that pulls metrics, logs, network flows, traces, and topology into one backend.
Where Grafana hands you the glass and leaves the storage tiers to you, ObserveOps ships the whole assembly as a single product, so there is no Loki to scale, no Mimir to upgrade, and no label alignment between backends to debug.
The engine underneath, DFIT, runs causation-based correlation rather than raw threshold alerts. It maps dependencies, flags anomalies, cuts alert noise, and forecasts trouble.
The ObserveOps module uses an adaptive AI, with no training or baseline period required. That matters if you want usable root cause analysis in week one rather than week twelve.
Network flows are a native signal here, which the Grafana stack has no first-party answer to. ObserveOps ingests NetFlow, sFlow, jFlow, and IPFIX alongside OpenTelemetry data, and triangulating logs, metrics, and flows in one place is the capability Motadata leans on hardest for faster root cause.
Because ObserveOps shares its DFIT foundation with Motadata ServiceOps, an alert can open a ticket, route it to the right team, and close it once the underlying issue clears.
Marketed numbers and star ratings compress a lot into a few lines, so it helps to hear from a team that runs the platform day to day. This G2 review from Jinal captures what that looks like in practice:
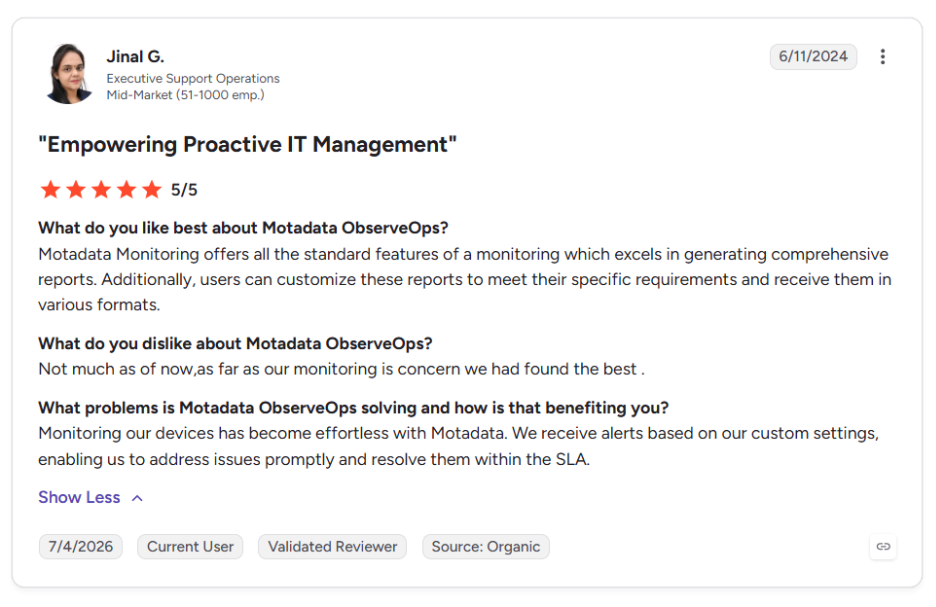
You can check out more of our G2 reviews here.
Pros
- One platform replaces the four-part Grafana assembly, storage included
- Flow analytics ship natively instead of via third-party plugins
- AI correlation works from day one, with no baseline period
- On-premises, private cloud, and public cloud deployment for teams under data residency rules
- Closes the loop into ticketing instead of stopping at a dashboard
Cons
- Pricing is quote-based rather than published, so you talk to sales before you see a number, unlike the open source options here
- Review volume on G2 and Gartner Peer Insights is thinner than the decade-old category giants, so there is less peer proof to lean on
- It is a full ITOps platform, so a team that only wants a lighter dashboard layer is buying far more than a Grafana swap
Pricing: Quote-based, scoped to your deployment mode and the modules you need, with a 30-day free trial.
2. Datadog
Best for: Teams that want the deepest managed all-in-one platform on the market and have the budget to keep it.
Rating: 4.4/5 on G2, 4.4/5 on Gartner Peer Insights.
Datadog is the opposite trade from the Grafana stack. Instead of assembling and operating four open source backends, you install one agent.
The agent gets you infrastructure monitoring, APM, log management, RUM, and security in a single managed product with 700-plus integrations.
Setup time drops from weeks to an afternoon, and there is no storage tier for your team to babysit.
The cost of that convenience is the bill and the exit. Per-host and per-GB charges stack up fast at scale, custom metrics carry their own pricing, and the proprietary agent makes leaving a real project.
Teams that left Grafana to escape operational load sometimes find they have traded it for invoice anxiety, which is worth reading about in our Motadata vs Datadog comparison before you commit either way.
Pros
- Fastest route from zero to full coverage on this list
- No backends to operate or scale
- Polished dashboards and granular alerting
- Polished dashboards and granular alerting
Cons
- Costs grow quickly with hosts, ingestion, and custom metrics
- Proprietary agent and data formats create real lock-in
- No self-hosted option for data sovereignty requirements
- Bill forecasting is hard once usage-based products pile up
Pricing: Infrastructure monitoring from $15 per host per month billed annually, with per-GB and per-product usage fees on top, and a 14-day free trial.
3. Dynatrace
Best for: Large enterprises running deep microservice estates that want automated root cause instead of hand-built dashboards.
Rating: 4.5/5 on G2, 4.6/5 on Gartner Peer Insights.
Dynatrace replaces the dashboard-first workflow entirely. OneAgent installs once and instruments hosts, services, and containers on its own.
On the other hand, the Davis AI engine correlates anomalies, maps the dependency chain, and points at a likely root cause. Where Grafana asks you to build the view and draw the conclusion, Dynatrace tries to hand you the conclusion directly.
That automation is priced like the enterprise product it is. Dynatrace sits near the top of this list on cost, the platform takes real time to learn, and hands-on engineers sometimes find its answers arrive from a black box.
If the engine appeals but the price does not, our Motadata vs Dynatrace comparison lays out where the two differ on cost and deployment.
Pros
- Automated dependency mapping with no manual tagging
- AI-driven answers rather than raw dashboards
- Strong fit for regulated enterprises, with hybrid options
- Mature governance and compliance controls
Cons
- Among the most expensive tools here
- Consumption pricing is hard to forecast exactly
- Steep learning curve despite the automation
- Overkill for a small, single-cloud team
Pricing: Platform subscription, usage-metered, from $350 per host annually per published tiers, with a 15-day free trial.
4. New Relic
Best for: Developer-led teams that want to self-serve full observability without standing up any infrastructure.
Rating: 4.4/5 on G2, 4.6/5 on Gartner Peer Insights.
New Relic puts logs, metrics, traces, and errors behind one SQL-like query language (NRQL) in one datastore, which is precisely the correlation story the LGTM stack makes you assemble by hand.
Its free tier is honest too: 100 GB of monthly ingest and one full-platform user, enough to run a small production service without a procurement cycle.
The pricing catches up at team scale. Full-platform seats get expensive as headcount grows, ingestion fees stack on top, and several reviewers report surprise bills once agent log volume climbs.
Its distributed tracing and APM depth remain the draw, especially for teams that would rather instrument code than operate backends.
Pros
- A free tier you can run real workloads on
- One query language instead of three
- Strong APM without manual setup
- Strong APM without manual setup
Cons
- Per-user pricing climbs quickly past the free tier
- Ingestion costs stack on top of seats
- UI can feel cluttered across older and newer components
- Best suited to teams comfortable instrumenting their own code
Pricing: Free tier available. Paid plans price per user (from $120 for the first user up to $1,188 per additional user annually) plus data ingestion beyond the free allowance.
5. Splunk Observability
Best for: Teams already running Splunk for logging or security that want observability without adding a second vendor.
Rating: 4.3/5 on G2, 4.4/5 on Gartner Peer Insights.
Splunk Observability Cloud pairs OpenTelemetry-native ingestion with no-sample tracing, so every request gets captured at full fidelity rather than sampled away.
For a team that already leans on Splunk for SIEM or log management, Log Observer Connect links the observability side to the logs you already pay to store, which keeps the vendor list short.
The two complaints that follow Splunk everywhere apply here too: a genuine SPL learning curve, and a cost curve you plan for well in advance.
Without an existing Splunk footprint, the case for starting here gets thin, because the log story still runs through the core Splunk platform and its separate licensing.
Pros
- Full-fidelity tracing with no sampling gaps
- Natural fit inside an existing Splunk estate
- Proven at very large enterprise scale
- Strong compliance and security pedigree
Cons
- One of the most expensive routes on this list
- Logs live in a separate backend with separate licensing
- SPL takes real time to learn
- Weak starting point without existing Splunk investment
Pricing: Per-host entry pricing with quote-based enterprise plans, and a 14-day free trial.
6. Elastic Observability
Best for: Log-heavy environments, and teams already invested in the Elastic Stack with Kibana as the front end.
Rating: 4.2/5 on G2, 4.5/5 on Gartner Peer Insights.
Elastic Observability runs on Elasticsearch, so full-text search across enormous log volumes is where it beats everything else here.
Where Loki deliberately indexes little to stay cheap, Elasticsearch indexes nearly everything by default, so ad-hoc log questions come back fast without pre-planned labels.
Kibana, the stack's own visualization layer, doubles as a direct Grafana replacement for teams whose data already lives in Elasticsearch.
Step outside log-centric work and the platform feels heavier. Its APM and tracing workflows trail the dedicated APM vendors, and running an Elasticsearch cluster at scale is a serious operational job in its own right, so self-hosting trades the LGTM burden for a different one rather than removing it.
Pros
- Unmatched full-text search across large log volumes
- Handles high-cardinality log queries Loki cannot
- Natural upgrade path for existing ELK users
- Strong security and SIEM adjacency
Cons
- APM and tracing feel heavier than purpose-built tools
- Elasticsearch at scale needs real operational investment
- Cloud costs need active monitoring as data grows
- KQL and ESQL bring their own learning curve
Pricing: Usage-based, with free and paid tiers depending on infrastructure size and ingestion, plus a 14-day free trial on Elastic Cloud.
7. SigNoz
Best for: Engineering-led teams that want the LGTM stack's job done by one open source, OpenTelemetry-native product.
Rating: Reviewed favorably on G2, though as an open source project its strongest trust signal runs through GitHub adoption rather than review-site volume. No Gartner Peer Insights presence yet.
SigNoz replaces Loki, Tempo, Mimir, and Grafana with a single product where logs, metrics, and traces share one ClickHouse datastore and one schema.
That shared schema is the practical difference: You click from a latency spike to the correlated traces and logs without lining up labels across two backends first. High-cardinality fields that choke Loki are handled natively by the columnar store.
SigNoz publishes a savings claim of around 45 percent against an equivalent Grafana Cloud setup (SigNoz, 2026), which is the vendor's own number, so weigh it accordingly.
The honest costs sit elsewhere: self-hosting at scale needs someone comfortable operating ClickHouse, and the ecosystem around the project is still younger than a decade-old incumbent's.
Pros
- Closest open source equivalent to retiring the whole LGTM stack
- Cross-signal correlation without label gymnastics
- Genuinely free to self-host
- Usage-based cloud pricing with no per-user fees
Cons
- Self-hosting at scale requires ClickHouse expertise in-house
- Smaller integration ecosystem than established vendors
- Enterprise features are still maturing next to the incumbents
Pricing: Open source core is free to self-host. SigNoz Cloud is usage-based, with a 30-day free trial that includes every feature.
8. OpenObserve
Best for: Self-hosting teams whose biggest line item is storage, and who want one binary instead of four deployments.
Rating: Limited review-site presence so far; its trust signals run through GitHub adoption and self-hosted community usage.
OpenObserve compresses the whole Grafana stack into a single process. Logs, metrics, traces, and RUM land in one binary with columnar storage backed by object stores like S3.
Moreover, querying happens in plain SQL rather than PromQL or LogQL. Hence, deployment takes minutes rather than days.
The vendor claims 60 to 90 percent lower costs than a full Grafana stack at scale, driven mostly by storage compression (OpenObserve, 2026).
It is the vendor's own benchmark, so treat it as directional, but the architecture behind the claim (Parquet on object storage) is real. The trade-off is youth: fewer integrations, a smaller community, and SQL required for anything advanced.
Pros
- Simplest self-hosted deployment on this list
- Storage costs drop sharply versus indexed backends
- One system to upgrade instead of four
- Can run alongside Grafana during a phased migration
Cons
- Smaller plugin and integration ecosystem than Grafana's
- Advanced analysis assumes SQL comfort on the team
- Newer project, so fewer battle-tested reference deployments
Pricing: Open source core is free to self-host. OpenObserve Cloud runs a free tier with usage-based paid plans above it.
9. VictoriaMetrics
Best for: Teams whose real problem is Prometheus buckling under metric volume, and who are otherwise happy to keep Grafana.
Rating: Strong community standing; as an open source project its trust signal is GitHub adoption and production references rather than review-site scores.
VictoriaMetrics is on this list for an honest reason: sometimes the part of the Grafana stack that hurts is only the metrics backend.
It is a drop-in Prometheus replacement that speaks PromQL, accepts remote write from your existing exporters, handles high-cardinality workloads Prometheus chokes on, and does it with noticeably lower CPU and memory.
Your Grafana dashboards keep working unchanged, which is why the top-voted answers in the Hacker News and Reddit threads on this topic keep naming it.
It solves exactly one layer. Logs and traces still need their own answers, and you still need a visualization tool on top, so it is a repair to the Grafana stack rather than an exit from it.
Pros
- Existing dashboards and alerts keep working
- Markedly lower resource usage than Prometheus
- Markedly lower resource usage than Prometheus
- Free and open source at the core
Cons
- Metrics only, so logs and traces remain unsolved
- You still run and maintain Grafana on top
- Some advanced features sit behind the enterprise license
Pricing: Free and open source at the core, with licensed enterprise features and a usage-based managed cloud.
10. Perses
Best for: Teams that only want to replace Grafana's dashboard layer, with dashboards managed as code in Git rather than clicked together in a UI.
Rating: No review-site presence; Perses is a CNCF Sandbox project, so maturity signals come from its governance and adopters rather than G2.
Perses targets exactly one thing: the visualization layer. It is an Apache 2.0 licensed, CNCF-governed dashboard tool for Prometheus that treats dashboards as version-controlled resources with first-class Kubernetes CRDs.
As a result, dashboard changes go through the same GitOps review flow as the rest of your configuration.
Teams that landed on Grafana's AGPLv3 license change with a frown will notice the permissive license immediately, and observability vendors have already begun embedding Perses in their own products.
It has fewer panel types than Grafana's, there is no alerting and no storage, and Sandbox maturity means the roadmap is still moving. For a pure dashboard swap on a Prometheus estate, that narrowness is the appeal.
Pros
- Cleanest answer for dashboard governance and reproducibility
- Permissive license with vendor-neutral governance
- Keeps your existing Prometheus backend untouched
- Free with no commercial edition to upsell you
Cons
- Dashboards only, with no alerting or data storage
- Fewer panel types and plugins than Grafana
- Sandbox-stage maturity, so expect movement
Pricing: Free and open source under Apache 2.0, with no paid edition.
How to Choose the Right Grafana Alternative?
The right Grafana alternative depends on which layer of the stack is actually hurting, so match yourself to the closest situation below rather than chasing the longest feature list.
The full-platform picks at the top of the list double as Grafana alternatives for IT monitoring across an entire estate, while the last two entries repair a single layer.
Your Situation | Start With | Why |
Hybrid or regulated estate with a service desk to feed | Motadata ObserveOps | Replaces the full stack and turns alerts into tickets |
Zero appetite for operating backends, budget available | Datadog | Fastest route to full coverage, deepest integration catalog |
Deep microservices and a budget for automation | Dynatrace | Automated root cause justifies the premium price |
Developer-led team that wants a free start | New Relic | 100 GB free tier runs a small production service |
Already paying for Splunk | Splunk Observability | Keeps the vendor list short, tracing unsampled |
Log search is the whole job | Elastic Observability | Elasticsearch indexes what Loki deliberately skips |
Open source conviction, want the full stack unified | SigNoz | Retires all four LGTM components, OTel-native |
Self-hosted with a storage bill problem | OpenObserve | Single binary on cheap object storage |
Only Prometheus is buckling | VictoriaMetrics | Drop-in swap, dashboards keep working |
Only the dashboards hurt | Perses | Dashboards-as-code on your existing Prometheus |
Use the difference between observability and monitoring as a final gut check. If you need threshold alerts on known failure modes, half this list is more platform than you need.
If you need answers about failures you have not seen yet, the correlation layer is the thing worth paying for, and a dashboard swap will not supply it.
Replace Grafana with Motadata ObserveOps
Grafana is a strong tool, and for some teams, it’s the right one. Nothing here matches its visualization flexibility or its plugin library. Moreover, the OSS core stays free, and a small team with one Prometheus instance has no reason to leave.
The case for Grafana alternatives comes down to scale. At some point, four backends, three query languages, and manual correlation cost more in engineering time than a platform costs in licensing.
For the hybrid, regulated, or ITSM-tied teams reading this, we think ObserveOps is the strongest starting point.
It replaces the assembled stack with one backend, correlates causes instead of coloring panels red, ingests the network flows the Grafana stack never handled natively, and closes the loop into a service desk.
Motadata reports powering IT operations for 500-plus enterprises across 30-plus countries on that model.
It is not the right pick for everyone. A dashboard-only complaint is answered better by Perses, and a team that wants to own every layer of its stack should trial SigNoz or OpenObserve before talking to any vendor, including us.
Whichever way you go, the migration itself is usually the easy part, because OpenTelemetry lets you route the same instrumentation to a new backend without rewriting it.
The harder decision is whether the time your team spends running the stack is worth buying back. If you want to see what your estate looks like with the correlation done for you, you can talk to the ObserveOps team and walk through your alert volume together.
FAQs
Is there a free alternative to Grafana?
Yes. Several tools in this list are open source alternatives to Grafana that cost nothing to license, spanning both full platforms and dashboard-only swaps, and the comparison table above marks which ones.
Keep in mind that Grafana OSS is itself free, so the honest comparison on any self-hosted option is infrastructure plus engineer time, not license fees.
What is the LGTM stack in Grafana?
The LGTM stack is the four-part setup behind a full Grafana deployment: Loki for logs, Grafana for dashboards, Tempo for traces, and Mimir for metrics. Each component is deployed, scaled, and upgraded separately, and each signal has its own query language (LogQL, PromQL, TraceQL).
Running all four is the operational load this guide keeps referring to, and Loki's limits on high-cardinality fields are the most common single complaint inside it.
Is Grafana similar to Power BI?
Grafana and Power BI both build dashboards, but they solve different problems. Grafana visualizes live operational telemetry (metrics, logs, and traces from servers, networks, and applications) so engineers can watch and troubleshoot systems in real time.
Power BI is a business intelligence tool that analyzes warehouse and spreadsheet data for reporting and decision-making. A team replacing Grafana needs an observability or monitoring platform, while a team replacing Power BI needs another BI tool, so the two are rarely interchangeable.
Can I replace Grafana without replacing Prometheus?
Yes. Grafana is a visualization and analysis layer, so swapping it does not touch your metrics backend. Most tools on this list accept Prometheus data through remote write or OpenTelemetry, and the dashboard-only options query Prometheus directly, so your exporters and your PromQL investment keep working while the front end changes.
Is Motadata ObserveOps a good Grafana alternative?
Motadata ObserveOps is a strong Grafana alternative for enterprise IT and NOC teams running hybrid or regulated estates.
It replaces the assembled Grafana stack with one platform covering metrics, logs, flows, traces, and topology, runs causation-based correlation with no training period.
It can also open and close service desk tickets from alerts through its native ServiceOps integration.
Author
Ramya Shah
Technical Writer
Ramya Shah is a technical content writer with a computer engineering background and roots in automotive journalism. He covers IT Service Management, observability, IT operations, and AI-driven automation. An early adopter of AI-assisted writing workflows, he turns complex IT processes into clear, engaging content optimized for search and answer engines (AEO), lifting content output and organic visibility.