Top 10 Elasticsearch Alternatives in 2026
An Elasticsearch cluster rarely stays the size you planned for. The three-node ELK stack that handled application. logs last year is now twelve nodes, a shard rebalancing calendar, and a standing Friday job for whoever tunes the JVM heap.
That creep is what usually starts the search for Elasticsearch alternatives. The queries still work. What stops working is the bill for hot storage and the engineering hours the cluster quietly eats.
Timing plays a part too. Elastic changed its license twice in four years (off Apache 2.0 in 2021, back to open source under AGPLv3 in August 2024), and the ecosystem split into two camps along the way.
In this blog, you will see:
Ten Elasticsearch alternatives compared on cost, migration effort, operational burden, and AI depth.
A scope focused on log analytics and observability, which is where most ELK stacks actually run (site-search swaps get a pointer, and nothing more).
A comparison table and detailed reviews, with honest cons for every tool, including our own.
A decision guide that matches your situation to a shortlist, plus a fair look at what Elasticsearch still does well.
By the end, you will know which of these ten tools deserves a trial against your own log volume, and which ones you can skip without sitting through a demo.
What Counts as an Elasticsearch Alternative?
An Elasticsearch alternative is whatever replaces the job you gave Elasticsearch, and that job splits two ways. Some teams run it as a search engine behind an application or a storefront.
Far more teams run it as the storage and query layer of an ELK stack, holding logs and operational telemetry for troubleshooting, full-stack observability, and audits.
The two jobs call for different replacements. Application and site search belongs with purpose-built engines such as Algolia, Meilisearch, Typesense, and Apache Solr.
Replacing Elasticsearch as a log backbone is the harder problem: Elasticsearch alternatives for log management and observability have to store, search, and correlate telemetry at production scale.
Why Do Teams Look for an Elasticsearch Alternative?
Teams look for alternatives to Elasticsearch for three main reasons: cost that scales faster than log volume, day-two operations that never shrink, and licensing whiplash. Here are the three explained:
1. The Bill Grows Faster Than the Log Volume
Elasticsearch keeps its working data hot, indexed, and in memory-hungry JVMs. Elastic's own guidance caps the heap at half of each node's RAM and keeps it under roughly 32 GB, so a good share of the memory you pay for on every node is doing supporting work rather than holding your data.
Growth therefore means more nodes, more fast block storage, and a bigger bill for data you query less and less.
Elastic Cloud starts at about 95 dollars a month for an entry configuration (per 2026 tooling comparisons), and real log workloads climb well past that per node.
2. Day-Two Operations Never Shrink
Running Elasticsearch at scale is a discipline with its own literature. Elastic's production guidance tells you to keep shards between 10 GB and 50 GB and under 200 million documents each.
It means that someone on your team owns shard sizing, rebalancing, and reindexing as volumes grow.
Add mapping explosions from unruly log fields, heap and garbage collection tuning, and version upgrades that need a rehearsal.
None of it ships a feature. For a team with one infrastructure engineer, the cluster becomes the second job that never went away, and anomaly detection or correlation still sits on a wishlist somewhere behind it.
3. Licensing Whiplash Split the Ecosystem
In January 2021, Elastic moved Elasticsearch and Kibana off Apache 2.0 to dual SSPL and Elastic License terms with version 7.11.
AWS answered in April 2021 by forking version 7.10.2 into OpenSearch under Apache 2.0 (AWS, 2021). In August 2024, Elastic reversed course and added AGPLv3 as an open source option from version 8.16 onward.
So if licensing was your reason to leave, that reason has mostly expired. However, the split that it caused comes with its own challenges.
Plugins, client libraries, and managed services now target two diverging products, and every ELK team eventually picks a side or picks a different architecture altogether.
None of this makes Elasticsearch a bad tool. It remains the reference for full-text search over operational data, and version 8 closed real performance gaps.
The complaints are about what it costs to keep that power running once log volume gets serious.
How We Evaluated These 10 Tools
We tried to mimic the way a buyer researches a switch. We evaluate the tools based on their pricing pages, official docs, G2 and Gartner Peer Insights reviews, and the Reddit threads where engineers describe what broke during non-working hours.
We weighed the following five factors:
Cost predictability: Whether pricing is published, what the per-GB anchors look like, and what happens to the bill when log volume grows tenfold.
Migration path: Whether your existing shippers and pipelines re-point with Elasticsearch-compatible APIs or OpenTelemetry, or get rebuilt from scratch.
Operational burden: What you run (shards, JVMs, backend databases) versus what runs for you.
AI and correlation depth: Whether the platform finds the cause behind a log spike or only stores the evidence for you to dig through.
How far the loop closes: Whether an alert can open a ticket on its own or dead-ends in a dashboard.
The 10 Best Elasticsearch Alternatives Compared
Here is how the top Elasticsearch alternatives compare at a glance. Ratings come from G2 and Gartner Peer Insights, and pricing reflects public information at the time of writing (confirm current numbers before you commit).
Tool | Best For | Type | Deployment | Pricing Model | Free Trial |
Motadata ObserveOps | Hybrid, regulated, ITSM-tied estates | Full ITOps platform | On-prem, private/public cloud | Quote-based | Yes, 30 days |
OpenSearch | Smallest migration off ELK | Search and analytics fork | Self-hosted, managed cloud | Free OSS; usage-based managed | Free tier instead |
Splunk | Enterprise SIEM depth and support | Log analytics and SIEM | Self-hosted, SaaS | Ingest or workload based, quote | Yes, 60 days |
Datadog | Cloud-first teams, zero cluster ops | SaaS observability platform | SaaS only | Per GB ingest plus indexing | Yes, 14 days |
Grafana Loki | Kubernetes teams on Prometheus | Log aggregation backend | Self-hosted, Grafana Cloud | Free OSS; per GB cloud | Free tier instead |
Graylog | Syslog and Windows event centralization | Log management layer | Self-hosted, cloud | Free open; annual Enterprise quote | Free below 2 GB/day |
OpenObserve | Cutting the log storage bill | Rust observability platform | Self-hosted, cloud | Free to 50 GB/day; per GB cloud | Yes, 14 days |
SigNoz | Open source OTel logs, metrics, traces | Open source observability | Self-hosted, cloud | Free OSS; usage-based cloud | Yes, 30 days |
ClickHouse (ClickStack) | Petabyte-scale analytics in SQL | Columnar database stack | Self-hosted, cloud | Free OSS; compute plus storage | Yes, 30 days |
ManageEngine Log360 | Windows and AD-heavy security teams | SIEM and log management | On-prem, SaaS | Quote-based by log sources | Yes, 30 days |
Detailed Overview of the 10 Best Elasticsearch Alternatives
Here is a closer look at each tool, starting with the platform we know best.
1. Motadata ObserveOps
Best for: Hybrid, regulated, or ITSM-tied estates that want log analytics correlated with infrastructure monitoring instead of another standalone log silo.
Rating: 4.6/5 on G2, 4.3/5 on Gartner Peer Insights.
Motadata ObserveOps is a unified observability platform that ingests metrics, logs, network flows, traces, and topology into one backend.
For an Elasticsearch replacement, the part that matters is its log management module: out-of-the-box parsers, live tail, keyword search with highlighting, and a surrounding-logs view that pulls up the lines around any log event in one click.
The difference shows after ingestion. ObserveOps triangulates logs with metric and flow data, so a log spike arrives already tied to the VM, interface, or application behind it.
DFIT, Motadata's correlation engine, runs causation-based root cause analysis on adaptive AI with no training or baseline period, which matters if you want usable answers in week one rather than week twelve.
The loop also closes. Through native ServiceOps integration, an alert can open a ticket, route it to the right team, and close it once the underlying issue clears, so log evidence stops dead-ending in a dashboard.
For regulated teams, the deployment story does the heavy lifting: six documented modes spanning on-premises, private cloud, and public cloud, including high availability and disaster recovery variants. That is a path SaaS-only log platforms cannot offer.
Here is an example of how Motadata ObserveOps helped a business.
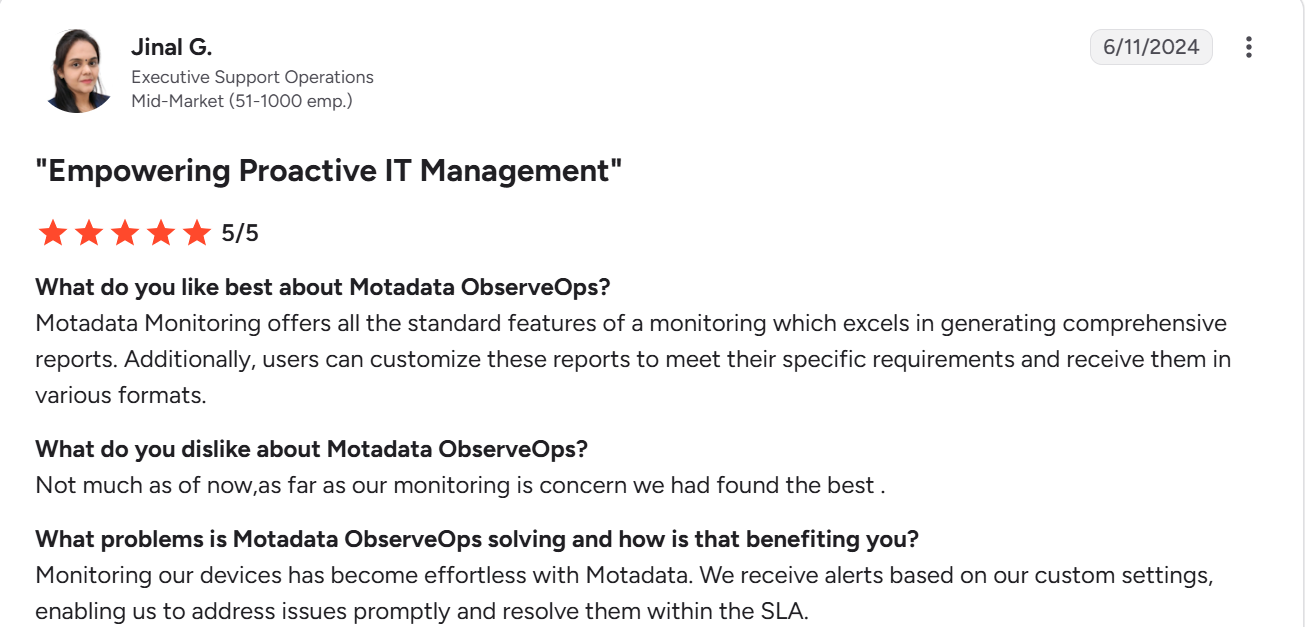
Check out more of our G2 reviews here.
Pros
- One backend replaces the ELK stack plus the separate monitoring, flow, and APM tools around it
- Correlation works from day one, with no baseline calibration window
- On-premises and private cloud paths suit BFSI, government, and healthcare estates
- Alerts flow into ServiceOps tickets natively, without middleware
- Native flow ingestion (NetFlow, sFlow, jFlow, IPFIX) sits alongside log analytics
Cons
- Pricing is quote-based rather than published, so you talk to sales before you see a number, unlike the open source options here
- Review volume on G2 and Gartner Peer Insights is thinner than the decade-old category giants, so there is less peer proof to lean on
- It is a full ITOps platform, so a team that only wants a lighter log store is buying more than an Elasticsearch swap
Pricing: Quote-based, scoped to your deployment mode and the modules you need, with a 30-day free trial.
2. OpenSearch
Best for: Teams that want the smallest possible migration off the ELK stack.
Rating: 4.4/5 on G2. On Gartner Peer Insights, the managed Amazon OpenSearch Service holds 4.4/5.
OpenSearch is the fork AWS cut from Elasticsearch 7.10.2 in 2021, kept under Apache 2.0 and now governed through the Linux Foundation. It keeps the Elasticsearch 7.x REST APIs and ships OpenSearch Dashboards, a Kibana fork, so most Beats, Logstash, and client-library setups re-point with minimal surgery.
The bundled extras sweeten the deal. Fine-grained security, alerting, and anomaly detection ship free, where Elastic gates comparable features behind paid tiers.
The catch is that you inherit the same architecture you were trying to escape. Shard sizing, JVM heap care, and cluster upgrades transfer over unchanged, and early adopters still call some components rough, the Kubernetes operator especially. Elastic's own benchmarks claim the newer Elasticsearch runs 40 to 140 percent faster, though those are vendor-run numbers.
Pros
- The most familiar landing spot for an ELK team, from APIs to dashboards
- Apache 2.0 license under neutral Linux Foundation governance
- Security and alerting features cost nothing extra
Cons
- Same shard, heap, and upgrade burden as the Elasticsearch it forked
- Some components still feel unfinished, per community reports
- Feature paths have diverged from Elasticsearch 8, so newer Elastic capabilities never arrive
Pricing: Free to self-host. Managed options bill by usage, with Amazon OpenSearch Serverless starting at 0.24 dollars per OCU-hour. There is no trial as such; the AWS free tier covers small instances.
3. Splunk
Best for: Enterprises that want the deepest SIEM ecosystem and mature vendor support behind their machine data.
Rating: 4.3/5 on G2, 4.5/5 on Gartner Peer Insights.
Splunk is the enterprise incumbent for machine-data search, owned by Cisco since March 2024. Its SPL query language is the most powerful way in this market to interrogate logs, and the Splunkbase ecosystem holds over 2,000 apps and add-ons covering nearly every data source an enterprise runs.
Teams pick Splunk when security is the anchor use case. Enterprise Security remains a benchmark SIEM, and the support organization behind it is one reviewers consistently rate well.
The bill is the trade-off, and it is a famous one. Procurement data puts list pricing around 150 to 225 dollars per GB per day ingested on annual contracts.
Additionally, r/Splunk threads describe deals near a million dollars a year, and the ingest-versus-workload licensing models are complicated enough that third parties publish guides to decoding them.
Pros
- Search and investigation power at enterprise scale
- The deepest SIEM feature set of any tool here
- Mature support, training, and partner ecosystem
Cons
- Cost draws more complaints than any other aspect in G2 reviews and Reddit threads
- Licensing models are complex enough to need dedicated decoding guides
- No Elasticsearch API compatibility, so migration means re-pointing agents and rewriting saved searches
Pricing: Quote-based. Splunk Enterprise offers a 60-day free trial that converts to a 500 MB/day free license; Splunk Cloud offers a 14-day trial.
4. Datadog
Best for: Cloud-first teams that want managed logs correlated with APM and infrastructure metrics, with zero cluster operations.
Rating: 4.4/5 on G2, 4.6/5 on Gartner Peer Insights.
Datadog is the fully managed route off the ELK stack. Logs land next to metrics, traces, and real user data in one SaaS platform, parsed by more than 200 out-of-the-box pipelines, and its Watchdog AI flags anomalies without setup.
Its pricing model splits ingestion from indexing, which Datadog calls Logging without Limits. You pay a small fee to ingest everything, then a larger one to index the subset you query hot, with Flex storage holding the rest for up to 15 months.
That model is also the sore spot. The pay-twice structure confuses teams, and surprise bills are the loudest theme in community forums. There is no self-hosted option, which rules it out for strict data residency. We compared the platforms line by line in our Motadata vs Datadog breakdown.
Pros
- Zero cluster operations, upgrades, or shard mathematics
- Polished cross-signal correlation that reviewers rate highly
- Archive and rehydrate keeps old logs queryable without hot-tier cost
Cons
- Usage-based bills spike without warning, a recurring complaint in community forums
- Paying once to ingest and again to index makes cost modeling hard
- SaaS only, with no on-premises path for regulated or air-gapped estates
Pricing: Log ingestion from 0.10 dollars per GB per month, plus 1.70 dollars per million log events indexed at 15-day retention on annual billing. A 14-day free trial is available.
5. Grafana Loki
Best for: Kubernetes teams on Prometheus who want cheap log aggregation inside the workflow they already run.
Rating: No standalone G2 or Gartner Peer Insights listing; trust runs through adoption instead, with roughly 28,600 GitHub stars and more than 100,000 active clusters reported by Grafana Labs.
Loki is the anti-Elasticsearch by design. It indexes only labels, never log content, and writes compressed chunks straight to object storage such as S3. The index stays tiny, the storage bill drops toward object-store prices, and there is no JVM or shard calendar anywhere.
Queries run in LogQL, which mirrors PromQL, so a Prometheus-fluent team feels at home on day one.
The design cuts both ways. Arbitrary full-text searches over long ranges scan raw chunks and can crawl, and careless label choices create high-cardinality indexes that Grafana's own engineering blog warns will get big and slow. Loki also does logs only, so you still run a metrics store and Grafana around it.
Pros
- Storage costs land near raw object-store prices
- No JVM, heap, or shard management at all
- Prometheus label parity makes adoption nearly free for Kubernetes shops
Cons
- Needle-in-haystack full-text searches over big ranges run slow
- High-cardinality labels quietly wreck performance and cost
- Logs only, so the rest of the stack stays your problem
Pricing: Free to self-host under AGPLv3. Grafana Cloud bills logs per GB ingested with a free allowance to start.
6. Graylog
Best for: Central syslog and Windows event collection with a turnkey interface on a budget.
Rating: 4.4/5 on G2, 4.5/5 on Gartner Peer Insights.
Graylog is the log management layer that historically ran on top of Elasticsearch, and it now requires OpenSearch or its own bundled Data Node underneath.
You get what raw ELK makes you build yourself: streams, pipeline rules that parse and route at ingest, Sidecar-managed collectors, and alerting, all behind one UI.
The economics attract mid-sized teams. Graylog Open is free, and a full Enterprise license costs nothing below 2 GB per day of ingestion (a cap the company cut from 5 GB in 2022, to some community grumbling).
You still operate a search backend and MongoDB underneath it, so the day-two work shrinks rather than disappears. And Graylog stays a logs tool, with no native metrics or traces.
Pros
- Cost-effectiveness is the recurring G2 review theme
- Much faster to stand up than a hand-built ELK stack
- Strong syslog and Windows event coverage for IT and security teams
Cons
- You still run OpenSearch and MongoDB under the hood
- The free Enterprise cap tightened once already
- No metrics or traces, so it cannot consolidate your stack
Pricing: Graylog Open is free and self-managed. Enterprise starts at 15,000 dollars per year based on daily volume, and stays free below 2 GB per day.
7. OpenObserve
Best for: Teams whose main pain is the storage bill and who want one small binary to replace the whole ELK footprint.
Rating: No rated G2 or Gartner Peer Insights presence yet; its trust signals are roughly 20,100 GitHub stars and a SOC 2 Type II attestation.
OpenObserve is a Rust-built observability platform that stores logs, metrics, traces, and RUM data as Parquet files on object storage.
The vendor markets a storage cost about 140 times lower than Elasticsearch, which is its own figure, so treat it as directional, but the architecture behind the claim is real: columnar files on S3 instead of hot Lucene indexes.
Setup is the other pitch. A single binary starts in about two minutes, with no shards or heap to tune, and its ingestion layer accepts Elasticsearch-style bulk APIs, so common shippers re-point with little change.
The trade-off is track record. The project is young next to everything else here, open source users grumble that useful features sit behind the enterprise edition, and reviewers call the UI clunky even while praising the engine.
Pros
- Storage economics collapse next to Lucene-index stacks
- Two-minute single-binary start with no cluster tuning
- Enterprise features run free up to 50 GB per day of ingestion
Cons
- Shorter production track record than the rest of the field
- Open-core boundaries frustrate some open source users
- Interface polish trails the established platforms
Pricing: Free to self-host, with enterprise features free up to 50 GB per day. Cloud runs from 0.50 dollars per GB ingested, with a 14-day free trial.
8. SigNoz
Best for: Open source logs, metrics, and traces in one OpenTelemetry-first tool.
Rating: No G2 or Gartner Peer Insights listing yet; adoption is the trust signal, at roughly 29,600 GitHub stars.
SigNoz is what an ELK replacement looks like when you start from OpenTelemetry instead of from Logstash. All three signals arrive through OTLP, land in a ClickHouse columnar backend, and share one UI with a visual log query builder, pipelines, and trace-to-log correlation.
The economics undercut the SaaS incumbents. Cloud pricing is flat usage (logs at 0.30 dollars per GB beyond the included volume) with no per-host or per-user math.
Moreover, the vendor's own benchmark claims half the ingestion resources of Elastic and 2.5 times faster aggregations, a vendor-run study worth validating on your data.
Maturity is the honest concern. Kubernetes users report rough Helm chart upgrades, the UI can drag on long time ranges, and self-hosting means you now operate ClickHouse. Migration also runs through the OTel Collector, so Beats-era pipelines get rebuilt rather than re-pointed.
Pros
- Flat usage pricing with no per-host counting
- One tool replaces ELK, Jaeger, and a separate metrics store
- Fast development pace, with SSO now in the community edition
Cons
- Upgrade and stability rough edges show up in community reports
- Long-range queries can run sluggish
- Self-hosting hands you ClickHouse operations
Pricing: Community edition is free. Cloud starts at 49 dollars per month with usage included, then logs at 0.30 dollars per GB. The trial runs 30 days with no credit card.
9. ClickHouse (ClickStack)
Best for: Petabyte-scale log analytics for teams fluent in SQL, either raw or packaged as ClickStack.
Rating: 4.5/5 on G2. There is no established Gartner Peer Insights listing; GitHub adoption is the stronger signal, at roughly 48,600 stars, the largest of any tool here.
ClickHouse is the columnar database that much of the modern logging world quietly runs on, including SigNoz and HyperDX.
Its MergeTree engine compresses telemetry aggressively and answers aggregation queries at speeds inverted-index stores cannot touch at scale.
Since May 2025 you no longer have to assemble it yourself. ClickStack packages ClickHouse with the HyperDX interface and OpenTelemetry ingestion into a supported observability stack, with a managed cloud version in beta since February 2026.
The cost of that power is expertise. G2's own summary of reviewer cons lists beginner unfriendliness and required expertise, raw ClickHouse leaves ingestion and visualization to you.
Additionally, full-text search semantics differ from Lucene, so saved Kibana searches do not carry over.
Pros
- Aggregation speed on huge volumes is the dominant G2 praise theme
- Apache 2.0 core with no license drama
- Scales past the point where Lucene-based stacks stall
Cons
- Steep learning curve, per G2's own cons summary
- ClickStack is young as a packaged product
- Different search semantics mean Kibana habits and saved queries die in the move
Pricing: Free to self-host. ClickHouse Cloud starts at about 67 dollars per month, with a 30-day trial that includes 300 dollars in credits.
10. ManageEngine Log360
Best for: Windows and Active Directory-heavy teams that want SIEM reports and compliance templates working on day one.
Rating: 4.3/5 on G2, 4.5/5 on Gartner Peer Insights.
Log360 approaches log management from the security side. It unifies collection across Active Directory, Windows and Linux servers, firewalls, and cloud services.
It also runs a real-time correlation engine with threat intelligence feeds, and adds UEBA for behavior-based anomaly detection.
Compliance is where it outruns everything else here. More than 1,000 prebuilt report templates cover PCI DSS, HIPAA, GDPR, and SOX, which saves audit-season weeks that a hand-built ELK stack would spend writing queries.
It is a security product first, and it shows. Reviewers on G2 call some setup configurations complex, the AD-centric design fits cloud-native and Kubernetes logging poorly, and there is no Elasticsearch compatibility of any kind.
For the wider platform picture, our Motadata vs ManageEngine comparison covers how the two portfolios differ.
Pros
- Compliance reporting depth none of the other nine tools match out of the box
- Far cheaper than Splunk-class SIEM suites
- One console across on-premises and cloud log sources
Cons
- Setup configurations run complex, per G2 reviewers
- AD-centric design suits cloud-native log analytics poorly
- No Elasticsearch API compatibility, so it replaces workflows rather than clusters
Pricing: Quote-based by log source count for the on-premises edition, with published cloud tiers starting at a few hundred dollars a year and a 30-day free trial.
How to Choose the Right Elasticsearch Alternative?
The right Elasticsearch alternative depends on which part of the stack is actually hurting, so match yourself to the closest situation below rather than chasing the longest feature list.
Your Situation | Start With | Why |
Hybrid or regulated estate with a service desk to feed | Motadata ObserveOps | Replaces the ELK stack and turns alerts into tickets |
You want the smallest possible migration off ELK | OpenSearch | Same 7.x APIs, Apache 2.0, familiar dashboards |
Security operations with an enterprise budget | Splunk | Deepest SIEM ecosystem and mature support |
Cloud-first team that wants zero cluster ops | Datadog | Managed logs correlated with APM and infra metrics |
Kubernetes shop already on Prometheus and Grafana | Grafana Loki | Label-based logs inside your existing workflow |
Central syslog and Windows events on a budget | Graylog | Turnkey streams and pipelines on an OpenSearch backend |
Huge log volume, small storage budget | OpenObserve | Parquet on object storage cuts the storage bill |
Open source, OTel-first, all three signals in one tool | SigNoz | Logs, metrics, and traces on one columnar stack |
Petabyte-scale analytics and a team fluent in SQL | ClickHouse (ClickStack) | Columnar speed, with ClickStack adding the log UI |
Windows and AD-heavy security and compliance | ManageEngine Log360 | SIEM reports and UEBA ready out of the box |
One final gut check before you shortlist. If your logs exist to answer known questions (grep an error, pull an audit trail), the lighter log stores will serve you fine
If your logs exist to explain failures you have not seen yet, the correlation layer is the thing worth paying for, and the difference between the two needs is exactly how observability and monitoring differ.
Replace Elasticsearch with Motadata ObserveOps
Elasticsearch earned its place honestly. It is still the reference engine for full-text search over operational data, and the 2024 return to open source repaired the biggest complaint against it.
The problem it cannot repair is the model: a memory-hungry, shard-managed cluster that grows more expensive and more demanding exactly as your log volume grows.
At that point the question stops being which log store searches fastest and becomes which platform explains failures with the fewest engineers attached.
For hybrid, regulated, or ITSM-tied teams, we think ObserveOps is the strongest starting point.
Logs arrive correlated with metrics and flows, DFIT points at root cause without a training period, and alerts become routed tickets instead of dashboard decorations.
Motadata reports powering IT operations for 500-plus enterprises across 30-plus countries on that model.
It is not the right pick for everyone. A team that wants the smallest possible migration or a team that wants to own every layer of its stack might find Motadata Overkill.
Whichever way you lean, the move is cheaper than it looks. OpenTelemetry-native ingestion means your instrumentation stays portable, so the cluster is the only thing you leave behind.
If you want to see what your own log volume looks like with correlation attached, you can talk to the ObserveOps team and walk through it together.
FAQS
What is the best alternative to Elasticsearch?
There is no single winner across every use case, which is why the comparison table above sorts by best fit rather than rank. Hybrid and regulated estates that want log analytics tied into monitoring and ticketing lean toward Motadata ObserveOps. Start from your painful dimension (cost, operations, or correlation) and the shortlist writes itself.
Is Elasticsearch still open source?
Yes, again. Elasticsearch left open source in January 2021 when Elastic moved versions 7.11 onward to SSPL and Elastic License terms, and it returned in August 2024 when Elastic added AGPLv3 as an option from version 8.16. That reversal removed licensing as the strong reason to switch. The reasons that remain are cluster cost and day-two upkeep, which is exactly what unified platforms such as Motadata ObserveOps are built to take off your plate.
How hard is it to migrate away from Elasticsearch?
It is not easier than it used to be, because collection is now the portable part. If your shippers speak OpenTelemetry, the instrumentation moves with you and only the storage layer changes. Motadata ObserveOps ingests OTLP traces, metrics, and logs natively and ships out-of-the-box log parsers, so the usual path is running it beside the old cluster for one retention window, then cutting queries over once the history ages out.
What is the best Elasticsearch alternative for log management?
For log management specifically, the strongest alternatives pair log search with the context around it. A standalone log store still leaves you correlating by hand during an incident. Motadata ObserveOps handles this by triangulating logs with metrics and network flows in one backend, so a log spike arrives tied to the infrastructure behind it and can raise a ticket on its own through ServiceOps.
Is Motadata ObserveOps a good Elasticsearch alternative?
Motadata ObserveOps is a strong Elasticsearch alternative for hybrid, regulated, or ITSM-tied teams specifically. It replaces the ELK stack with log management correlated against metrics, flows, and topology, adds causation-based root cause analysis with no training period, and closes the loop by turning alerts into routed tickets.
Author
Ramya Shah
Technical Writer
Ramya Shah is a technical content writer with a computer engineering background and roots in automotive journalism. He covers IT Service Management, observability, IT operations, and AI-driven automation. An early adopter of AI-assisted writing workflows, he turns complex IT processes into clear, engaging content optimized for search and answer engines (AEO), lifting content output and organic visibility.