Best Datadog Alternatives for 2026: 9 Observability Tools Compared
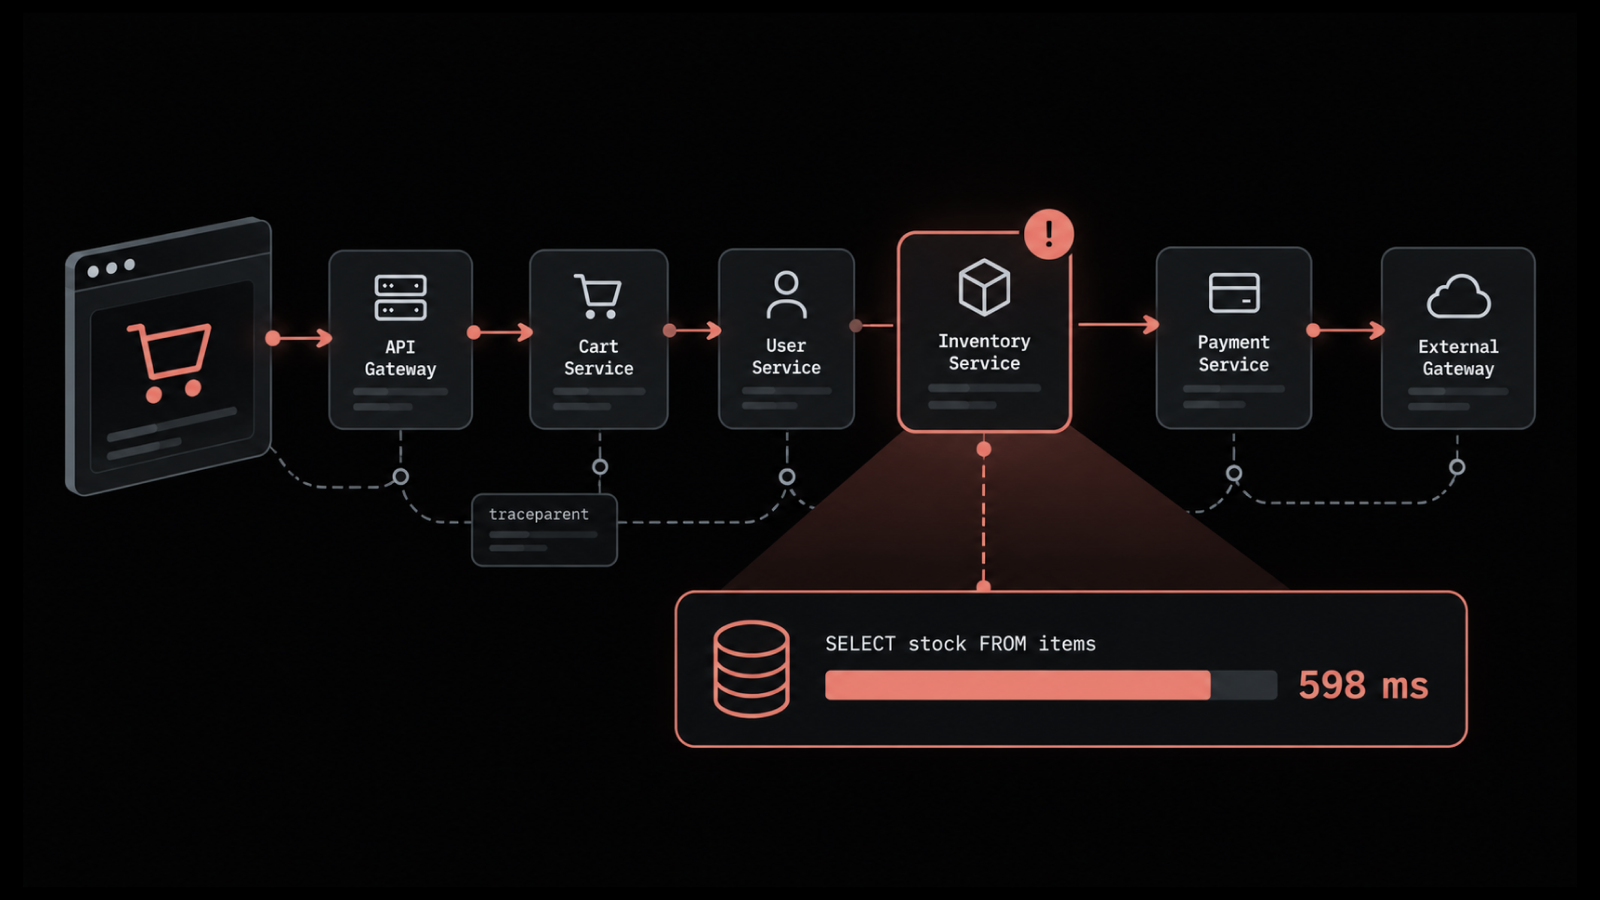
Somewhere between your third custom metric and your two-hundredth host, the Datadog invoice stops looking like a monitoring bill and starts looking like a second cloud bill. You did not budget for that. Nobody does.
That is usually when people start looking for Datadog alternatives. It comes from the finance team asking why observability costs more than the outage it was supposed to prevent.
Thankfully, there are several credible Datadog alternatives running production workloads. These tools span from open source options and cloud-native suites to platforms built around AI-driven root cause analysis instead of simple dashboards.
In this blog, you will see:
Nine tools compared on deployment model, pricing predictability, AI and automation depth, and how well each one ties observability back into a service desk.
A comparison table and detailed reviews, with honest cons for every tool, including our own.
A decision guide that matches your team type (enterprise IT, SRE, DevOps, MSP, or regulated industry) to the tool that actually fits.
An honest look at where Datadog still wins, so this does not read like a piece built to talk you out of it regardless of your situation.
By the end, you will know which of these nine tools deserves an actual trial against your own stack, and which ones you can skip without sitting through a demo.
Why Do Teams Look for a Datadog Alternative?
Teams start looking for a Datadog alternative for three main reasons: unpredictable pricing, alert noise, and vendor lock-in. Here are the reasons explained:
1. Unpredictable, Ingestion-Based Pricing
Unpredictable, ingestion-based pricing is the single biggest reason teams start comparing Datadog alternatives, and it is not close.
One widely cited vendor benchmark puts typical mid-sized Datadog spend at 50,000 to 150,000 dollars a year for full-stack monitoring, with enterprise deployments regularly passing a million (Uptrace, 2026).
The structural issue is a high-watermark billing model that reads your 99th percentile of monthly usage, so a single traffic spike can inflate the bill even when your average load stayed low all month.
High-cardinality data makes this situation worse. User-level metrics, per-container telemetry, and request-level tracing all generate the kind of granular data that increases cost almost linearly with volume.
Engineers on Reddit routinely describe the resulting bill as close to impossible to forecast, particularly once log ingestion or custom metrics climb past a few hundred (r/devops, r/sre).
2. Alert Noise Without Correlation
A platform that surfaces every threshold breach without correlating them leaves someone triaging forty alerts to find the one that actually matters. That is a slower version of not having monitoring at all, and it is the complaint engineers raise most often once a Datadog deployment grows past a handful of services.
3. Vendor Lock-In on Proprietary Agents
Datadog's proprietary agents work well, until you want to route the same telemetry somewhere else.
Teams are standardizing on open ingestion standards like OpenTelemetry specifically so that layer stays swappable, instead of rebuilding every integration from scratch the day they switch vendors.
None of this makes Datadog a bad product. It means the bill calculation changes once you are paying enterprise prices for a tool built to also serve teams a tenth your size.
How We Evaluated These 9 Tools
We evaluated these nine Datadog alternatives in the same way a real user would research when switching products.
We factored in vendor documentation, pricing pages, current G2 and Capterra ratings, and the sentiment showing up in Reddit threads and Gartner Peer Insights.
We weighed the following five factors:
Telemetry breadth: Whether metrics, logs, flows, and traces sit in one full-stack observability platform or across three separate tools.
Cost predictability: Ingestion-based billing is the single most common complaint about Datadog itself.
AI and automation depth: Anomaly detection, alert correlation, and how fast a platform reaches a useful golden signals baseline.
Deployment flexibility: SaaS only versus on-premises, private cloud, or hybrid.
How far the loop closes: Whether an alert can open a ticket on its own or dead-ends in a dashboard.
The 9 Best Datadog Alternatives Compared
Here is the shortlist at a glance. Ratings come from G2, and pricing reflects public information at the time of writing (confirm current numbers before you commit).
Tool | Best For | Deployment | Pricing Model | Free Trial |
Motadata ObserveOps | Hybrid, regulated, ITSM-tied estates | On-prem, private/public cloud | Quote-based | Yes, 30 days |
Dynatrace | Enterprise AI-driven APM | SaaS (OneAgent) | From $350/host/year | Yes, 15 days |
New Relic | Developer-led teams | SaaS | $120 to $1,188/user/year plus usage | No, ongoing free tier instead |
SolarWinds Observability | Hybrid IT and SRE teams | SaaS, on-prem options | From $144/node/year | Yes, 30 days |
Splunk Observability | SRE and security-adjacent teams | SaaS | Quote-based, per-host entry | Yes, 14 days |
Grafana Cloud | Dashboard-first, cloud-native teams | Cloud or self-hosted | From $228/year plus usage | No, ongoing free tier instead |
SigNoz | Cost-conscious, OpenTelemetry-native teams | Self-hosted or managed cloud | Free (self-hosted), paid cloud plans | Yes, 30 days (SigNoz Cloud) |
Elastic Observability | Log-heavy environments | Cloud or self-managed | Usage-based | Yes, 14 days |
IBM Instana | Zero-config microservices discovery | SaaS, agent-based | From $240/managed VM (Essentials) | Yes, 14 days |
9 Best Datadog Alternatives for 2026
The comparison table above gives you the shape of these nine Datadog alternatives. The reviews below carry the trade-offs, the pricing, and the honest cons.
1. Motadata ObserveOps
Best for: Enterprise IT and NOC teams running hybrid or multi-cloud estates that want an observability alert to open, and close, a service desk ticket on its own.
Rating: 4.6/5 on G2, 4.3/5 on Gartner Peer Insights.
ObserveOps is a unified observability platform that pulls metrics, logs, network flows, traces, and topology into one backend, instead of the four or five point tools most hybrid estates end up stitching together.
The engine behind it, DFIT, runs causation-based correlation rather than raw threshold alerts.
It maps dependencies, flags anomalies, cuts alert noise, and forecasts trouble, and Motadata describes it as adaptive AI that does not require a training or baseline period. That matters if you want usable root cause analysis in week one, not week twelve.
Because ObserveOps shares its DFIT foundation with Motadata ServiceOps, an alert can open a ticket, route it to the right team, and close it automatically once the underlying issue clears.
Motadata reports customers cutting MTTR by up to 80 percent and downtime by 45 percent after consolidating onto the platform. Those are the vendor's own marketed figures, so weigh them as directional rather than independently audited.
Pros
- One backend for metrics, logs, flows, and traces, instead of four stitched-together tools
- On-premises, private cloud, and public cloud deployment, useful for BFSI, telecom, and government teams under data residency rules
- Closes the loop into ticketing instead of stopping at a dashboard
- AI correlation that works from day one, with no baseline period
Cons
- Pricing is not published anywhere public, so you go through a sales conversation before you get a number
- G2 and Capterra review volume (25 and 18 respectively) is thin next to a category giant like Datadog's 723 G2 reviews, so newer buyers have less peer proof to lean on
- It is built as a broad ITOps and AIOps platform, so a team that wants a narrow, single-purpose APM tool may find it wider than it needs
Pricing: Motadata does not publish list pricing for ObserveOps. Quotes are scoped to your deployment mode and the modules you need, and a 30-day free trial is available.
2. Dynatrace
Best for: large enterprises running deep microservice estates that want automated root cause without hand-built dashboards.
Rating: 4.5/5 on G2, 4.6/5 on Gartner Peer Insights.
Dynatrace's OneAgent installs once and instruments hosts, services, and containers on its own, with no manual tagging required.
Its Davis AI engine does not stop at an alert. It correlates the anomaly, maps the dependency chain, and points at a likely root cause, which is exactly the automation enterprises pay for.
That much automation costs what you would expect. Dynatrace sits near the top of the price range in this comparison (from $350 per host annually per its published tiers), and the platform's depth means meaningful ramp-up time for a smaller team.
If Dynatrace is the right engine but the price is not, our own Motadata vs Dynatrace comparison lays out where the two actually differ on cost and deployment.
Pros
- Automated dependency mapping with no manual tagging
- Strong fit for SRE workflows
- Real user monitoring built in, not bolted on
- Mature enterprise governance
Cons
- Among the most expensive tools here
- Platform complexity takes time and patience to learn
- Usage-metered pricing is hard to forecast exactly
- Overkill for a small, single-cloud team
Pricing: Platform subscription, usage-metered, from $350 per host annually per published tiers, with a 15-day free trial.
3. New Relic
Best for: developer-led teams that want to self-serve dashboards without juggling multiple tools.
Rating: 4.4/5 on G2, 4.6/5 on Gartner Peer Insights.
New Relic bets on one idea: put logs, metrics, traces, errors, and profiling behind a single SQL-like query language, and let engineers self-serve instead of waiting on a platform team.
Its free tier supports that bet, generous enough to run a small service on for real, which is why engineering teams often reach for it first when they want to kick the tires without a procurement cycle.
The pricing catches up with you at scale. Per-user platform pricing runs from $120 for the first user up to $1,188 annually for each additional user, on top of data ingestion, so a growing team has to watch seat count as closely as data volume.
Its distributed tracing is solid, but the legacy and newer UI components can feel disjointed when you move between them.
Pros
- An honest free tier you can run production traffic on
- Fast auto-instrumentation
- Developer-friendly query language
- Strong dashboards out of the box
Cons
- Per-user pricing climbs quickly past the free tier
- Ingestion costs stack on top of seats
- Legacy and new UI components feel disjointed
- Best suited to teams comfortable instrumenting their own code
Pricing: Free tier available. Paid plans run from $120 (first user) to $1,188 per additional user annually, plus data ingestion fees.
4. SolarWinds Observability
Best for: IT teams juggling on-prem, hybrid, and cloud-native environments who want fewer open tabs, not a six-month rollout.
Rating: 4.3/5 on G2, 4.3/5 on Gartner Peer Insights.
SolarWinds Observability's whole argument is fewer open tabs. Apps, infrastructure, networks, databases, and digital experience sit in one console.
It is built for estates that are part legacy and part cloud-native (which describes most mid-sized IT shops we talk to, whether they admit it or not).
Its AIOps correlations connect related events and changes, so you get a probable root cause and a blast radius in minutes instead of forty separate alerts.
Onboarding leans on prebuilt dashboards and opinionated defaults, so teams reach a working setup fast, and a 30-day free trial (SolarWinds' own published terms) gives you room to test it against a live workload before committing.
It is worth reading against our own Motadata vs SolarWinds comparison too, since the two compete for a similar hybrid IT buyer.
Pros
- Broad hybrid coverage in one console
- Quick time to a useful first dashboard
- Database and network path detail most APM tools skip
- A genuinely functional 30-day trial
Cons
- Pricing scales with the number of monitored nodes and adds up across a large estate
- Deepest value shows up for hybrid estates, less so for a single cloud-native app
- Some advanced modules need add-on licensing
Pricing: From $144 per node or host annually, with a 30-day free trial.
5. Splunk Observability
Best for: SRE teams already running Splunk for logging or SIEM that want observability without adding a second vendor relationship.
Rating: 4.3/5 on G2, 4.4/5 on Gartner Peer Insights.
Splunk Observability handles metrics with many unique labels at scale, no-sample tracing, and alerting mature enough for complex containerized platforms.
If your team already leans on Splunk for security or log management, the vendor management lift is lighter than starting from zero with a new platform.
Reviewers name the same two complaints over and over: a genuine learning curve, and a cost curve you have to plan for well ahead of time.
Both track with Splunk's broader reputation for getting expensive as data volume grows.
Pros
- No-sample tracing keeps full fidelity
- Tight fit for teams already inside the Splunk ecosystem
- Strong programmatic control
- Mature alerting
Cons
- Steep learning curve for new users
- Costs need active planning at high data volumes
- Interface leans toward data analysts more than developers wanting quick answers
- Less useful with no existing Splunk footprint
Pricing: Starts per-host with a 14-day free trial; enterprise plans are quote-based.
6. Grafana Cloud
Best for: Teams that want the most configurable visualization layer here, across multiple data sources, and have the engineering time to set it up.
Rating: 4.5/5 on G2, 4.6/5 on Gartner Peer Insights.
Grafana Cloud bundles Prometheus for metrics, Loki for logs, and Tempo for traces as a managed service. So, you get the open-source Grafana stack without running the storage tiers yourself.
For teams that already think in dashboards, nothing else on this list matches its visualization flexibility.
However, it comes with a trade-off, which is that you are assembling a platform, not buying one.
Grafana ties multiple components together rather than shipping as one opinionated workflow, so correlating a log line to a trace to a metric takes more manual configuration than a platform built around a single data model.
Pros
- The most flexible dashboards of any tool on this list
- Strong open-source community and plugin library
- Works across almost any data source
- Generous free tier to start
Cons
- Full observability needs multiple components working together, not one out-of-the-box workflow
- Initial configuration takes meaningful setup time
- Alerting and correlation are less opinionated than purpose-built AIOps platforms
Pricing: Free tier available, paid plans from $228 annually plus usage-based fees.
7. SigNoz
Best for: Cost-conscious, engineering-led teams that want an OpenTelemetry-native platform they can self-host and never see a per-host invoice for.
Rating: reviewed favorably on G2, though as an open source project its strongest trust signal runs through GitHub activity and self-hosted adoption rather than review-site volume. No ratings on Gartner Peer Insights.
SigNoz is built natively on OpenTelemetry, which is why it shows up in nearly every open source Datadog alternative search.
Routing telemetry to it is close to a drop-in swap if your stack already emits OTel data, and its ClickHouse backend keeps metric aggregation fast even at production data volumes.
The honest limitation is how much support you have to bring yourself. Self-hosting SigNoz at a meaningful scale takes someone on the team who is comfortable managing ClickHouse.
Additionally, the ecosystem around it (integrations, marketplace, third-party guides) is smaller than what a decade-old vendor has built up.
Pros
- Genuinely open source core, free to self-host
- Closest literal Datadog swap for OTel-native stacks
- Transparent, predictable infrastructure cost
- Strong fit for startups that would rather own their stack than rent it
Cons
- Self-hosting at scale needs genuine ClickHouse expertise in-house
- Smaller integration ecosystem than established vendors
- Less suited to teams that want a fully managed, zero-ops platform
Pricing: Open-source core is free to self-host. SigNoz Cloud comes with a 30-day free trial that includes every feature, no card required to start.
8. Elastic Observability
Best for: teams already invested in the Elastic Stack, or anyone whose biggest problem is searching across enormous log volumes fast.
Rating: 4.2/5 on G2, 4.5/5 on Gartner Peer Insights.
Elastic Observability runs on Elasticsearch, so full-text search across massive log datasets is where it separates itself from the rest of this list.
Machine learning jobs flag anomalies, and APM, metrics, and logs sit together in one Kibana-backed interface. Elastic Observability feels heavier the moment you step outside log-centric work.
Reviewers who tested it for APM and distributed tracing describe the experience as clunkier than a purpose-built APM platform, and running Elasticsearch at scale is its own operational job.
Pros
- Unmatched full-text search across large log volumes
- Natural fit for teams already on the Elastic Stack
- Flexible query and exploration tools
- Large integration ecosystem
Cons
- APM and tracing workflows feel heavier than dedicated tools
- Running Elasticsearch at scale needs serious infrastructure investment
- Usage-based pricing needs active monitoring as data grows
Pricing: Usage-based, with free and paid tiers depending on infrastructure size and data ingestion, plus a 14-day free trial on Elastic Cloud.
9. IBM Instana
Best for: teams that want zero-configuration microservice discovery and continuous, unsampled tracing without a lengthy setup process.
Rating: 4.4/5 on G2 (479 reviews), 4.4/5 on Gartner Peer Insights (315 reviews).
Instana auto-discovers services the moment its agent lands on a host, then traces every request without sampling, so nothing gets dropped before you need it.
IBM acquired Instana in 2020, and the product has kept its original focus: automated dependency mapping and always-on code profiling with almost no manual tagging.
That automation shows up in the pricing too. Instana bills per host rather than per trace or per gigabyte, so a busy service does not generate a bigger invoice than a quiet one.
The trade-off is flexibility. Teams that want to shape every dashboard by hand find Instana more opinionated than a tool like Grafana Cloud.
Pros
- Near-zero manual configuration to get useful data
- Full-fidelity tracing with no sampling gap
- Simple per-host pricing with no trace overages
- Strong fit for microservices-heavy enterprises
Cons
- Less flexible than open, dashboard-first platforms
- Enterprise-focused pricing model does not favor small teams
- Fewer open-source integration options than OTel-native tools
Pricing: From $240 per managed virtual server (Essentials tier), billed per host rather than per trace, with a 14-day free trial.
How Do You Choose the Right Datadog Alternative?
The right Datadog alternative depends on your situation, so match yourself to the closest case below instead of chasing the longest feature list.
Hybrid or multi-cloud enterprise with a service desk to feed: Motadata ObserveOps ties observability alerts directly into ticketing, and its six deployment modes cover regulated estates that cannot go SaaS-only.
Deep microservices, budget for automation: Dynatrace, if OneAgent's auto-discovery and Davis AI's root cause justify the spend.
Developer-led team that wants to self-serve: New Relic's free tier and query language fit teams that would rather instrument their own code than wait on a vendor.
Existing hybrid IT estate, want fewer open tabs fast: SolarWinds Observability's opinionated defaults get a useful dashboard live quickly.
Already running Splunk for logs or security: Splunk Observability is the lighter lift on vendor management.
Dashboard-first team with engineering time to spend: Grafana Cloud's flexibility across data sources is unmatched, if you can staff the configuration.
Cost-conscious, OpenTelemetry-native stack: SigNoz is the closest thing to a free, drop-in swap.
Log-heavy environment already on Elastic: Elastic Observability keeps your search layer and adds observability on top of it.
Microservices estate, want zero manual configuration: IBM Instana auto-discovers services and traces every request without sampling, so you get full fidelity without hand-tuning instrumentation.
If you want to be thorough with your research, you should understand the difference between observability and monitoring. If all you need is threshold alerts on a known set of failure modes, several tools on this list are overkill for you.
If you need to ask questions about failures you have not seen yet, that is when the AI correlation layer earns its keep.
Replace Datadog with Motadata ObserveOps
Datadog earns its market position honestly. Deep tracing, a huge integration catalog, and a 4.4/5 G2 rating across 723 reviews do not happen by accident. The problem was never really the product. It was the bill and the silence between the alert firing and an engineer actually knowing why.
For most of the hybrid, regulated, or ITSM-tied teams reading this, Motadata ObserveOps is the strongest starting point.
It unifies the same signal types Datadog does run causation-based AI without a training period, deploys on-premises when compliance demands it, and closes the loop into a service desk instead of stopping at a dashboard.
Motadata powers IT operations for 500-plus enterprises across 30-plus countries on that model.
It is not the right pick for everyone. A small, all-in-on-one-cloud engineering team that just wants to self-serve dashboards will get there faster with New Relic's free tier, and a team that wants to own every line of its stack should look hard at SigNoz first.
Whichever of the nine fits, the migration itself is rarely the hard part. The hard part is admitting the old bill was never going to shrink on its own.
If you want to see where ObserveOps lands against your specific deployment mode and alert volume, you can talk to the ObserveOps team and walk through the numbers together.
FAQs
What is the best Datadog alternative?
Teams that want AI-driven correlation tied to a service desk tend to land on Motadata ObserveOps, cost-conscious OpenTelemetry-native teams lean toward SigNoz, and large enterprises chasing automated root cause often pick Dynatrace.
The best Datadog alternative depends on what is actually driving your switch. There is no single winner across every use case, which is why the comparison table above sorts by best fit rather than rank.
Is there a free or open source alternative to Datadog?
Yes, there are several free and open source alternatives to Datadog. SigNoz is fully open source and free to self-host, built natively on OpenTelemetry.
Grafana, Prometheus, and Loki form another common open-source combination, and New Relic's free tier is generous enough to run a small production service on at no cost.
Is Motadata ObserveOps a good Datadog alternative?
Motadata ObserveOps is a strong Datadog alternative for hybrid, regulated, or ITSM-tied teams specifically. ObserveOps unifies metrics, logs, flows, and traces under one AI engine that needs no training period, deploys on-premises or in the cloud, and can open and close a service desk ticket automatically from an alert.
It is a weaker fit if all you need is a narrow, single-purpose APM tool for one cloud-native app. Our Motadata vs Datadog comparison breaks the two down feature by feature, if you want more detail than a listicle entry can hold.
How hard is it to migrate off Datadog?
Migrating off Datadog is usually not the hard part, since the real effort scales with how deep your custom dashboards and alert rules go, not with the switch itself.
Teams standardized on OpenTelemetry have the easiest path, since OTel-native tools like SigNoz can often ingest the same instrumentation with minimal rework. Platforms with prebuilt dashboards and opinionated defaults, like SolarWinds Observability and Motadata ObserveOps, tend to shorten the rebuild time for alerting and views.
How do I keep observability costs predictable as I scale?
Keeping observability costs predictable as you scale comes down to watching ingestion volume as closely as feature usage, since that is where most platforms' bills actually grow.
Trimming noisy log sources, right-sizing custom metrics, and favoring platforms with flat or quote-based pricing over pure consumption billing all help. Our guide to cloud cost optimization covers the broader practice in more depth.
Author
Ramya Shah
Technical Writer
Ramya Shah is a technical content writer with a computer engineering background and roots in automotive journalism. He covers IT Service Management, observability, IT operations, and AI-driven automation. An early adopter of AI-assisted writing workflows, he turns complex IT processes into clear, engaging content optimized for search and answer engines (AEO), lifting content output and organic visibility.