What is Distributed Tracing? How a Request Becomes a Trace
A checkout request leaves the browser and touches seven services before anything comes back. Seven dashboards light up.
Every one of them reports a healthy number for its own service, and every one of them is telling the truth about a different slice of the work.
Nobody measured the request. That gap is what pushed tracing in beside metrics and logs as a core signal of observability.
In this blog, you will:
Read one real trace span by span, and find the 598 milliseconds hiding inside an 847 millisecond request.
Pull apart a real traceparent header and see what actually gets handed from one service to the next.
Spot the six ways a trace breaks before anyone reads it.
By the end you will open a trace and say where the time went.
What is Distributed Tracing?
Distributed tracing records a single request as it crosses a distributed system, then replays the whole path as one timeline.
The mechanics are plainer than the name suggests. A request arrives at the first service and picks up an identifier. Every service that touches it afterward stamps its own work with that same identifier, then reports when the work started and how long it ran.
Somewhere downstream a tracing backend collects those separate reports and puts them back in order by matching the identifier.
What comes out answers three questions no per-service dashboard can reach. Which services did this request touch? In what order did they run? And where did the time actually go?
One boundary is worth setting early. Tracing lives at the application layer, watching the calls your code makes, while host CPU and memory sit underneath it and belong to a different signal entirely.
What are Traces, Spans and Context Propagation?
Four terms carry almost all of distributed tracing. They stack on each other, so the fourth makes very little sense without the first three.
Term | What it is | What carries it |
Trace | One request, start to finish | A trace ID that every span shares |
Span | One unit of work inside the trace | Its own span ID, plus its parent's |
Trace ID | The identifier that ties the spans together | Created at the first service the request reaches |
Context propagation | Handing the trace ID to the next service | HTTP headers, usually traceparent |
What is a Trace?
A trace covers one request from arrival to answer, and it carries a single ID for its entire life. Every service along the route reports against that ID. The backend uses it to gather work from a dozen independent processes into one record.
What is a Span?
Spans are the units inside. An outbound API call makes a span. So does a database query, or a cache lookup, or any other piece of work worth timing on its own.
Each span records a start time and a duration. It also stores whether the work succeeded, plus a set of attributes describing what it did.
Each span also records its parent, which is what gives a trace its tree shape. Exactly one span in every trace has no parent at all. That one is the root, and its duration covers the entire request.
What is Context Propagation?
Propagation is the handoff. The calling service writes the trace ID and its own span ID into the outgoing request, and the receiving service reads them back out and continues the same trace instead of opening a new one.
The W3C Trace Context specification pins that handoff to two HTTP headers, traceparent and tracestate. A traceparent carries four fields joined by hyphens, and each field does a different job.
Field | Value in a real header | What it does |
The whole header | 00-4bf92f3577b34da6a3ce929d0e0e4736-00f067aa0ba902b7-01 | All four fields, joined by hyphens |
Version | 00 | Which version of the spec wrote the header |
Trace ID | 4bf92f3577b34da6a3ce929d0e0e4736 | 16 bytes, shared by every span in the trace |
Parent ID | 00f067aa0ba902b7 | 8 bytes, the span making this outbound call |
Trace flags | 01 | Last bit set, meaning this trace was sampled |
Because the format is agreed, a Java service instrumented with one library can hand a live trace to a Go service instrumented with another, and neither side needs to know anything about the other.
Propagation also fails more often than any other part of a tracing setup.
What a Real Trace Looks Like
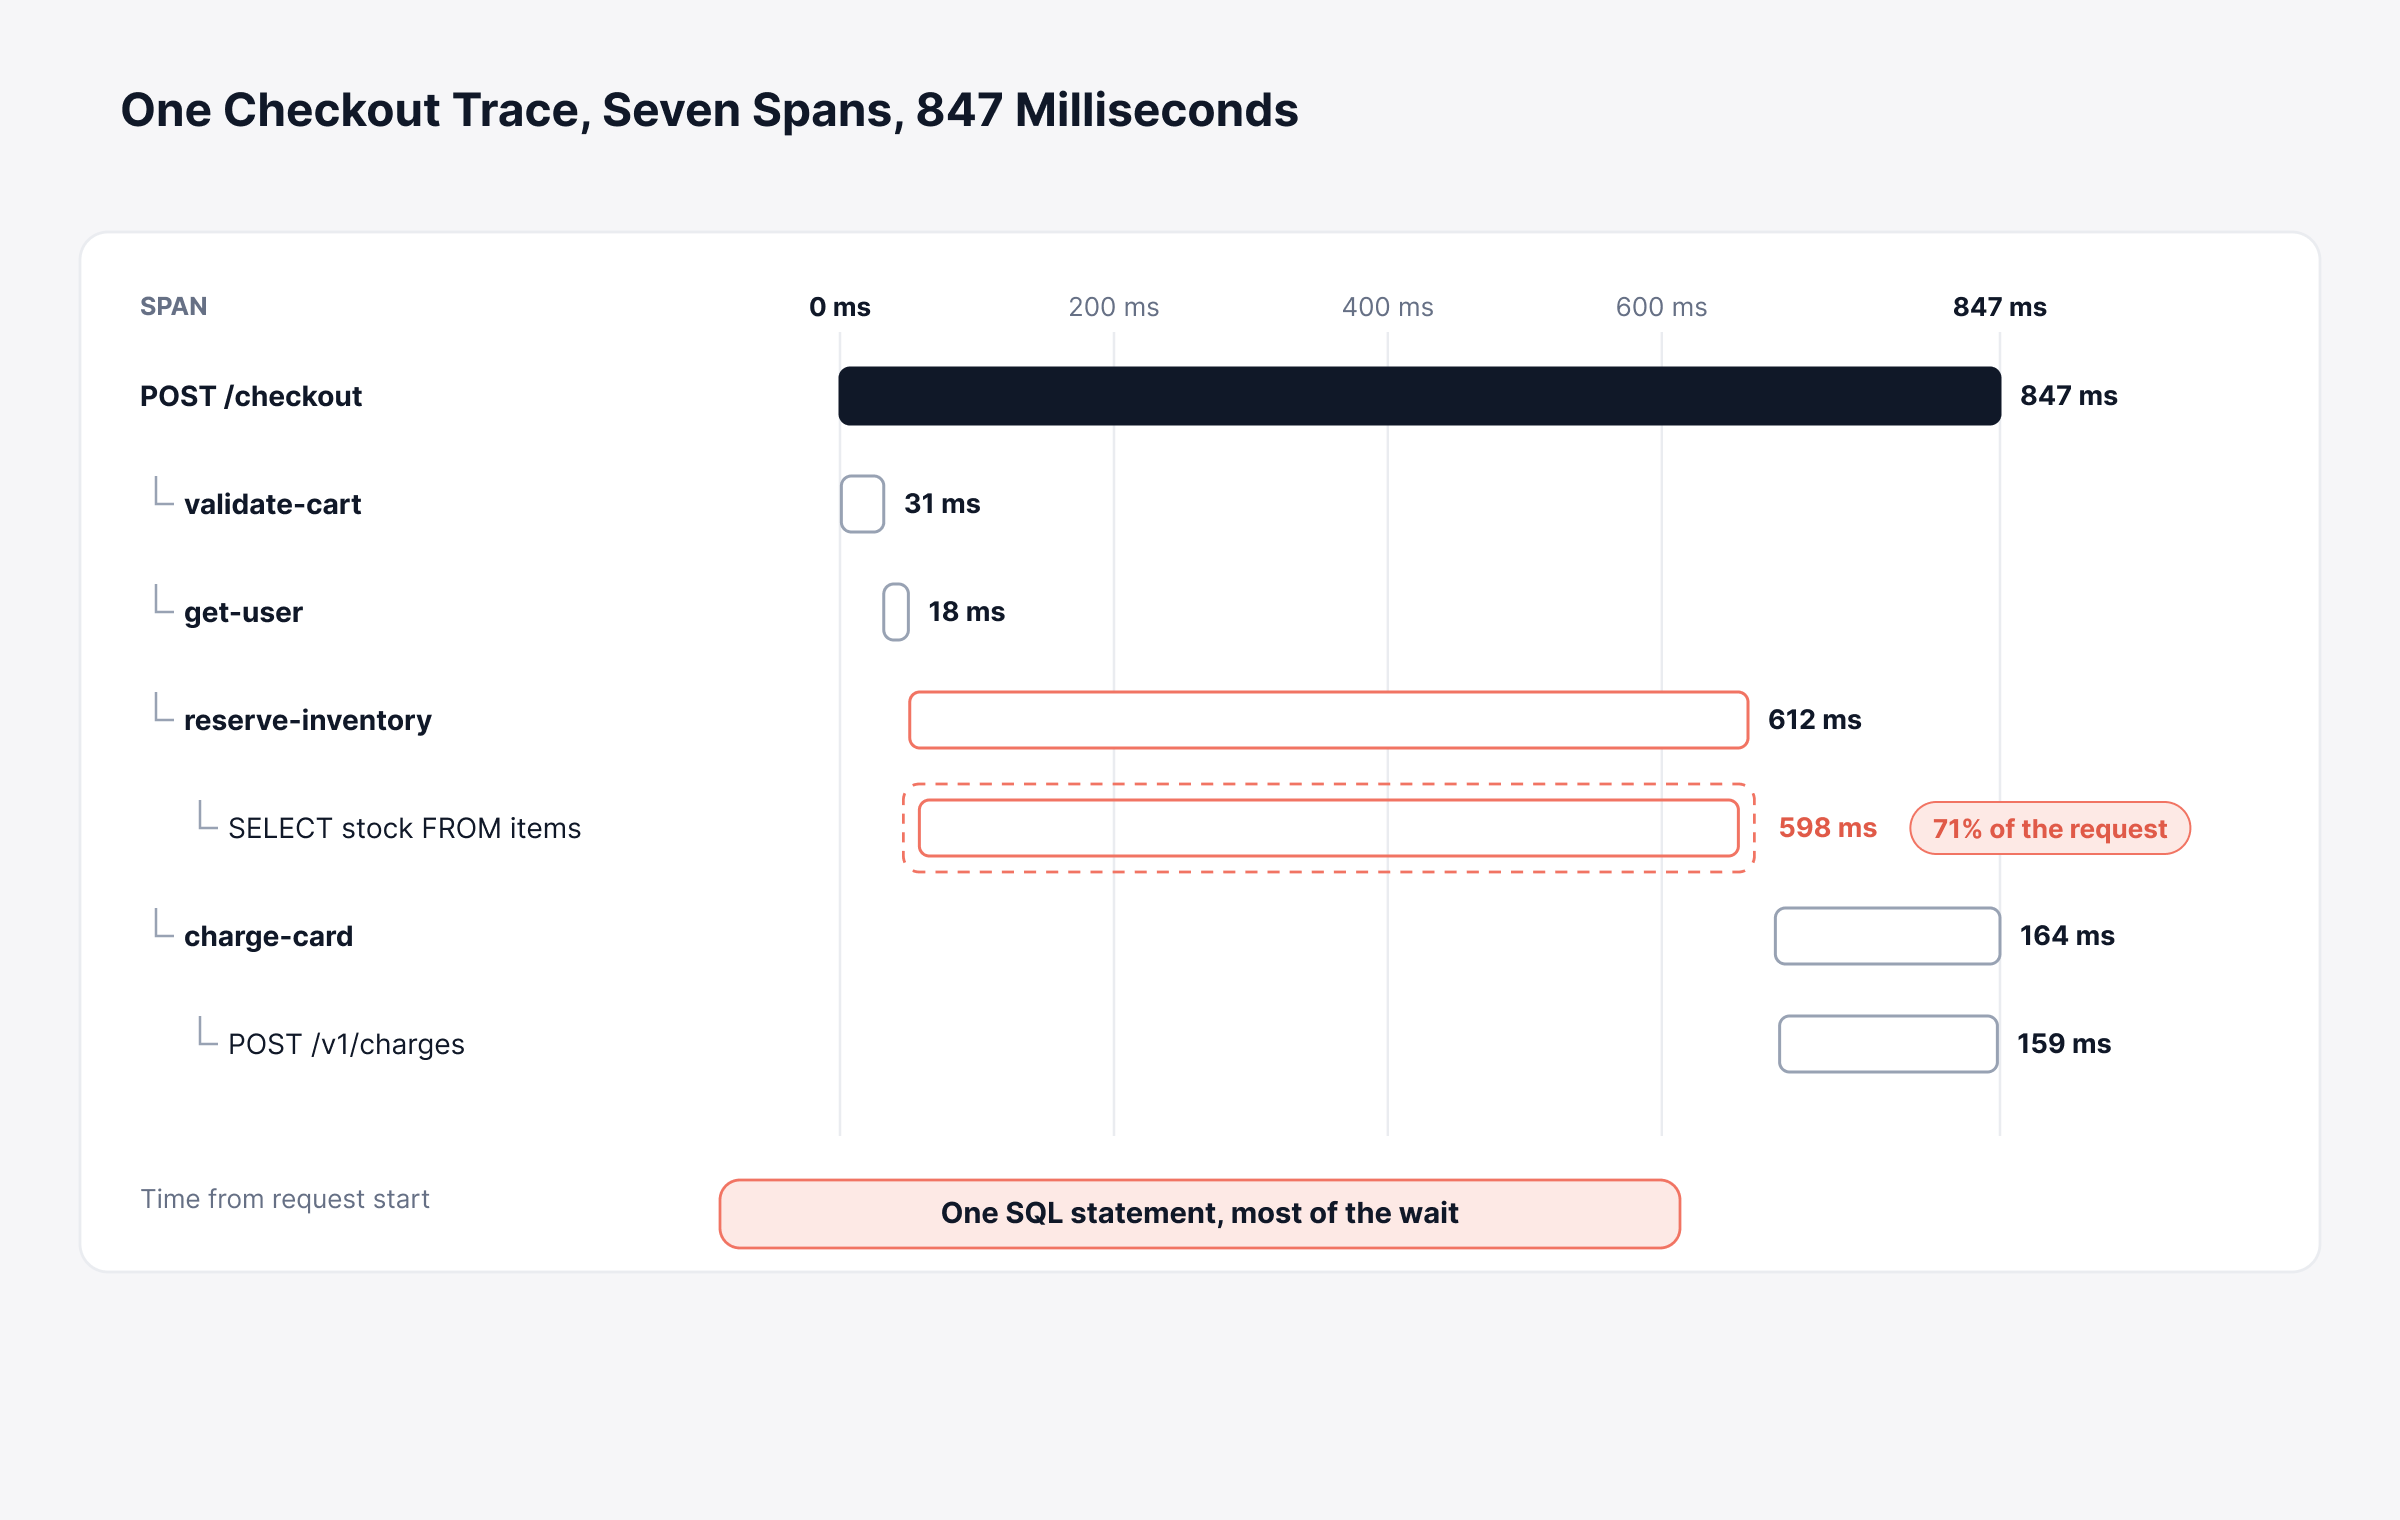
Reading one beats any amount of explanation. This checkout request took 847 milliseconds end to end.
Span | Service | Duration | Parent span |
POST /checkout | api-gateway | 847 ms | none, this one is the root |
validate-cart | cart-service | 31 ms | POST /checkout |
get-user | user-service | 18 ms | POST /checkout |
reserve-inventory | inventory-service | 612 ms | POST /checkout |
SELECT stock FROM items | postgres | 598 ms | reserve-inventory |
charge-card | payment-service | 164 ms | POST /checkout |
POST /v1/charges | payment gateway | 159 ms | charge-card |
The root span covers the whole request, and everything underneath it ran inside those 847 milliseconds. Four services did real work.
Cart validation and the user lookup finished in under 50 milliseconds between them, which is why nobody was ever going to find this problem by optimizing either one.
The payment call spent most of its 164 milliseconds waiting on an external gateway it does not control.
Then there is inventory, at 612 milliseconds. Nearly all of that time sat inside a single SQL statement, and that one statement accounted for 71 percent of the request a customer was waiting on.
A latency dashboard gives you a much weaker version of the same story. It reports inventory-service at 612 milliseconds, which is accurate and nearly useless. It never tells you the time went to one query, and it never names the table that query reads.
A flame chart draws the same spans as nested bars, which makes the long one obvious before you have read a single number.
Why Do Microservices Need Distributed Tracing?
Tracing earns its keep the moment a request stops fitting inside one process, which describes almost every microservices architecture running in production today.
A monolith makes this easy. One process handles the request. One log file holds the evidence, and a stack trace points straight at the line.
Once that monolith becomes twenty services, the evidence splits twenty ways. Every team keeps excellent telemetry for its own service, and not one of them holds the request. Four things change once traces exist.
The slow hop becomes findable: You read the answer off the trace instead of guessing which service to profile first.
Errors get attributed correctly: A failure surfacing in checkout often started three services downstream.
Dependencies stop being theoretical: Traces show which services really call each other, which rarely matches the architecture diagram anybody drew.
Ownership stops being an argument: The trace names the service and the operation, so the ticket reaches the right team first time.
Serverless sharpens the same problem considerably. The compute disappears the moment the request ends, so the trace is often the only lasting record that the function ever ran at all.
How Does Distributed Tracing Work?
Three stages stand between your code and a trace anybody can search.
Stage | What happens | Where it runs |
Instrumentation | Your code emits a span for each piece of work it does | Inside the application, through an SDK, an agent or eBPF |
Collection | Spans leave the app and get batched, sampled and forwarded | A collector process, usually close to the app |
Storage and analysis | Spans reassemble into traces and get indexed for search | The tracing backend |
The first stage is where teams get surprised. Manual instrumentation means opening the code and writing spans around the work you care about, service by service, and that bill comes due again for every service you add later.
Automatic instrumentation removes most of it. An agent attaches to the runtime and wraps the libraries everyone already uses, so HTTP clients, web frameworks and database drivers start emitting spans without anybody editing a file.
eBPF goes a step further on Linux by reading the calls straight from the kernel. The application is never touched.
OpenTelemetry sets the standard underneath nearly all of this. It defines the APIs and SDKs for instrumenting code, publishes the semantic conventions that keep attribute names consistent across languages, and ships a collector that processes and routes the data on its way out.
Most of the configuration happens through environment variables, so a working setup is smaller than people expect.
Variable | Example value | What it controls |
OTEL_SERVICE_NAME | inventory-service | The name every span from this app carries |
OTEL_EXPORTER_OTLP_ENDPOINT | http://collector:4317 | Where the spans get sent |
OTEL_TRACES_SAMPLER | parentbased_traceidratio | How the sampling decision gets made |
OpenTelemetry stores nothing and displays nothing, though. Your traces still need a backend to land in.
Distributed Tracing vs Logs and Metrics
Metrics, logs and traces answer different questions, and a team holding all three still has to know which one to open first.
Metrics | Logs | Traces | |
Answers | Is anything wrong? | What did this service record? | Where did this request spend its time? |
Shape | Numbers over time | Timestamped events | One ordered path per request |
Scope | Aggregate across everything | A single service | Every service the request touched |
Cost driver | Cardinality | Volume | Span count |
Strongest at | Alerting and trends | Detail on one event | Finding the slow hop |
Weakest at | Explaining one request | Crossing service boundaries | Long-term trends |
Most investigations run all three in the same order. A metric fires the alert. A trace narrows it to a service and an operation. The logs from that service then explain what went wrong inside it.
The join works when traces and logs both carry the trace ID. Once that ID sits on the log lines, you can jump from a slow span straight to what the service wrote while it was being slow. Getting the ID onto those lines usually falls to the telemetry pipeline that handles the data on its way through.
Where Traces Break
A broken trace rarely announces itself. It renders and looks perfectly reasonable, and the hop that went missing never shows up anywhere as an error. Six failures cause most of them.
What breaks | What you see | Cause |
A proxy strips the headers | One request becomes two unrelated traces | traceparent not forwarded |
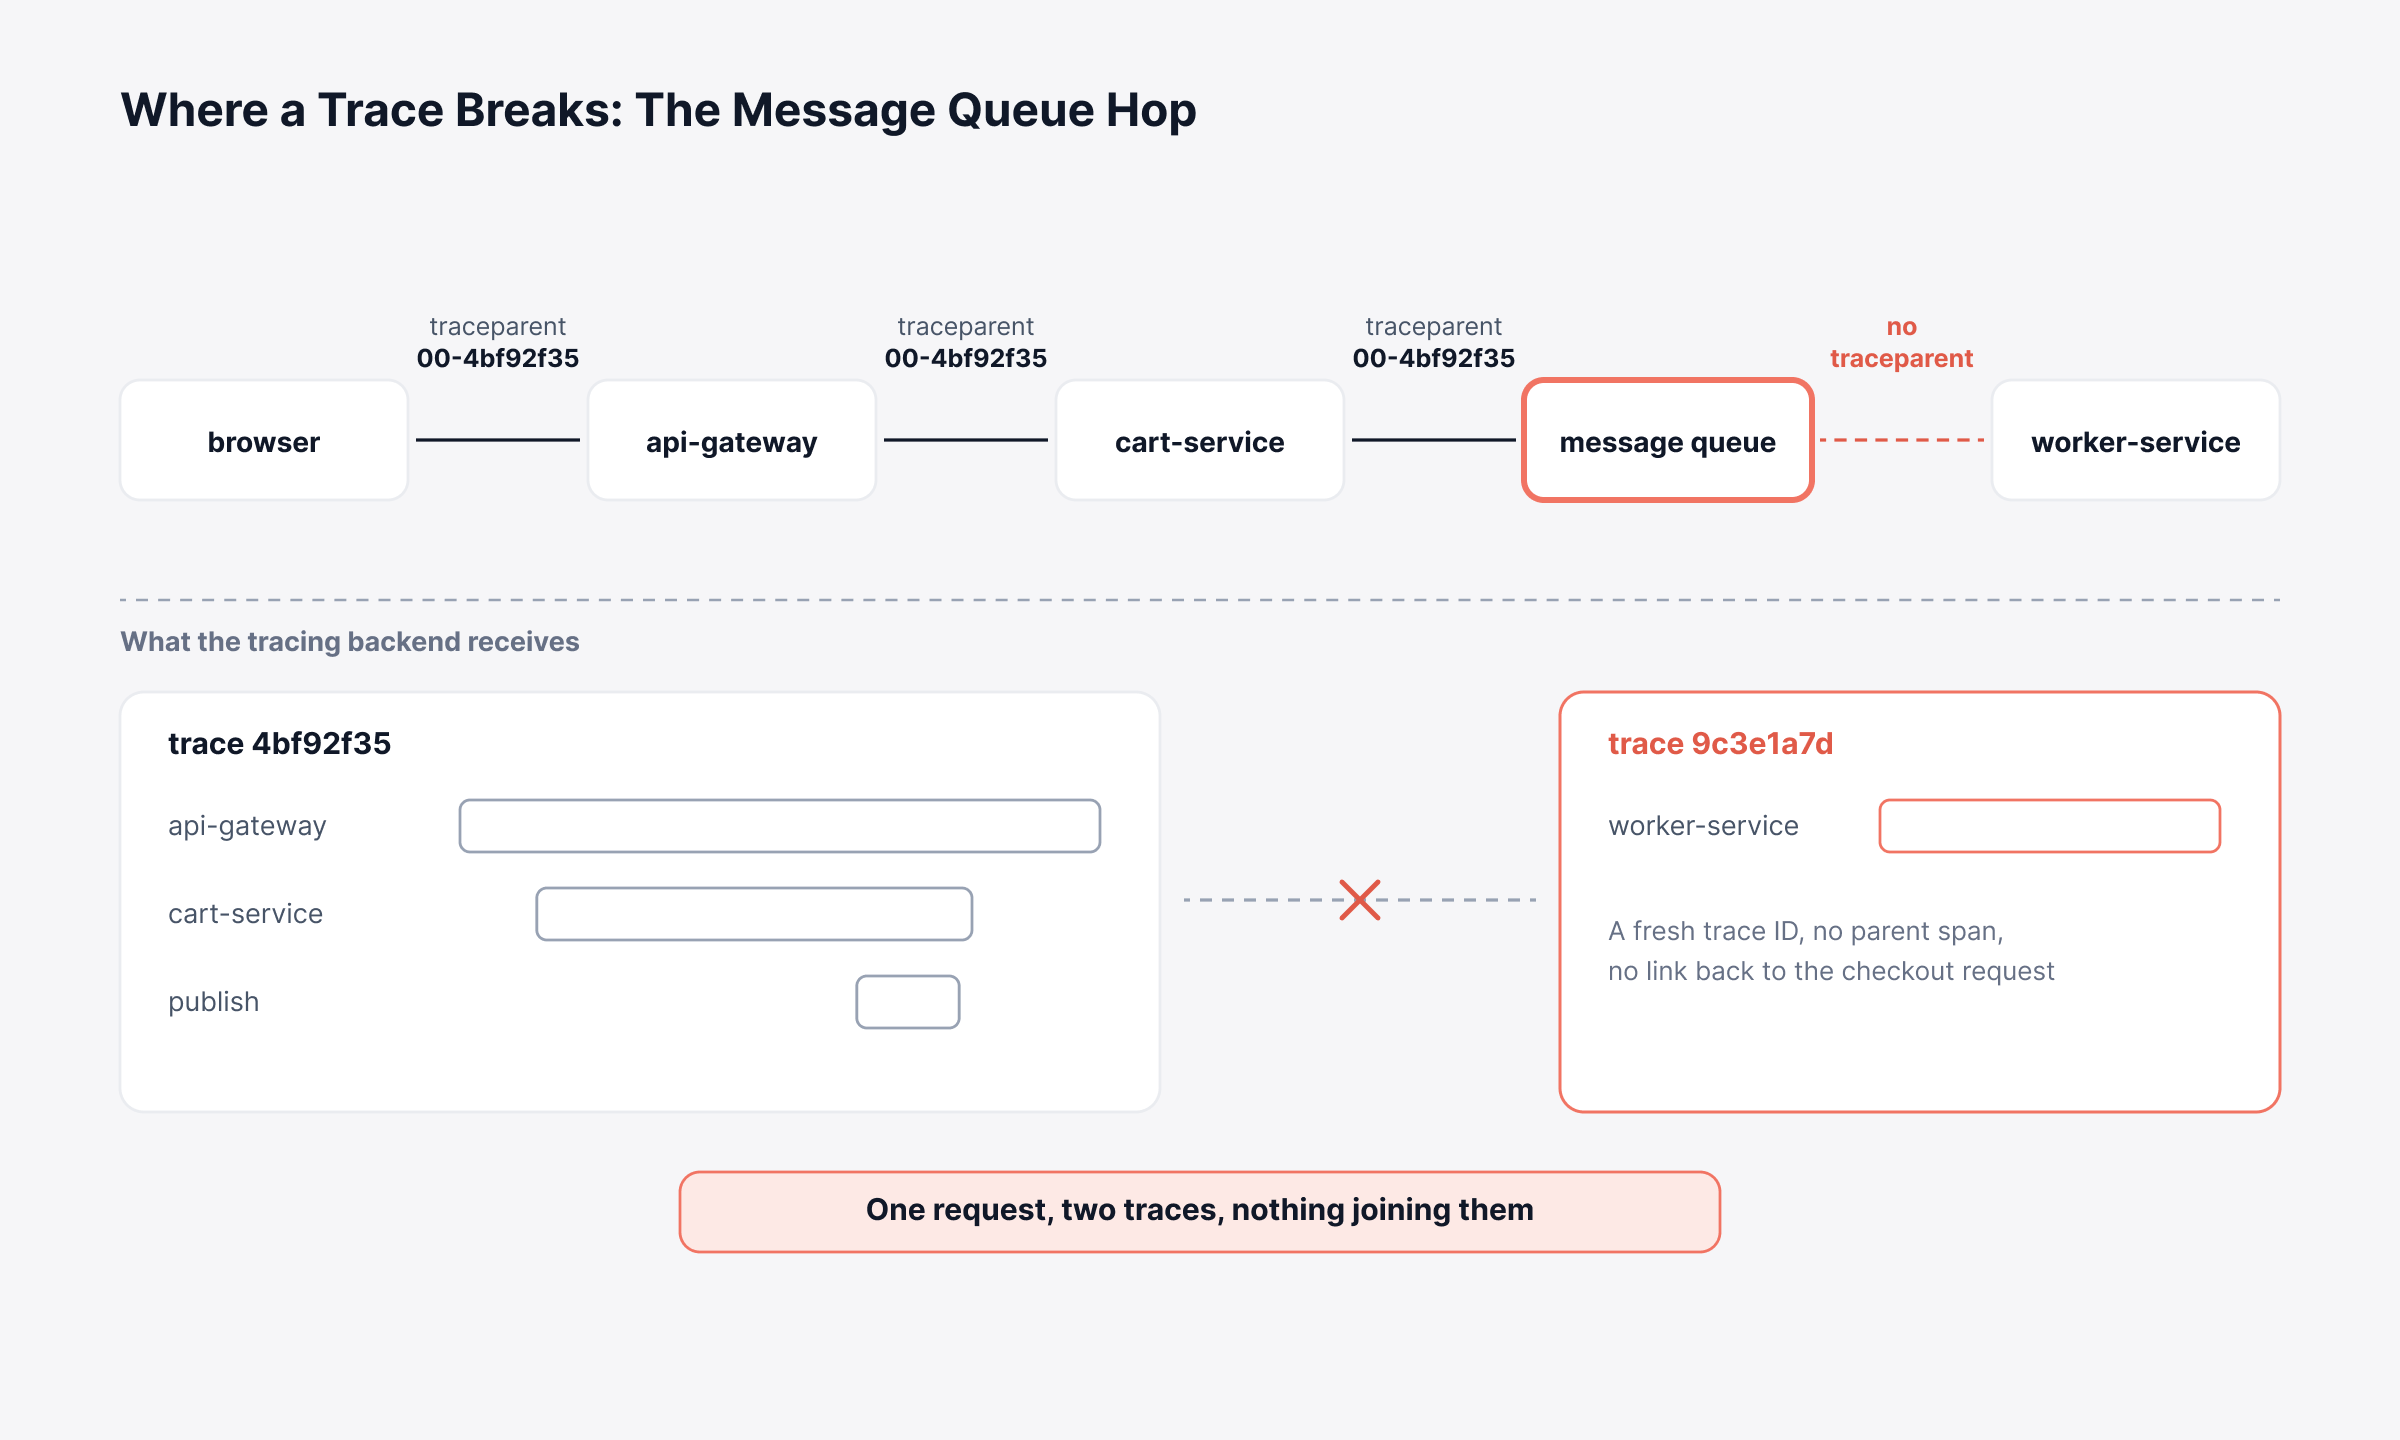
Work is handed to a queue | The consumer starts a fresh trace | Context never written into the message |
A service is uninstrumented | A gap in the middle of the path | No SDK or agent on that hop |
A library makes its own calls | Child spans missing under a parent | That client was never wrapped |
Host clocks disagree | A child span starts before its parent | Clock skew across machines |
Services sample independently | Traces that stop halfway | One service kept the request, the next dropped it |
Queues cause the most surprise by a wide margin. Teams instrument their HTTP calls with real care, then lose the trace at the first message broker, because nothing copies the context into a message body unless somebody writes the code to do it.
Sampling consistency is worth testing early too. Services that disagree about which traces to keep produce fragments, and a fragment costs you storage while answering nothing.
Since a half-built trace looks exactly like a working one, the tracing pipeline needs an alert of its own. We ship a No Trace Received alert for that reason. A service that quietly stopped reporting is otherwise indistinguishable from a service nobody happened to call.
Traces also read better next to the infrastructure underneath them. A span can run slow because the host it landed on ran out of memory, and those two facts only read as one story when they live in the same unified observability platform.
How Much Trace Data Should You Keep?
Almost nobody keeps everything. A busy system produces far more spans than any human will ever read, so sampling decides which traces survive, and the timing of that decision shapes what you can investigate afterward.
Head-based sampling decides at the very start of the request, before anybody knows how it ends. It costs almost nothing to run and it sets up in minutes, and the sample it keeps of ordinary traffic is fair enough for most trend work. The decision is also blind, so the request that turned into a twelve second failure survives only by luck.
Tail-based sampling waits for the request to finish and decides with the outcome already in hand. You keep every error and every slow trace, then retain a small percentage of the fast ones for a baseline.
Complexity is the price. Spans have to be buffered until the trace completes, which costs memory, and the routing has to be careful enough that every span belonging to one trace reaches the same collector.
Most teams end up somewhere outcome-aware, because the traces worth paying for are the ones that explain the incident in front of you.
How Do You Roll Distributed Tracing Out?
Tracing goes wrong when a team tries to instrument everything at once. Six steps keep the first month useful.
Pick one request path: Choose the journey that matters commercially, such as checkout or login, and leave the rest for later.
Instrument the edge first: Start at the service where requests arrive, because the trace ID gets created there.
Add the services on that path: Work outward one hop at a time, following the calls the first service makes.
Check propagation before you widen: Send a test request and confirm it arrives as one trace rather than three. Fixing this later costs far more.
Set sampling once you know your volume: Measure spans per minute for a week, then decide what to keep. Guessing first buys you a storage bill or an empty search.
Connect traces to everything else: Put the trace ID in your logs and link traces to host metrics, so one investigation uses one screen.
Our own tracing is built on OpenTelemetry standards. The APM module draws the spans and the flame charts with a service map over the top.
Our instrumentation covers eight languages: Java, .NET, PHP, Node.js, Python, Go, Ruby and C++. Coverage varies by platform, so check yours before planning around it.
eBPF saves the most setup time by a distance. It runs on Linux hosts, VMs and Docker containers with no code changes and no restart.
Java and .NET also get one-click instrumentation through auto-detection, and Kubernetes installs through an Operator built on OpenTelemetry.
Database calls get correlated back to the query itself across more than 40 databases, which is what turns a slow inventory span into a named SQL statement.
ObserveOps runs on infrastructure you own. That matters more than it sounds, because traces carry user IDs, request URLs and query text, and all of it stays inside your network.
Licensing works per instrumented application or per APM agent, never per span. The current edition is ObserveOps Infinity.
One limit is worth stating plainly. Flame charts show where the time went between spans, not line-level CPU inside a function. Continuous code profiling needs a different tool, and we do not claim it.
Trace One Request End to End with Motadata ObserveOps
A trace earns its place by refusing to generalize. It names the service, the operation and the milliseconds, which is more than an average will ever do for you.
Getting there takes longer than vendor pages admit. Instrumentation costs real engineering hours, propagation breaks in places nobody predicted, and the first few weeks of traces mostly teach a team what it forgot to instrument.
Start with one path anyway. ObserveOps can take that first one with eBPF, which puts spans on the screen without touching the application and keeps every trace on infrastructure you own.
Once a single request reads end to end, every incident on that path gets shorter, and the second path costs a fraction of the first. Teams that wire RUM and APM trace correlation together can then follow one user session from the browser all the way into the database it reached.
FAQs
What is the difference between tracing and distributed tracing?
Tracing records what happened inside one program or one service. Distributed tracing links those records across service boundaries with a shared trace ID, so a request touching ten services still reads as one path.
Do you need OpenTelemetry to use distributed tracing?
No, though it has become the default. OpenTelemetry standardizes how spans get produced and moved, which keeps you free to change backends later. It stores nothing itself, so you still need somewhere to send the traces.
Can you add distributed tracing without changing application code?
Often yes. Agents that wrap common libraries produce spans without edits, and eBPF reads calls from the Linux kernel with no code change and no restart. Custom business logic still needs manual spans.
How much overhead does distributed tracing add?
Well-tuned tracing usually costs a few percent of CPU, plus a little memory for buffering. Overhead climbs with span volume, so most of the tuning happens in sampling rather than in the instrumentation.
How is distributed tracing different from APM?
Distributed tracing works as one capability inside application performance monitoring. APM also covers error tracking, database query correlation and service maps, with traces as the signal tying them to a single request.
Author
Ramya Shah
Technical Writer
Ramya Shah is a technical content writer with a computer engineering background and roots in automotive journalism. He covers IT Service Management, observability, IT operations, and AI-driven automation. An early adopter of AI-assisted writing workflows, he turns complex IT processes into clear, engaging content optimized for search and answer engines (AEO), lifting content output and organic visibility.