Best New Relic Alternatives in 2026: 10 Observability Tools Compared
New Relic covers a lot of ground for one platform. APM, infrastructure, logs, browser data, and synthetics sit behind a single query language, and the hosts and containers you point at it cost nothing extra.
However, it bills you twice for the same telemetry: once for the data you send, and again for every engineer who wants to look at it.
The second meter is what starts most searches for New Relic alternatives. Full platform users list at $349 a month on Pro and $549 on Enterprise.
So, full access for ten engineers is a five-figure yearly decision, and ingest bills on top from $0.40 per GB. Our breakdown of New Relic pricing has the full model.
In this blog, you will see:
Ten New Relic alternatives compared on elements like pricing structure, telemetry breadth, deployment, and correlation depth.
A comparison table plus a full review of every tool, with the cons for each one.
A decision guide that matches your situation to a starting point, so you shortlist two tools instead of ten.
Where New Relic still wins, starting with the most generous free tier on this list.
By the end, you will know which of these ten tools deserves a trial against your own ingest volume and seat count.
If per-seat licensing is the reason you are here, screen every shortlist candidate on its pricing unit first. Two of the ten tools below charge nothing per user at all.
Why Do Teams Look for a New Relic Alternative?
Teams look for a New Relic alternative for three main reasons: per-user pricing that limits who gets access, a free tier that stops hard at 100 GB, and a platform that only runs as SaaS on a query language you cannot take with you.
1. Per-User Pricing Decides Who Gets to See the Data
Per-user pricing is the complaint that separates New Relic from every other platform on this list. Basic users are free and unlimited, which covers dashboard viewers, and core users start at $49 per month.
Full platform access, the tier that includes APM with distributed tracing, log management, and infrastructure monitoring, lists at $349 per user per month on Pro and $549 on Enterprise with annual upfront billing.
Those numbers turn observability into a rationing exercise. Someone has to decide which engineers are senior enough to hold a full license, and support staff and product owners usually lose that argument.
Incident response slows down when the person closest to the failing service cannot query the trace themselves.
A third meter sits behind the AI features. Advanced Compute bills at $0.60 per compute capacity unit and is required for New Relic AI, agentic AI, Live Archives, and unlimited cardinality.
So, the more you use the newer AI tooling to investigate an incident, the more that incident costs.
2. The Free Tier Stops Hard at 100 GB
New Relic's free tier gives you 100 GB of ingest a month, one full platform user, and unlimited basic users, with no credit card required. It is a genuinely useful offer and the reason many teams start there.
The ceiling is sharper than most teams expect. You get a warning email at 85 percent of the 100 GB, and once you cross it, ingest stops and you lose platform access until you upgrade or until the first of the next month.
Losing your monitoring during the month you outgrew it is a difficult thing to explain to a CTO.
3. NRQL and SaaS-Only Deployment Limit Your Options
NRQL, New Relic's query language, borrows SQL keywords without behaving like SQL, so the dashboards and saved queries your team spends two years perfecting do not move to another tool.
Teams standardizing on OpenTelemetry are doing it precisely to keep the collection layer swappable. Deployment is the harder constraint. New Relic is hosted SaaS, with an EU data region available at $0.05 per GB extra, and no on-premises option.
For a bank, a government department, or a telecom operator with data residency rules or an air-gapped segment, that ends the evaluation regardless of feature depth.
None of this makes New Relic a weak platform. It pioneered APM, and its instrumentation is faster to stand up than most of this list.
The model simply assumes a cloud-hosted estate and a small number of licensed experts, which describes fewer teams every year.
How We Evaluated These 10 Tools
We evaluated these ten New Relic alternatives against vendor documentation, published pricing pages, current G2 and Gartner Peer Insights ratings, and practitioner discussion on Reddit and Hacker News, the way a buyer actually researches a switch.
The pricing reflects public information at the time of writing, so confirm current numbers before you sign anything.
We weighed five factors:
Pricing unit: Whether the bill scales with seats, ingest, hosts, or events, since the unit matters more than the headline rate once you grow.
Telemetry breadth: Whether metrics, logs, traces, and network flows sit in one full-stack observability platform or across three tools with three bills.
Deployment flexibility: SaaS only, or on-premises, private cloud, and hybrid for teams under residency rules.
Correlation depth: Whether the platform connects signals and points at a cause, and how long it needs to learn your baseline before it does.
How far the loop closes: Whether an alert can open and close a service desk ticket, or dead-ends in a dashboard someone has to notice.
The 10 Best New Relic Alternatives Compared
Here is the shortlist of the top alternatives to New Relic at a glance:
Tool | Best For | Deployment | Pricing Model | Free Trial |
Motadata ObserveOps | Hybrid, regulated, ITSM-tied estates | On-prem, private/public cloud | Quote-based, no per-user meter | Yes, 30 days |
Datadog | Cloud-native breadth | SaaS | Per-host plus per-feature | Yes, 14 days |
Dynatrace | Enterprise automation and root cause | SaaS, managed | From $350/host/year, consumption | Yes, 15 days |
Grafana Cloud | Dashboard-first teams avoiding seat fees | Cloud or self-hosted | From $228/year plus usage | No, ongoing free tier instead |
Elastic Observability | Log-heavy, search-first environments | Cloud or self-managed | Usage-based | Yes, 14 days |
Splunk Observability | SRE and security-adjacent teams | SaaS | Per-host entry, quote-based above it | Yes, 14 days |
SigNoz | OpenTelemetry-native, cost-driven teams | Self-hosted or managed cloud | Free self-hosted, usage-based cloud | Yes, 30 days (SigNoz Cloud) |
Honeycomb | Debugging complex distributed systems | SaaS | Event-based, from $150/month | Free tier, 20M events/month |
IBM Instana | Zero-config microservices discovery | SaaS, agent-based | From $240/managed VM (Essentials) | Yes, 14 days |
Sentry | Error tracking for application teams | SaaS or self-hosted | From $26/month (annual billing) | Free Developer plan |
Detailed Reviews of the 10 Best New Relic Alternatives
The table above gives you the shape of these ten New Relic alternatives. The reviews below carry the trade-offs, the pricing detail, and the cons for each one, starting with Motadata ObserveOps.
1. Motadata ObserveOps
Best for: Enterprise IT and NOC teams that want observability priced by deployment, not per user, with ticketing built in.
Rating: 4.6/5 on G2 , 4.3/5 on Gartner Peer Insights, 4.7/5 on Capterra.
Motadata ObserveOps unifies metrics, logs, network flows, traces, and topology in a single backend, so the four or five point tools most hybrid estates stitch together collapse into one platform.
Pricing is quote-based and scoped to your deployment mode and modules, with no per-user tier gating who can query the data, which is the specific problem that pushes teams off New Relic.
The engine underneath is DFIT, our deep learning framework for IT operations. It runs causation-based correlation rather than threshold alerting, mapping dependencies, cutting alert noise, and flagging anomalies across every ingested signal.
The AI is adaptive and needs no training or baseline period, so you get usable root cause analysis in week one instead of week twelve.
Two capabilities separate it from the SaaS suites here. ObserveOps ingests network flows natively (NetFlow, sFlow, jFlow, and IPFIX), which most observability platforms treat as an afterthought, so a bandwidth problem and an application problem surface in the same view.
And because ObserveOps and Motadata ServiceOps share the same DFIT foundation as one unified observability and ITSM platform, an alert can raise a ticket, route it, and close it once the underlying issue clears.
Our customers have cut MTTR by up to 80 percent and downtime by 45 percent after consolidating onto one platform.
Numbers and star ratings only tell you so much, so it helps to hear from a team that runs the platform every day. This G2 review from one of our customers shows what that consolidation looks like in practice:
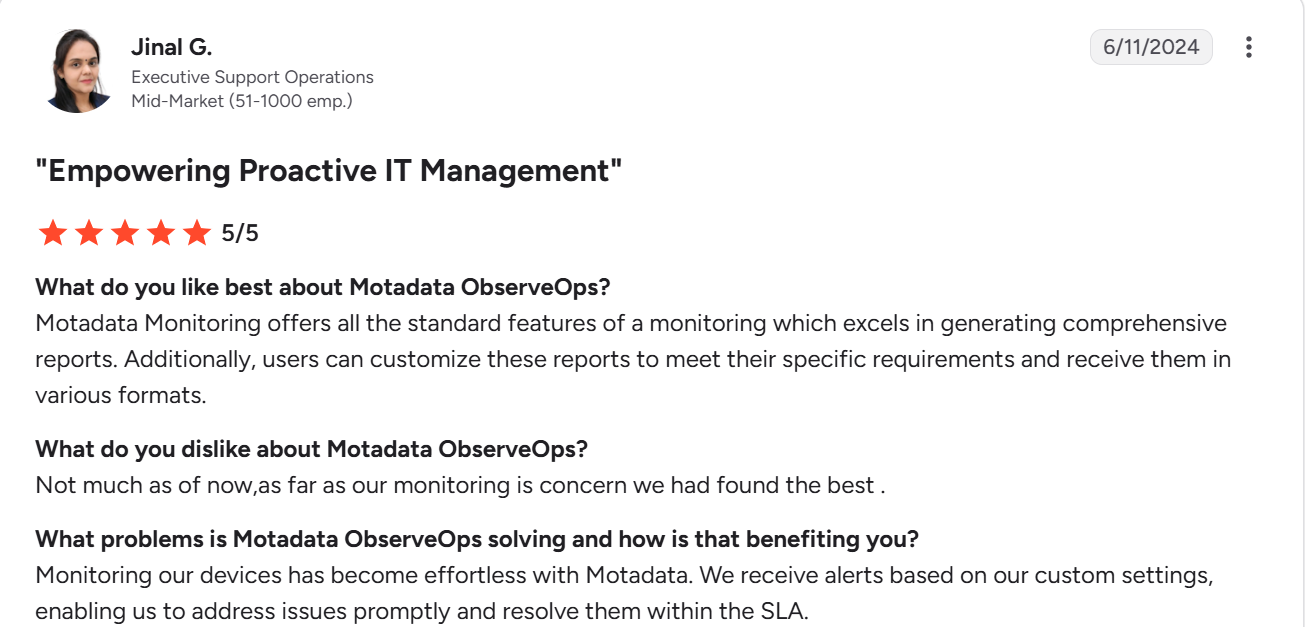
You can check out more of our G2 reviews here.
Pros
- No per-user licensing tier, so access does not have to be rationed by seat cost
- One backend for metrics, logs, flows, and traces instead of four stitched-together tools
- On-premises, private cloud, and public cloud deployment for BFSI, telecom, and government teams under residency rules
- Correlation works from day one, with no training window
- Closes the loop into ticketing rather than stopping at an alert
Cons
- Pricing is not published, so you go through a sales conversation before you see a number, unlike the open source options here
- There is no perpetual free tier to self-serve on, which New Relic does offer
- G2 and Capterra review volume (25 and 18) is thin next to the decade-old category giants, so there is less peer proof to lean on
- It is a broad ITOps platform, so a team that wants a narrow APM tool for one cloud-native app is buying more than it needs
Pricing: Quote-based, scoped to your deployment mode and the modules you need, with a 30-day free trial.
2. Datadog
Best for: Cloud-native teams that want the widest integration catalog and the deepest multi-signal SaaS coverage in one console.
Rating: 4.4/5 on G2.
Datadog is the tool most New Relic evaluations end up comparing against. It covers infrastructure monitoring, APM, log management, real user monitoring, synthetics, and a security suite.
It also has a very large integration library and dashboards that need little assembly. If your estate is mostly AWS, Azure, GCP, and Kubernetes, it is the fastest path to broad coverage.
Datadog solves the seat problem and moves the cost problem. It is generous with user counts compared to New Relic, then bills per host and per feature.
Hence, custom metrics and log volume become the line items you watch instead. It is also SaaS only. Our Motadata vs Datadog comparison covers the two side by side.
Pros
- Broadest multi-signal coverage of any SaaS platform here
- More generous with user seats than New Relic
- Fast time to a useful dashboard
- Large community and integration ecosystem
Cons
- Per-host plus per-feature billing gets expensive as the estate grows
- High-cardinality custom metrics inflate the bill quickly
- SaaS only, with no on-premises deployment
- Costs are hard to forecast month to month
Pricing: Per-host plus per-feature modules, with a 14-day free trial.
3. Dynatrace
Best for: Large enterprises running deep microservice estates that want automated root cause instead of hand-built dashboards.
Rating: 4.5/5 on G2, 4.6/5 on Gartner Peer Insights.
Dynatrace is the platform teams pick when New Relic feels too manual. OneAgent installs once and instruments hosts, services, and containers without manual tagging.
Its Davis AI engine correlates the anomaly, maps the dependency chain, and names a probable cause. For an estate too complex to dashboard by hand, that automation is the whole value.
The price reflects it. Dynatrace sits near the top of this list at published rates from $350 per host annually on a consumption model, and its depth means real ramp-up time for a smaller team.
You are also trading one proprietary platform for another, so if portability is what drove you off New Relic, that concern does not go away. Check out our guide to Dynatrace alternatives to understand in detail how some of these tools compare with Dynatrace.
Pros
- Strongest automated root cause of the SaaS platforms here
- Dependency mapping with no manual tagging
- Deep enterprise APM and Kubernetes coverage
- Mature governance for large organizations
Cons
- Among the most expensive options on this list
- Consumption pricing needs careful scoping to forecast
- Proprietary agents and query language, so lock-in concerns carry over
- Heavier than a small, single-cloud team needs
Pricing: Consumption-based, from $350 per host annually per published tiers, with a 15-day free trial.
4. Grafana Cloud
Best for: Dashboard-first teams that want to escape seat licensing entirely and have the engineering time to assemble a stack.
Rating: 4.5/5 on G2, 4.6/5 on Gartner Peer Insights.
Grafana Cloud bundles Prometheus for metrics, Loki for logs, and Tempo for traces as a managed service, so you get the open source Grafana stack without operating the storage tiers.
It bills on usage rather than users, which is the direct answer to New Relic's per-seat model, and its free tier is real enough to run a small service on.
You are assembling a platform rather than buying one. Correlating a log line to a trace to a metric takes configuration that an opinionated platform does for you.
Moreover, your team learns three query languages (PromQL, LogQL, and TraceQL) instead of one. Our guide to Grafana alternatives covers where that trade stops being worth it.
Pros
- No seat licensing, so the whole team gets access
- Unmatched visualization flexibility across data sources
- Open source components you can self-host instead
- Generous free tier to start on
Cons
- Full observability needs several components working together, not one workflow
- Three query languages to learn across metrics, logs, and traces
- Correlation and alerting are less opinionated than a purpose-built platform
- You trade licence cost for engineering time
Pricing: Free tier available, paid plans from $228 annually plus usage-based fees.
5. Elastic Observability
Best for: Log-heavy environments and teams already running the Elastic Stack who want search-first observability.
Rating: 4.2/5 on G2, 4.5/5 on Gartner Peer Insights.
Elastic Observability runs on Elasticsearch, so full-text search across very large log volumes is where it beats everything else here.
Machine learning jobs flag anomalies, APM and metrics sit alongside logs in Kibana, and you can run it self-managed or on Elastic Cloud, which gives regulated teams a path New Relic does not offer.
It gets heavier the moment you step outside log-centric work. Reviewers testing it for APM and tracing describe the workflow as clunkier than a purpose-built tool.
Additionally, operating Elasticsearch at scale (shards, heap, cluster health) comes with its own challenges. Our guide to Elasticsearch alternatives has the full picture.
Pros
- Best full-text search over large log volumes on this list
- Self-managed option for teams that cannot use hosted SaaS
- Natural fit if you already run the Elastic Stack
- Large integration ecosystem
Cons
- APM and tracing feel heavier than dedicated tools
- Running Elasticsearch at scale takes real operational investment
- Usage-based pricing needs active monitoring as data grows
- Licensing history makes some teams cautious
Pricing: Usage-based, with free and paid tiers by infrastructure size and ingest, plus a 14-day Elastic Cloud trial.
6. Splunk Observability
Best for: SRE teams already running Splunk for logging or security that want observability without a second vendor relationship.
Rating: 4.3/5 on G2, 4.4/5 on Gartner Peer Insights.
Splunk Observability handles high-dimension metrics at scale, traces without sampling, and alerting mature enough for complex containerized platforms.
If Splunk is already in the building for SIEM or log management, consolidating observability onto it is a lighter procurement lift than onboarding a new vendor.
Reviewers name the same two problems repeatedly: a genuine learning curve, and a cost curve you have to plan for well ahead of renewal.
With no existing Splunk footprint, most of the consolidation argument disappears. Our guide to Splunk alternatives covers the wider platform.
Pros
- Full-fidelity tracing with no sampling gaps
- One vendor for observability and security data
- Mature alerting and programmatic control
- Proven at very large data volumes
Cons
- Steep learning curve for teams new to the platform
- Costs need active planning as data volume grows
- Interface favours data analysts over developers wanting a quick answer
- Much less compelling without an existing Splunk investment
Pricing: Per-host entry pricing with a 14-day free trial; enterprise plans are quote-based.
7. SigNoz
Best for: Cost-driven engineering teams on OpenTelemetry that want a platform they can self-host and never pay a seat fee for.
Rating: No G2 or Gartner Peer Insights listing yet.
SigNoz is the closest thing to an open source New Relic, and the tool that shows up in nearly every search for one. It puts logs, metrics, and traces in a single application built natively on OpenTelemetry.
So, if your services already emit OTel data, pointing them at SigNoz is close to a drop-in swap. Its ClickHouse backend keeps aggregation fast at production volumes, and self-hosting removes user licensing from the equation completely.
You supply the operations. Running SigNoz at scale needs someone comfortable managing ClickHouse, and the ecosystem of integrations and third-party guides is smaller than a fifteen-year-old vendor's.
SigNoz Cloud removes the ops burden and reintroduces volume-based billing, which is worth modelling before you assume it is the cheap option.
Pros
- Genuinely open source and free to self-host, with no seat licensing
- Closest literal New Relic swap for OTel-native stacks
- Predictable infrastructure cost you control
- Self-hosting keeps data inside your own environment
Cons
- Self-hosting at scale needs real ClickHouse expertise in-house
- Smaller integration ecosystem than established vendors
- Lacks the edge-case depth New Relic accumulated over fifteen years
- SigNoz Cloud bills on volume, so the savings need checking against your ingest
Pricing: Open source core is free to self-host. SigNoz Cloud includes a 30-day free trial with no card required.
8. Honeycomb
Best for: Teams debugging complex distributed systems who need to ask questions they did not build a dashboard for.
Rating: 4.5/5 on G2.
Honeycomb is built around high-cardinality querying, which means you can slice production traffic by user ID, build version, feature flag, or any other attribute without planning for it in advance.
For a team whose New Relic frustration is investigation speed rather than cost, that is the capability worth switching for. Its trace waterfall and BubbleUp workflow are designed to answer why this request is slow rather than which host is red.
It is not an infrastructure monitoring platform. Honeycomb expects instrumented, event-rich services and does far less for your switches, VMs, and network links, so most teams run it next to something else.
Pricing is event-based, which decouples cost from seats but ties it to how chatty your instrumentation is.
Pros
- Fastest investigation workflow here for genuinely unknown failures
- Event-based pricing rather than per-seat licensing
- Free tier of 20 million events a month is usable for a small service
- Strong OpenTelemetry alignment keeps instrumentation portable
Cons
- Thin on infrastructure and network monitoring, so it rarely replaces New Relic alone
- Event-based billing gets expensive as instrumentation grows richer
- Needs a team willing to invest in good instrumentation to pay off
- SaaS only, with no self-hosted option
Pricing: Free tier up to 20 million events a month; Pro from $150 per month, billed per million events; Enterprise is quote-based.
9. IBM Instana
Best for: Microservices estates that want automatic discovery and unsampled tracing without a long setup project.
Rating: 4.4/5 on G2, 4.4/5 on Gartner Peer Insights.
Instana auto-discovers services the moment its agent lands on a host, then traces every request without sampling, so nothing gets dropped before you need it.
IBM acquired Instana in 2020 and kept the original focus on automated dependency mapping and always-on profiling with almost no manual tagging.
Billing is per host rather than per trace or per gigabyte, so a busy service does not generate a bigger invoice than a quiet one, which is a real advantage over New Relic's ingest meter.
The trade-off is flexibility: teams that want to shape every dashboard by hand find Instana more opinionated than Grafana Cloud, and it is aimed at enterprise budgets.
Pros
- Near-zero manual configuration to get useful data
- Per-host billing with no trace or ingest overages
- Full-fidelity tracing with no sampling gaps
- Strong fit for microservices-heavy enterprises
Cons
- Less flexible than dashboard-first platforms
- Enterprise pricing does not favour small teams
- Fewer open source integration paths than OTel-native tools
- Network and flow visibility is thinner than a full ITOps platform
Pricing: From $240 per managed virtual server (Essentials tier), billed per host, with a 14-day free trial.
10. Sentry
Best for: Application and frontend teams whose real need is error and crash detail rather than infrastructure observability.
Rating: 4.5/5 on G2 (219 reviews).
Sentry is worth naming because a large share of teams using New Relic mainly use it to find out why a release broke.
Sentry does that specific job better and for a fraction of the price, with stack traces, release tagging, breadcrumbs, and session replay that take you to the offending line of code.
It has since added performance monitoring and tracing, so the gap with a light APM tool is narrower than it was.
It is not a New Relic replacement for infrastructure. There is no network monitoring, no host-level estate view, and no flow analysis, so an IT operations team will pair it with something broader.
Quotas are set per error, span, and replay, which is predictable at small volumes and needs watching at large ones.
Pros
- Best error and crash detail on this list, by a clear margin
- Very low entry cost compared with any APM contract
- Unlimited users on paid plans, so nobody is locked out
- Self-hosted option for teams that need to keep data in-house
Cons
- No infrastructure, network, or flow monitoring, so it covers part of the job
- Quotas on errors, spans, and replays need managing at scale
- Most teams run it alongside a second tool rather than instead of one
- Less useful for an operations team than for a development team
Pricing: Free Developer plan; Team from $26 per month and Business from $80 per month on annual billing ($29 and $89 billed monthly); Enterprise is quote-based.
How Do You Choose the Right New Relic Alternative?
The right New Relic alternative depends on which part of the New Relic model pushed you out. So match yourself to the closest situation below rather than chasing the longest feature list.
Your Situation | Start With | Why |
Hybrid or regulated estate with a service desk to feed | Motadata ObserveOps | One backend for metrics, logs, flows, and traces, on-premises deployment, and alerts that open and close tickets |
Cloud-native team that wants the widest coverage in one SaaS | Datadog | Broadest integration catalog and multi-signal depth, if you can manage host and feature costs |
Large enterprise that wants root cause found for you | Dynatrace | OneAgent discovery and Davis AI replace the correlation work you would build by hand |
Leaving specifically because of per-seat pricing | Grafana Cloud | Usage-based billing with no seat fees, and the most flexible dashboards here |
Log-heavy environment, search is the priority | Elastic Observability | Elasticsearch-grade search with a self-managed option New Relic cannot offer |
Already running Splunk for logs or security | Splunk Observability | One vendor across observability and security data, with no-sample tracing |
Standardized on OpenTelemetry and want to self-host | SigNoz | Closest literal swap, free to run, and no user licensing at all |
Investigation speed matters more than cost | Honeycomb | High-cardinality querying answers questions you did not build a dashboard for |
Microservices estate that wants zero configuration | IBM Instana | Auto-discovery and unsampled tracing, billed per host instead of per gigabyte |
You mainly used New Relic to debug releases | Sentry | Better error and crash detail for a fraction of an APM contract |
Use the difference between observability and monitoring as a gut check too. If you need threshold alerts on failure modes you already understand, several tools here are more platform than you need.
If you need to ask new questions of a hybrid estate during an incident, the correlation layer is what you are actually buying.
Replace New Relic With Motadata ObserveOps
New Relic earned its position. It pioneered APM, its agents are quick to stand up, NRQL is genuinely powerful once you know it, and 100 GB with a full user for free is the most generous entry point in this comparison.
For a small team on one cloud that wants to self-serve dashboards this afternoon, it is still a reasonable answer.
The model gets harder to defend as you grow. Full platform access at $349 to $549 per user per month means someone decides who is allowed to investigate, ingest bills on a second meter, AI features bill on a third, and none of it runs inside your own data centre.
For hybrid, regulated, or ITSM-tied teams, Motadata ObserveOps is the strongest starting point on this list.
ObserveOps unifies metrics, logs, network flows, and traces in one backend, correlates them with DFIT from day one without a training period, deploys on-premises or in the cloud across six modes, and closes the loop into a service desk instead of stopping at an alert.
We power IT operations for more than 500 enterprises across 30-plus countries on that model.
It will not suit everyone. A developer-led team that wants a free tier and a credit card checkout will get further with New Relic's own free plan or SigNoz, and a team that only needs release debugging should look at Sentry first.
If you want to see where ObserveOps lands against your deployment model, your ingest volume, and the number of people who need access, talk to the ObserveOps team and walk through the numbers.
FAQs
Can I switch off New Relic without re-instrumenting my services?
You can keep your instrumentation if your services already emit OpenTelemetry data, since any OTLP-native platform, ObserveOps included, ingests it after a configuration change. Rebuilding dashboards and alert rules is the real work, because NRQL queries do not port anywhere.
How long does New Relic keep my data?
New Relic's free tier keeps data for at least 8 days, and Data Plus adds up to 90 days over the default for most data types. Extended retention is a paid add-on at $0.05 per GB per 30 days, so decide how much history you need before comparing quotes.
Does New Relic include a service desk to act on alerts?
New Relic does not include a service desk, so it detects and alerts, then hands off to whatever ticketing tool you run separately. Motadata ObserveOps shares its DFIT foundation with ServiceOps, which lets an alert open a ticket, route it, and close it once the issue clears.
Is Motadata ObserveOps a good New Relic alternative?
Motadata ObserveOps fits hybrid, regulated, and ITSM-tied teams best. It unifies metrics, logs, flows, and traces in one backend, correlates them with no training period, deploys on-premises across six modes, and prices by deployment rather than per user. It has no perpetual free tier, which New Relic does offer.
Author
Ramya Shah
Technical Writer
Ramya Shah is a technical content writer with a computer engineering background and roots in automotive journalism. He covers IT Service Management, observability, IT operations, and AI-driven automation. An early adopter of AI-assisted writing workflows, he turns complex IT processes into clear, engaging content optimized for search and answer engines (AEO), lifting content output and organic visibility.