WAN Link Monitoring for Faster Branch Troubleshooting
Why do users at a branch complain about choppy calls and stalled apps when every WAN circuit on the dashboard still shows up? A link can be reachable without being healthy. Delay and packet loss can rise for hours on a live circuit, and a simple up-or-down check will report nothing unusual the whole time.
WAN link monitoring checks the quality of each site-to-site connection by having routers send their own test packets and time the replies. This matters more as branches run on a mix of private MPLS circuits, broadband and LTE from different carriers. Every carrier commits to a service level, yet holding them to it takes evidence the business gathers itself.
This guide explains how probe-based monitoring works across a wide area network and which signals deserve an alert. In this blog, you will see why link quality affects the business, the metrics and probe types that matter, the hurdles in multi-vendor networks, and how Motadata ObserveOps monitors WAN links on Cisco and Juniper devices, now including Cisco NX-OS.
Why does WAN Link Monitoring Matter to the Business?
WAN link monitoring matters to the business because so much revenue now depends on rented circuits. Branch sales, customer calls and cloud apps all cross links that a carrier owns. So when one of those links slows down, people feel it in slow checkouts and idle staff long before a ticket gets logged.
Branch productivity: Staff at remote sites lose time when cloud apps and calls stall, even if the link never goes fully down
Carrier accountability: Measured latency and loss give you evidence for SLA compliance discussions and service credit claims
Smarter bandwidth spend: Utilization history shows whether a link truly needs an upgrade or the slowdown starts somewhere else
Faster root cause: Knowing whether a fault lies with the carrier or inside your own network decides who acts first
Example: Consider a retail chain whose stores run card payments and voice calls over broadband. Every link reports full availability, yet one store's calls break up most afternoons. Jitter history for that link lines up with the carrier's busy hours, which gives the network lead a dated record to put in front of the carrier.
That record only exists if the right metrics are tracked on every link from the start.
Which WAN Link Metrics Should you Track?
WAN link monitoring relies on five core metrics, and together they tell you if a circuit is just reachable or good enough for the applications running over it. Availability on its own tells you very little. You learn far more from the other four, since they describe how the link behaves while it stays up.
Availability: Whether the far end of the link responds at all, tracked over time as uptime
Latency: How long a packet takes to make the round trip, reported as round-trip time or RTT, and felt by users as sluggish applications
Packet loss: The share of test packets that never come back, which shows up as frozen video and failed transactions
Jitter: The variation in delay between consecutive packets, which voice and video calls feel first
Utilization: How much of the circuit's capacity is in use, which explains many latency spikes and guides upgrade decisions
On branch links, watch WAN latency and jitter most closely. Both can worsen for days while availability still reads 100%. Network latency has many causes, including congestion and long carrier routes, so judge each link against its own baseline.
For voice, the ITU-T G.114 recommendation says most applications see little effect while one-way delay stays under 150 milliseconds. Treat that as an outer limit for interactive traffic and tighten each link's alerts once its usual range is clear. How those numbers get measured comes down to probes.
How do WAN Link Probes Work?
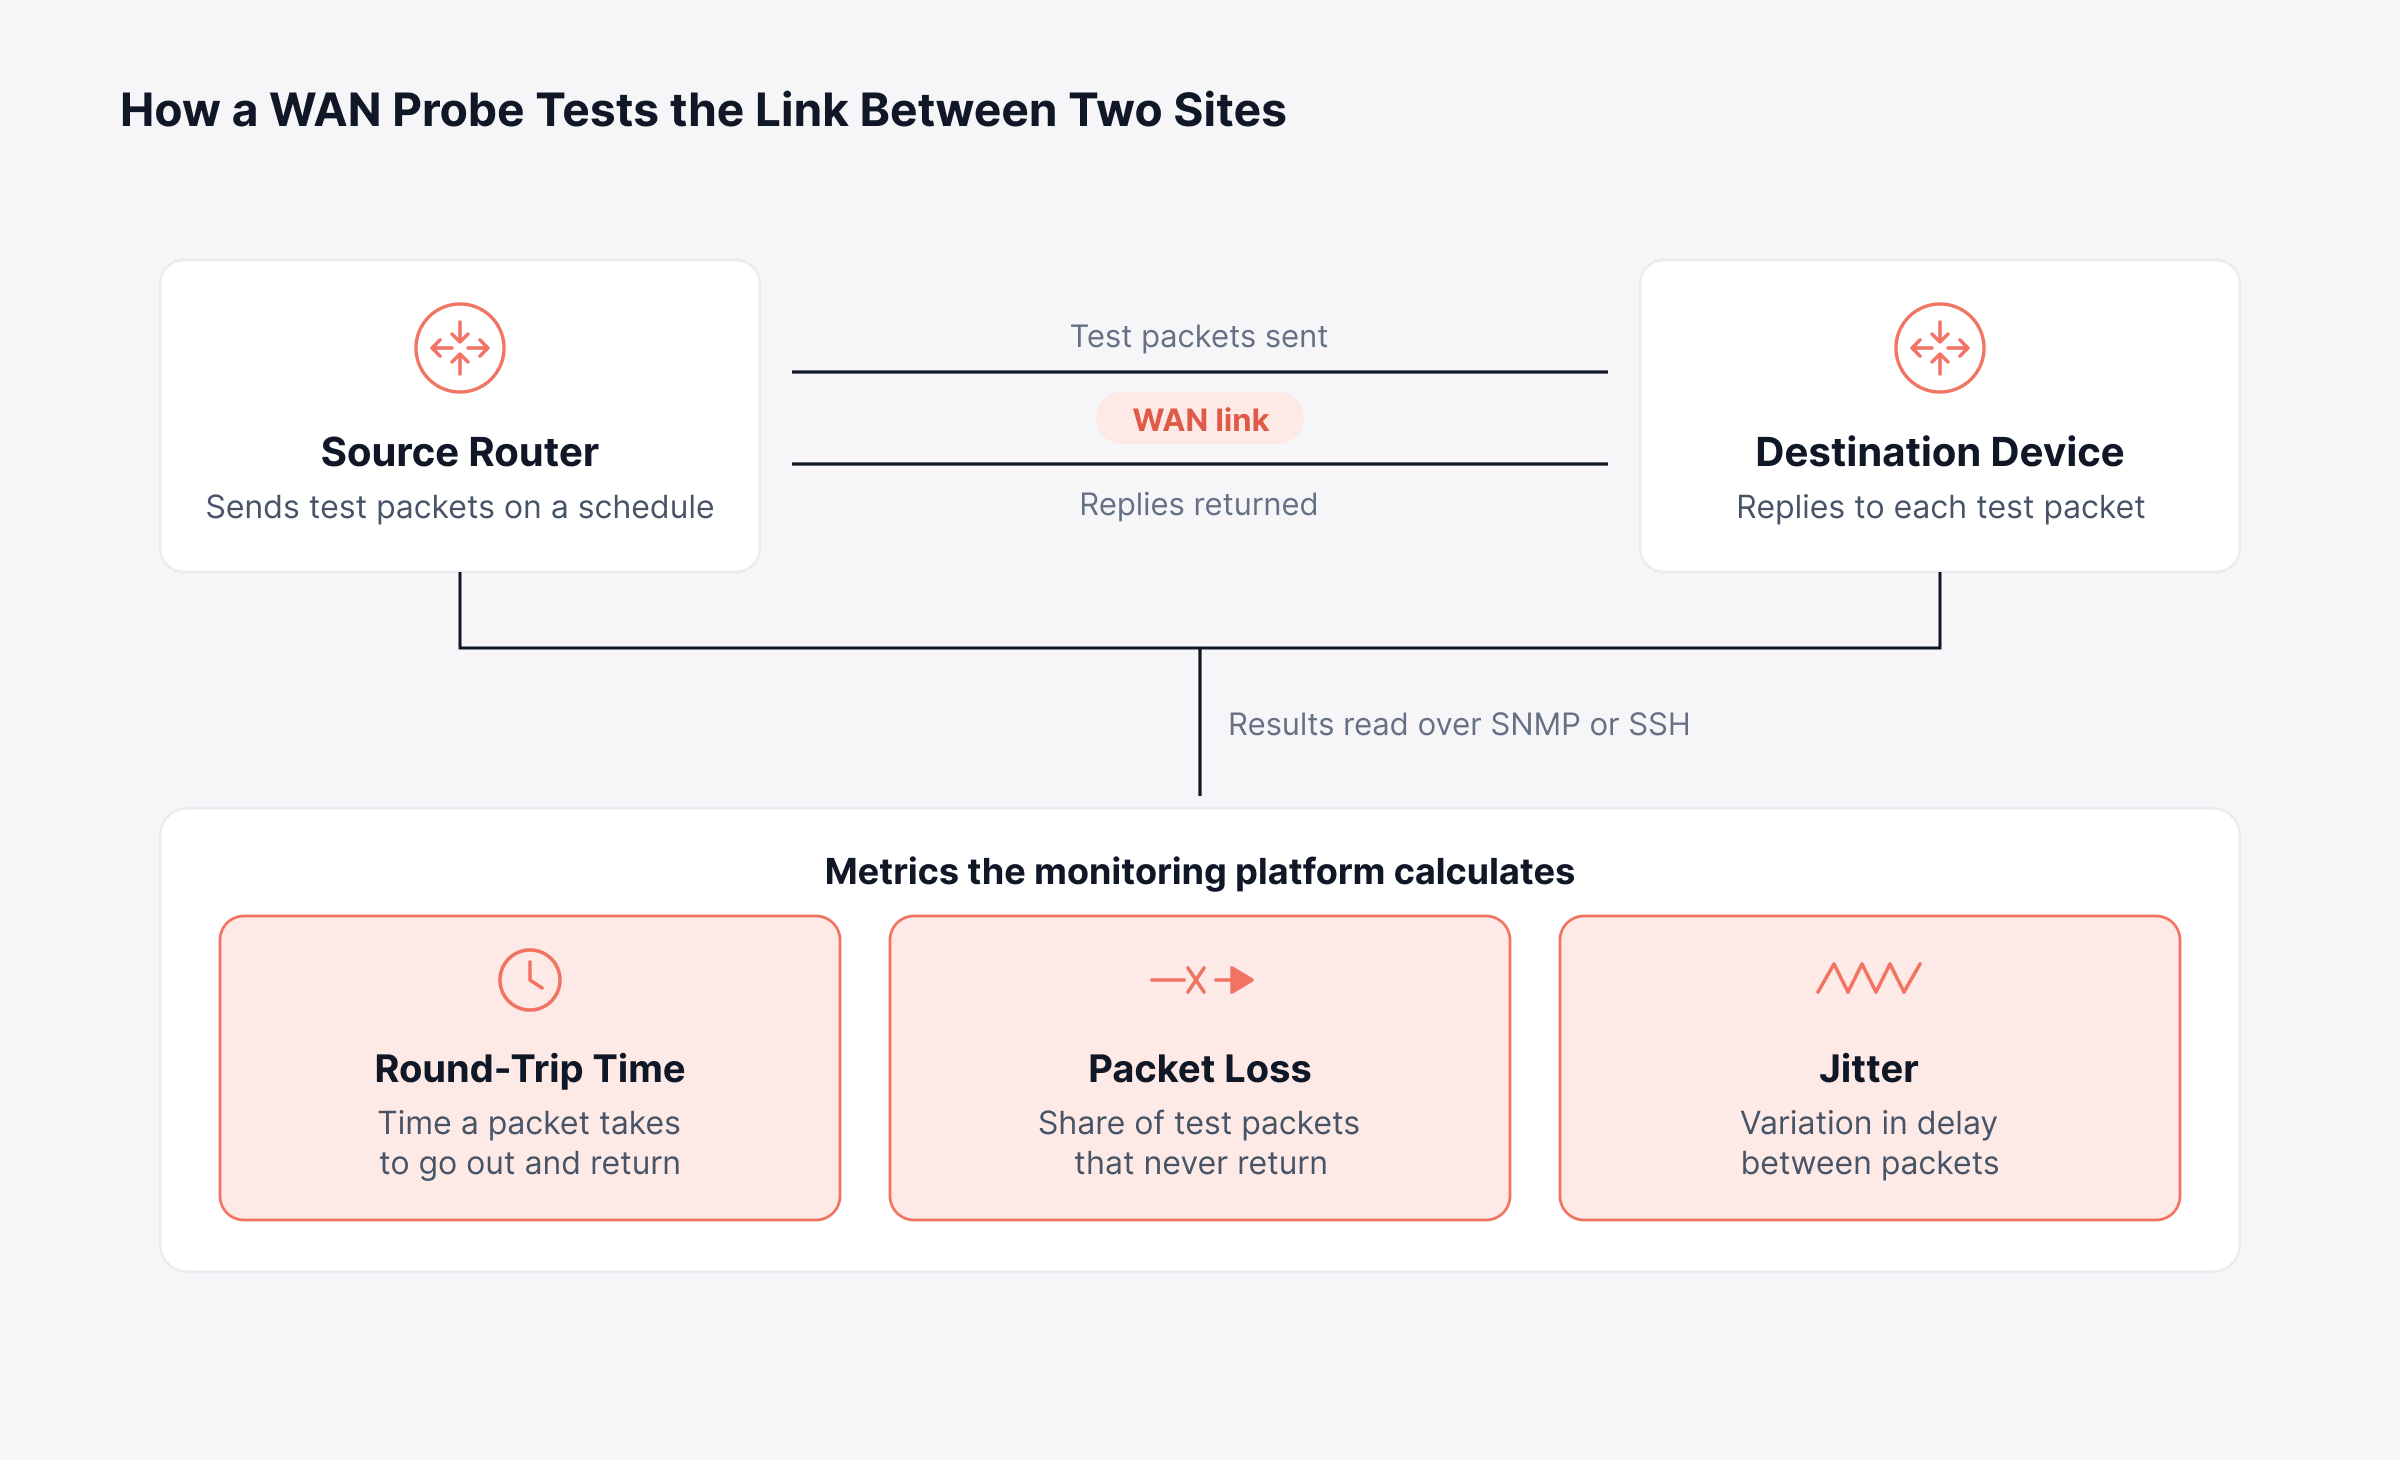
WAN link probes work by sending small test packets from a router to a known destination at set intervals and logging how long each reply takes. Missing replies are counted too. Since the router creates this synthetic traffic itself, measurement carries on overnight and before a branch opens, with no users online.
Cisco: The probe engine is called IP SLA, so collecting its results is usually described as IP SLA monitoring
Juniper: The equivalent is RPM, short for Real-time Performance Monitoring
From there, a WAN link monitoring tool pulls the results off the router and builds trends and alerts from them. Most tools read the data over SNMP, the standard protocol for querying network devices. Some also log in over SSH, a secure command-line connection, to run and read the probes.
Three of the five metrics come directly from one timed back-and-forth between two devices. The flow below traces one exchange from the source router to the numbers worth alerting on.
Most WAN links need only three probe types. Each tells you something different about the circuit.
ICMP Echo Probes
An ICMP echo probe behaves like a ping on a timer. Round-trip time and reachability are what it reports, and any device that replies to ping can be its target. That simplicity makes it the default WAN RTT monitor for most links.
UDP Echo Probes
With a UDP echo probe, the router sends UDP packets instead and times their return. Many networks treat UDP differently from ICMP, so this probe gives a closer view of how application traffic is handled. The far end usually needs a responder, a small service on the destination that returns the test packets.
UDP Jitter Probes
A UDP jitter probe goes a step further. It fires a timed stream of packets and checks how evenly they arrive, then works out jitter, packet loss and latency from that one stream. Links carrying voice and video usually get this probe, and it also needs a responder at the far end.
Picking a probe starts with the business question behind it. The table below maps each probe to that question.
Probe | What it measures | Business question it answers | Far-end requirement |
ICMP Echo | Reachability and round-trip time | Is the branch connected, and how responsive is the link? | Any device that answers ping |
UDP Echo | Round-trip time for UDP traffic | Is the carrier handling application traffic as promised? | Responder or echo service |
UDP Jitter | Jitter, packet loss and latency | Will calls and video meetings stay clear? | Responder on the destination |
Knowing the probe types is the straightforward part. Applying them consistently across mixed hardware takes more planning.
What Makes WAN Link Monitoring Hard in Multi-Vendor Networks?
WAN link monitoring gets harder in multi-vendor networks because each operating system runs its own probe engine, with its own probe names, options and access rules. A setup that works on one router family may not carry over to the next. These gaps usually show up in a few places:
Different probe engines: Cisco devices use IP SLA, while Juniper devices use RPM, and the two expose results in different ways
Uneven OS support: Cisco IOS-XE, IOS-XR and NX-OS are separate operating systems, and WAN link monitoring software often supports only some of them
Access requirements: SNMP collection of IP SLA results needs write access to start tests, while SSH collection needs device login credentials
Missing context: A single router can carry links from two or three carriers, and raw probe data rarely says which is which
There is also the question of the root cause. A probe can show loss without explaining it, and the source is often physical, such as a failing cable or optic that throws CRC errors on the interface.
This is where observability goes further than monitoring. It adds context by correlating probe results with three other data sources:
Interface counters: Errors and discards on the router port that carries the link
Path data: Which hop along the route adds the delay or drops the packets
Flow data: Which applications and users consume the link's capacity
Example: Say a branch MPLS link shows steady packet loss on its probes for two days. A look at the interface counters on that router port turns up CRC errors climbing in step with the loss. The likely cause is a failing optic at the branch, so a technician replaces it in one visit and nobody spends days chasing the carrier.
SD-WAN adds a separate complication. An overlay tunnel may look healthy while the circuit underneath is getting worse. That is why the carrier links below an SD-WAN still need probes of their own.
What are the Best Practices for WAN Link Monitoring?
WAN link monitoring pays off when each link has an owner, a known normal range and a probe suited to its traffic. Below are five practices that tackle the problems covered above, so the data stays useful in the middle of an incident.
1. Match the Probe Type to the Traffic Each Link Carries
Start from what the business actually sends over each link.
Run ICMP echo on every link for uptime and RTT
Add UDP jitter on links that carry voice, video or contact center traffic
2. Label Every WAN Link by Carrier and Site
A probe result without context is hard to act on.
Record the carrier name and both site locations for each link
Use the carrier label in monthly reports to compare providers before contract renewals
3. Baseline Each Link Before Setting Alerts
Latency that is normal on a satellite link would signal a serious fault on metro fiber.
Collect a few weeks of data, including busy periods, before setting thresholds
Alert on sustained deviation from each link's own baseline
4. Send Probes from the Correct Source Interface
On a router with several uplinks, probes can leave through the wrong one unless told otherwise.
Set the source interface explicitly for each probe
Trace the full route when results look wrong, using path visibility to see which hop adds the delay
5. Plan Alerting Around Carrier Maintenance Windows
Planned carrier work tends to trigger a burst of alerts nobody needs to chase.
Pause alerts on the affected links for the maintenance window with alert suppression (/blog/alert-suppression)
Review probe results after the window closes to confirm full recovery
All five are easier to apply with a single platform that supports each router family you run.
How does Motadata Monitor WAN Links Across Cisco and Juniper?
Motadata ObserveOps monitors WAN links by running probes on supported Cisco and Juniper devices and collecting the results around the clock. Cisco NX-OS is the newest addition to its WAN link discovery. Alerts come straight from the probe data, so WAN link performance monitoring lives in the same platform you use for the rest of your network observability.
For SSH-based WAN link discovery, ObserveOps supports four operating systems and runs ICMP Echo, UDP Echo and UDP Jitter probes on them:
Cisco IOS-XE
Cisco IOS-XR
Cisco NX-OS
Juniper RPM
The NX-OS addition extends Cisco NX-OS monitoring to the Nexus switches that many data centers use to connect sites. It shipped alongside per-interface CRC and FCS error counters and new topology controls for connection width and bold node labels, and the ObserveOps release notes list every change in that update.
For Cisco devices with IP SLA, ObserveOps also collects WAN link data over SNMP. On that path you can run ICMP Echo, ICMP Jitter and ICMP Path Echo, and Path Echo adds response time for each hop on top of the end-to-end figure.
Your choice of collection path decides which devices you can cover and which probes you can run. Both paths, and the place they converge, are laid out below.
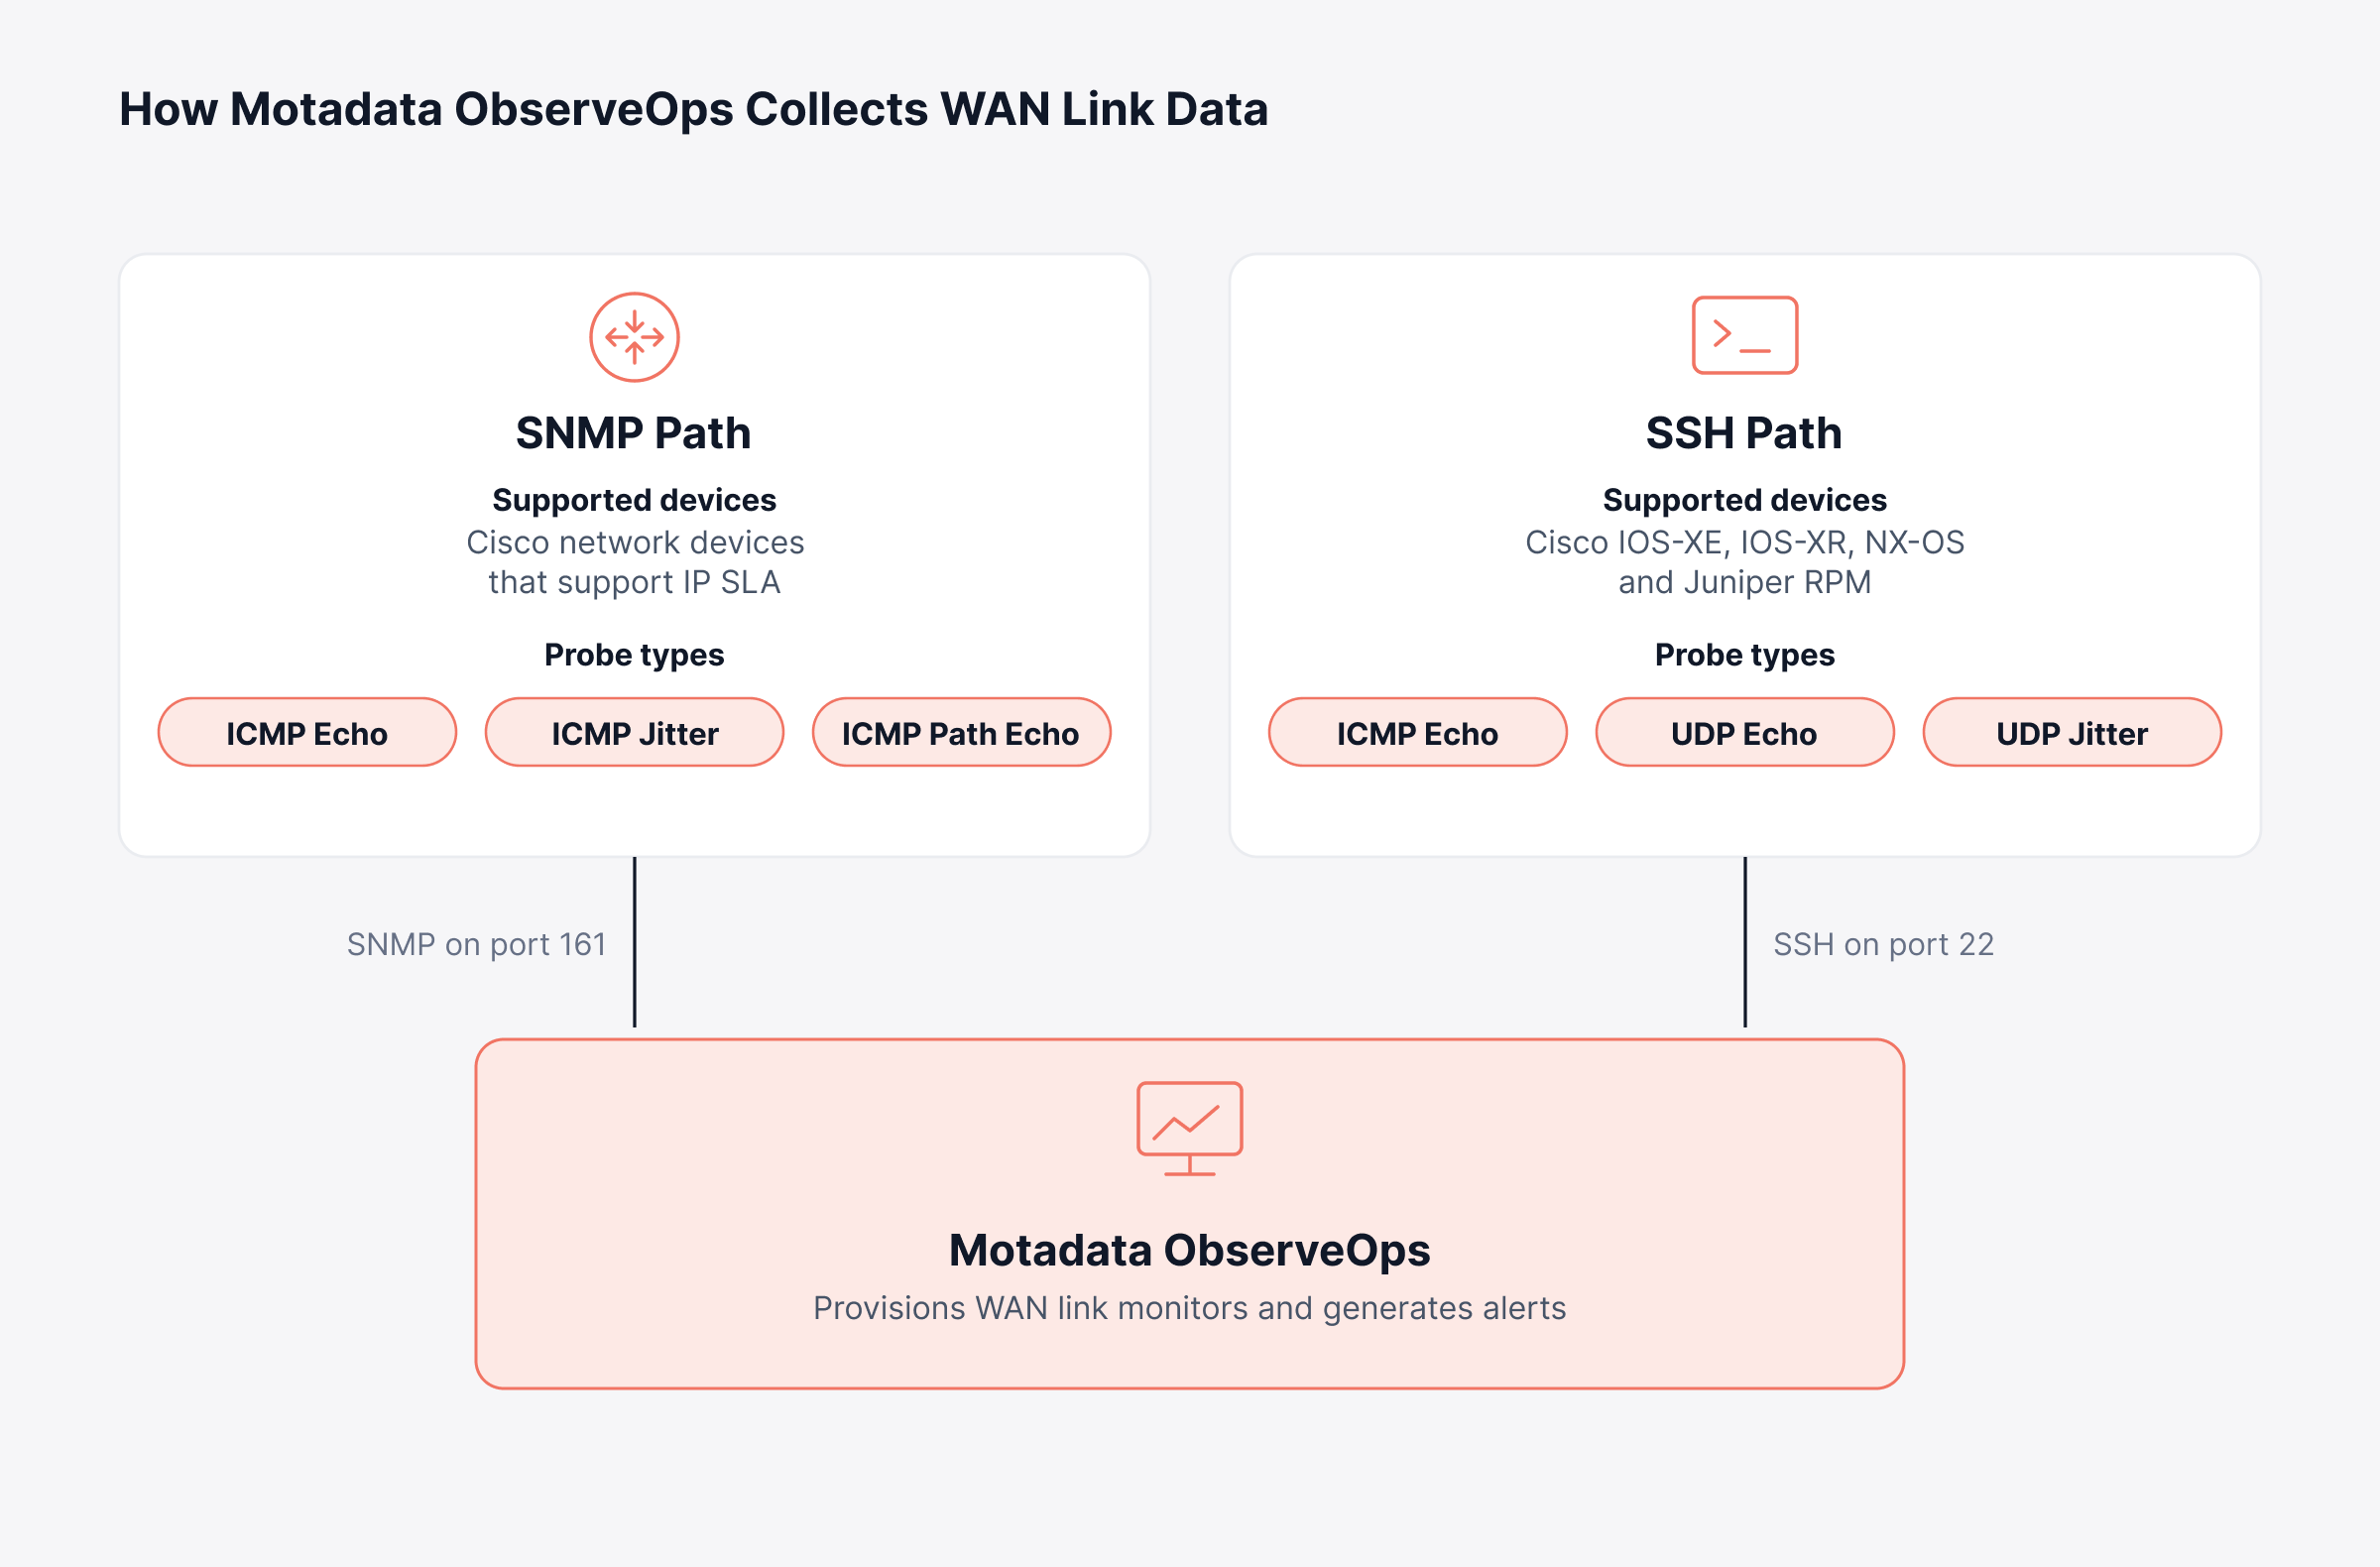
With both paths available, one platform can take IP SLA devices over SNMP and a mix of Cisco and Juniper systems over SSH. Setup follows the same short sequence either way.
How do you Set Up WAN Link Monitoring in Motadata?
Setting up WAN link monitoring in ObserveOps takes four steps, starting from a network device that is already monitored. The full WAN link guide covers every field.
Create a credential profile: Use SNMP with read and write community strings, or SSH with a username and password or an SSH key
Open the network monitor: Select the WAN Link button on the device and choose SNMP or SSH as the protocol, with bulk configuration available for SNMP links
Describe the link: Pick the probe type and destination IP, and for SNMP links add the carrier name, source interface and site locations
Provision the results: Run discovery and add the links you want as monitors
Check two prerequisites before you start. SNMP links need port 161 open and a write community string filled in, because IP SLA uses it to launch tests. SSH links need port 22 reachable from the ObserveOps server.
Once provisioned, links appear in their own WAN Link monitor view. To track more from the same devices, look at IP SLA monitoring and the Cisco router integration.
Move From Up-or-Down Link Checks to WAN Observability with Motadata ObserveOps
Basic WAN monitoring tools can tell you a circuit is answering. Why a branch feels slow, or which carrier is at fault, usually stays unclear. Probes supply that evidence, though they measure test traffic only, so pair them with flow data to see what users actually send.
With Motadata ObserveOps, network and IT leaders get measured latency, loss and jitter for WAN links on Cisco IOS-XE, IOS-XR, NX-OS and Juniper RPM devices. That history shortens branch troubleshooting. It also gives you the facts to hold each carrier to the service level you pay for.
FAQs
What is a WAN link?
A WAN link is the connection that joins two sites across a wide area network, such as a branch to a data center. It can run over MPLS, broadband, leased lines, LTE or satellite. Most organizations rent these links from carriers under a service level agreement.
Should I ignore ping from WAN?
Many routers block inbound ping on internet-facing interfaces to reduce exposure to scans, and that is a sensible default. If you monitor links with ICMP probes, allow echo requests from your monitoring sources and probe targets. Otherwise the link will appear down when it is working.
What is the difference between WAN monitoring and WAN link monitoring?
WAN monitoring covers the whole wide area network, including routers, traffic flows and bandwidth use. WAN link monitoring focuses on the quality of each individual circuit, measuring latency, loss and jitter between two points. Platforms such as Motadata ObserveOps cover both from one console.
Do UDP jitter probes need anything on the destination device?
Yes, UDP jitter probes need a responder enabled on the destination, because the far end must timestamp and return the test stream. On Cisco devices, this is the IP SLA responder, and Juniper devices use an RPM server. ICMP echo probes have no such requirement.
Can Motadata monitor WAN links on Cisco NX-OS?
Yes, Motadata ObserveOps supports Cisco NX-OS for WAN link discovery alongside Cisco IOS-XE, Cisco IOS-XR and Juniper RPM. It runs ICMP Echo, UDP Echo and UDP Jitter probes over SSH. Results appear as WAN link monitors with alerts.
Author
Poonam Lalani
Content Strategist
Poonam Lalani is a B2B content strategist and writer with a background in computer engineering and experience across enterprise technology domains, including AI, cloud, DevOps, data engineering, and IT operations. She specializes in creating research-driven content that simplifies complex ideas and supports product education, thought leadership, and business growth.