IoT Monitoring: Challenges, Key Metrics and Tools for Reliable Connected Operations
How do you find out that a temperature sensor in a cold room has stopped reporting before the stock inside it spoils? In plenty of companies, you don't. The battery dies over a weekend, the sensor goes quiet without an error, and the first sign is spoiled stock.
Most IoT fleets grow by accident. The press line gets vibration sensors one year. Facilities adds smart meters the next, security adds cameras on the loading dock, and every project brings its own gateway and login.
IoT monitoring puts all of that into one view. In this blog, you will see how it works, where rollouts tend to stall, and which metrics, thresholds and tools to start with. It's the hands-on follow-up to our piece on IoT network monitoring.
What is IoT Monitoring?
IoT monitoring keeps watch over connected devices, their gateways and the network in between (IoT stands for Internet of Things). It's what catches the pump sensor that dropped off an hour ago, or the meter stuck on one number.
Ask a plant manager what they want from it and the answer is usually blunt: "tell me if line 3 stops sending data." Getting there means watching four areas:
Device health: Is the battery low, is it running hot, is the firmware current?
Connectivity: Signal, packet loss, latency and link drops
Gateways and edge nodes: CPU, memory, storage, forwarding services
Data quality: On time, in range, plausible
In practice, almost any Internet of Things endpoint on an enterprise network counts. Industrial sensors, smart meters, IP cameras, badge readers and building controllers all qualify, along with the gateways in front of them.
What are the Four Types of IoT?
The four types of IoT are consumer, commercial, industrial and infrastructure. The difference that matters for monitoring is who gets hurt when a device fails:
Consumer IoT: Wearables and smart speakers; the vendor usually watches these
Commercial IoT: Office HVAC, footfall counters in stores, clinic equipment
Industrial IoT: A vibration sensor on a press, a pressure gauge on a pipeline
Infrastructure IoT: Smart meters, traffic signals and substations spread over a region
Enterprise IT owns most of the last three. That's where a silent device stops a line, spoils stock or holds up a bill.
How is IoT Monitoring Different from IoT Observability?
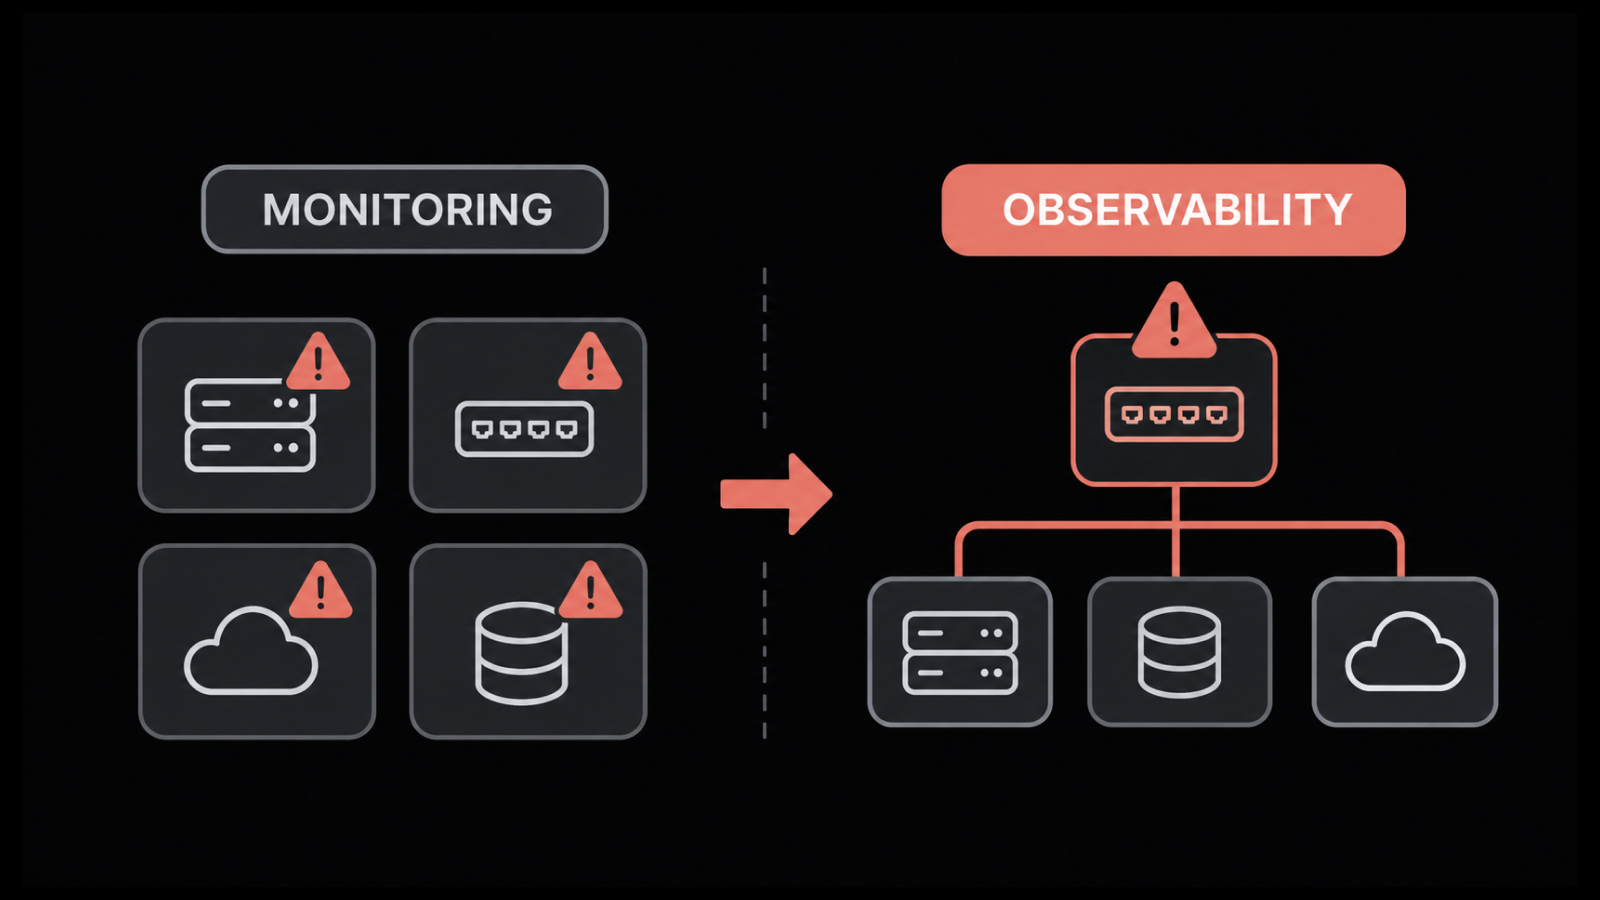
Monitoring answers the questions you planned for ("is it up?"). Observability is how you handle the rest; with device, network and application data in one place, odd failures can still be traced.
Different people need different answers. The plant manager just wants "sensor 14 stopped reporting." The engineer wants the chain behind it (gateway lost power, switch logged the drop), and full-stack observability gives both from the same data.
What is IoT Remote Monitoring?
IoT remote monitoring means watching devices at sites with nobody from IT on hand. Substations, pump houses, retail stores and cell towers are typical, all watched from one central platform, much like remote monitoring for branch offices. They check in over cellular, wired WAN or, in remote areas, satellite.
Satellite IoT for remote monitoring is the same, just slower. A desert pipeline gateway may report four times an hour; set alert windows to match.
How Does an IoT Monitoring System Work?
An IoT monitoring system works in four layers, all feeding one platform. Each value is checked against a limit and against the device's usual range.
Here is what each layer contributes:
Device layer: Readings plus basic health, such as battery and uptime
Gateway and edge layer: Protocol translation, buffering during outages, filtering
Network layer: The switches, access points and WAN links in between; any of them can drop data
Monitoring platform: Data, rules and the alert itself
This is the part that surprises most new IoT owners. A fault low in the chain hides everything above it, as the diagram below shows with one offline gateway and three healthy sensors.
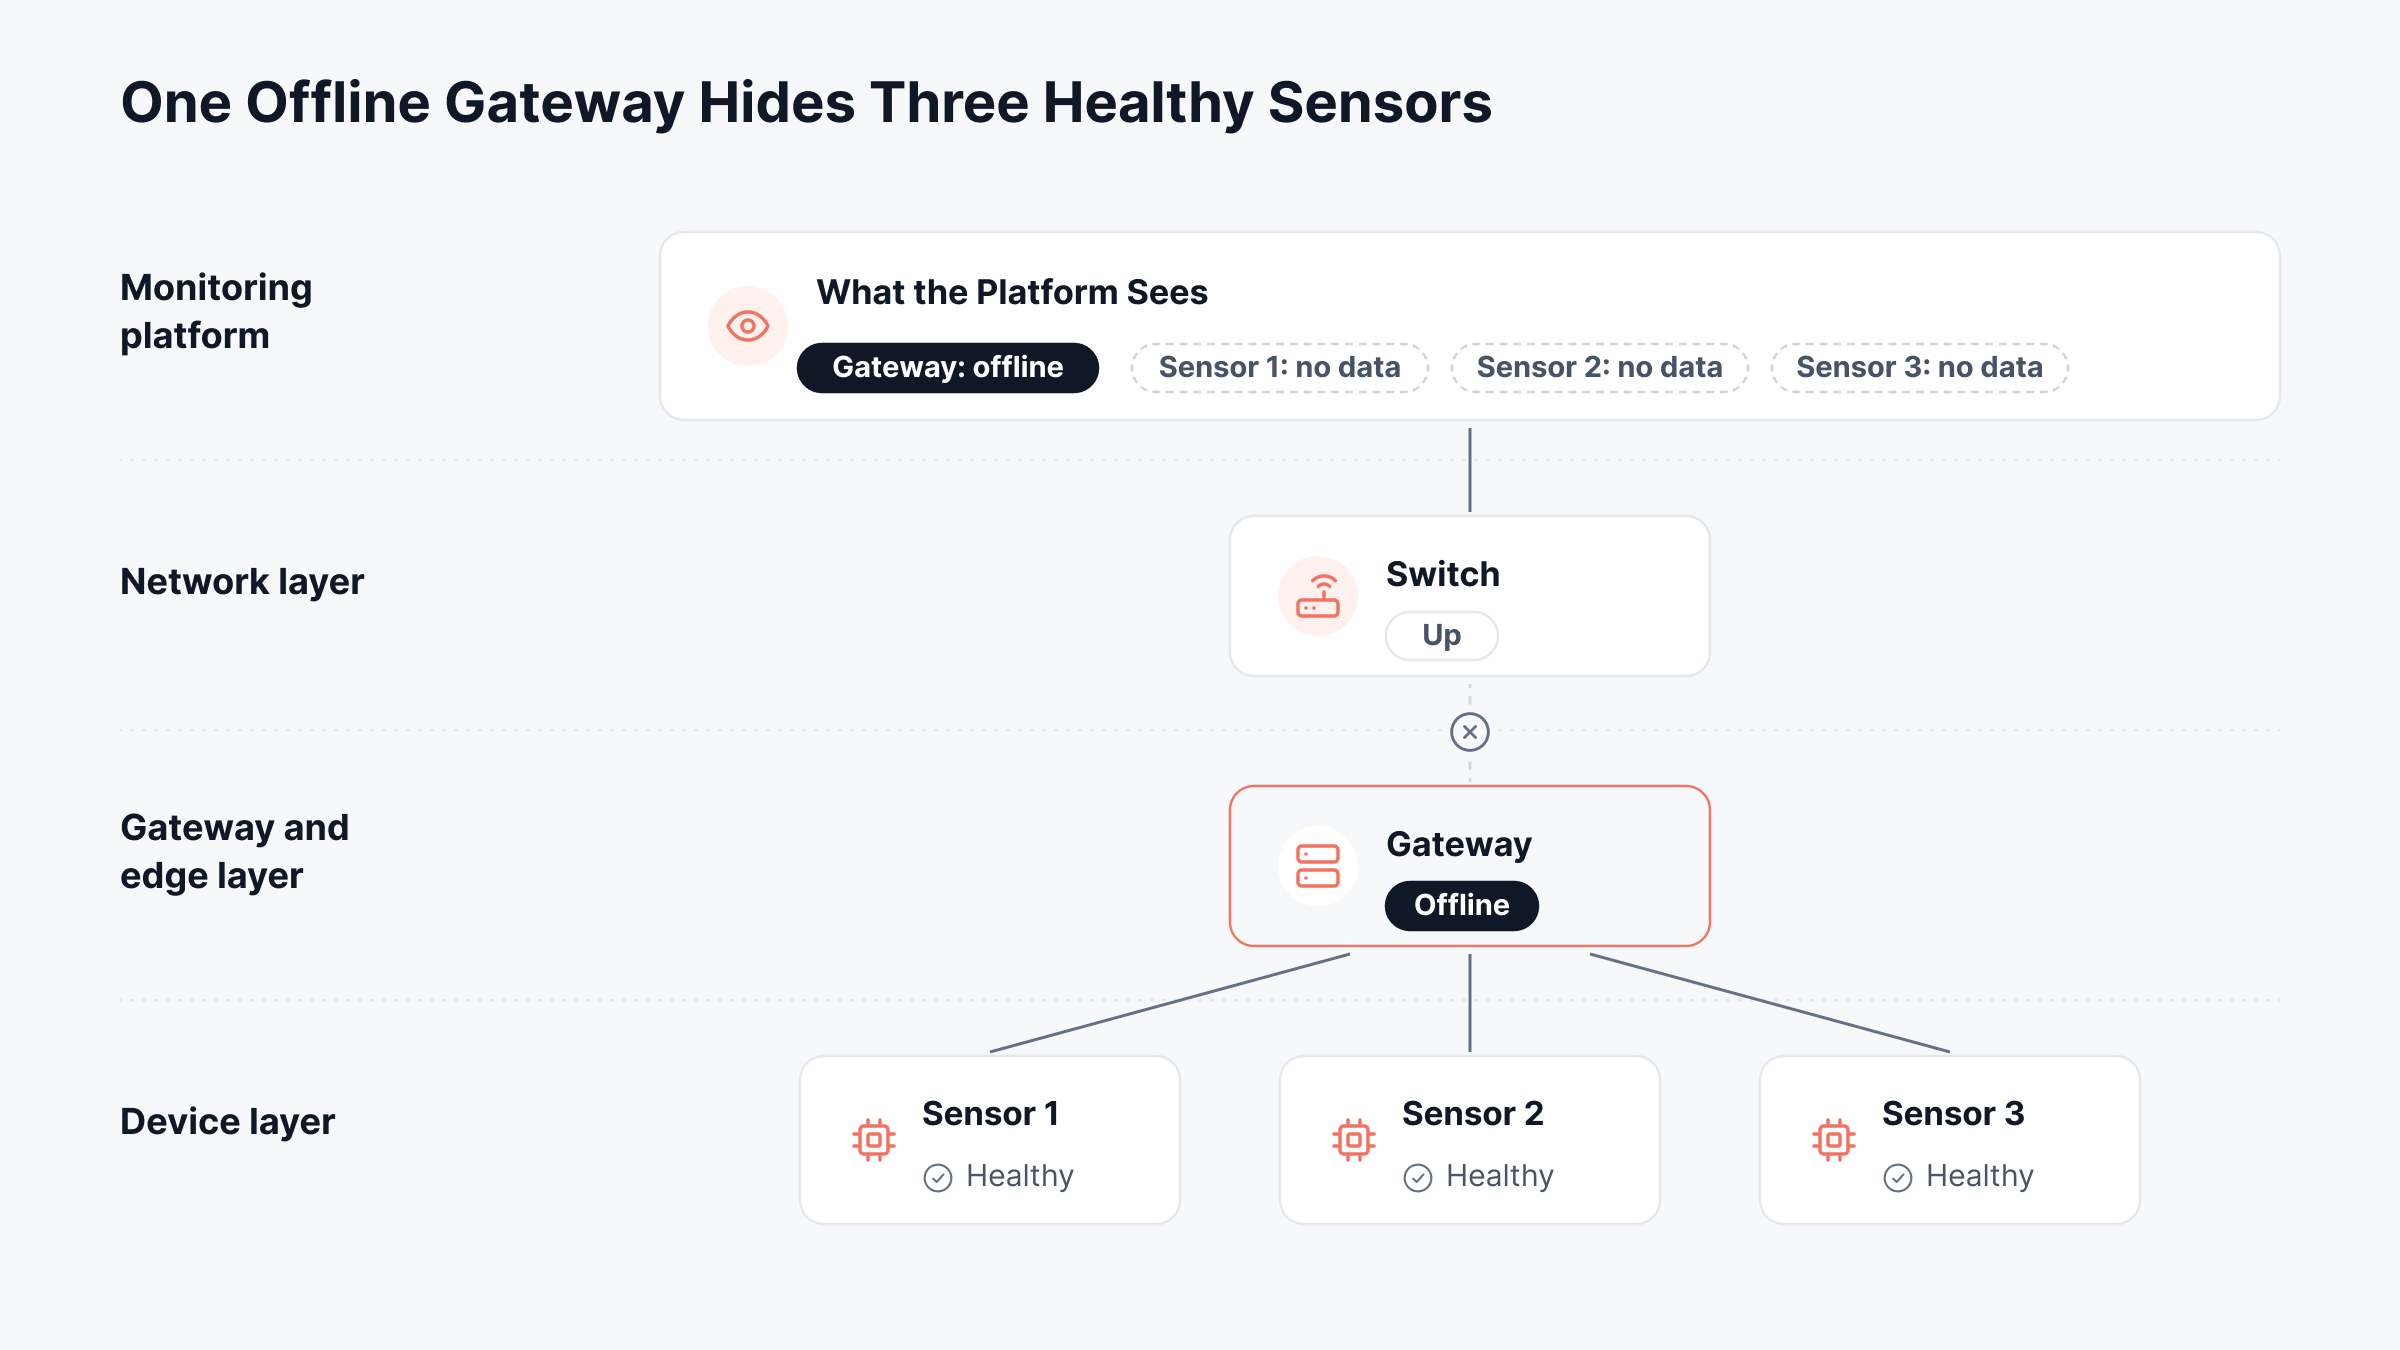
So the platform needs to know which sensor hangs off which gateway.
Which Protocols Do IoT Monitoring Tools Use?
Most IoT monitoring tools speak a few common protocols. Switches get polled, sensors push data, and some cloud hubs only offer an API.
Protocol | How data arrives | Best fit | Watch for |
SNMP polling | Platform asks for values on a schedule | Gateways, switches, UPS units, industrial routers | Polling load on big fleets |
SNMP traps | Device sends an event on change | Link down, power events, hardware faults | New vendors' trap formats |
MQTT | Devices publish to a broker | Battery sensors, chatty fleets | The broker itself going down |
HTTP or REST API | Platform calls an endpoint | Cloud gateways, vendor hubs | Rate limits, API changes |
LwM2M | Device management standard on CoAP, a lightweight web protocol | Low-power cellular devices | Needs a compatible server |
Syslog | Devices stream log lines | Gateways, firewalls, Linux edge boxes | Every vendor's format differs |
SNMP does most of the infrastructure work. We rarely see a gateway, switch or UPS without it, and SNMP traps cover the events between polls. The sensor readings themselves mostly come over MQTT or a vendor's API.
There's a cost angle. One platform that understands several protocols is cheaper to license and staff than a tool per protocol.
How Does IoT Monitoring with Edge Processing Work?
IoT monitoring with edge processing does part of the work on the gateway. Raw readings stay local; summaries and exceptions go upstream, which saves WAN bandwidth and keeps safety logic running offline.
Our rule of thumb for what runs where:
Keep at the edge: Safety interlocks, anything that must react within seconds, buffering
Send to the central platform: Device health, link quality, trends across sites, anything needing server or app context
Send both: Exceptions; the edge acts, the platform keeps the record
Why Does IoT Device Monitoring Matter for the Business?
IoT device monitoring matters because devices now drive production, safety, stock and billing decisions. One quiet meter can skew a week of reports. And IDC expected IoT spending in Asia Pacific alone to hit $241 billion in 2025, up 12.5% on the year before.
Four outcomes usually justify the spend:
Fewer unplanned stops: A failing motor shows up in vibration trends days before it trips
Fewer wasted site visits: If a reboot fixes it, nobody drives out
Trustworthy data: A meter stuck on one value gets caught before billing
Lower security exposure: Unknown devices and old firmware show up early
Take a water utility with pumping stations across a region, each behind a cellular gateway. Without remote checks, every "no data" report means a long drive for a technician, often just to restart a gateway. With remote network monitoring on the gateway, its link and its power supply, the dispatcher knows which stations need a visit and which need a remote fix.
What are the Biggest IoT Monitoring Challenges?
IoT monitoring challenges mostly come down to scale, patchy links and device variety. Here are the six we run into most often in enterprise rollouts.
1. IoT Devices That Fail Silently
A dead sensor sends nothing, so threshold alerts have nothing to fire on. The usual fix is a missed-report rule, or heartbeat check: alert when a device misses a set number of expected reports.
Silence needs its own alert. The timeline below marks when it fires for a sensor reporting every 15 minutes.
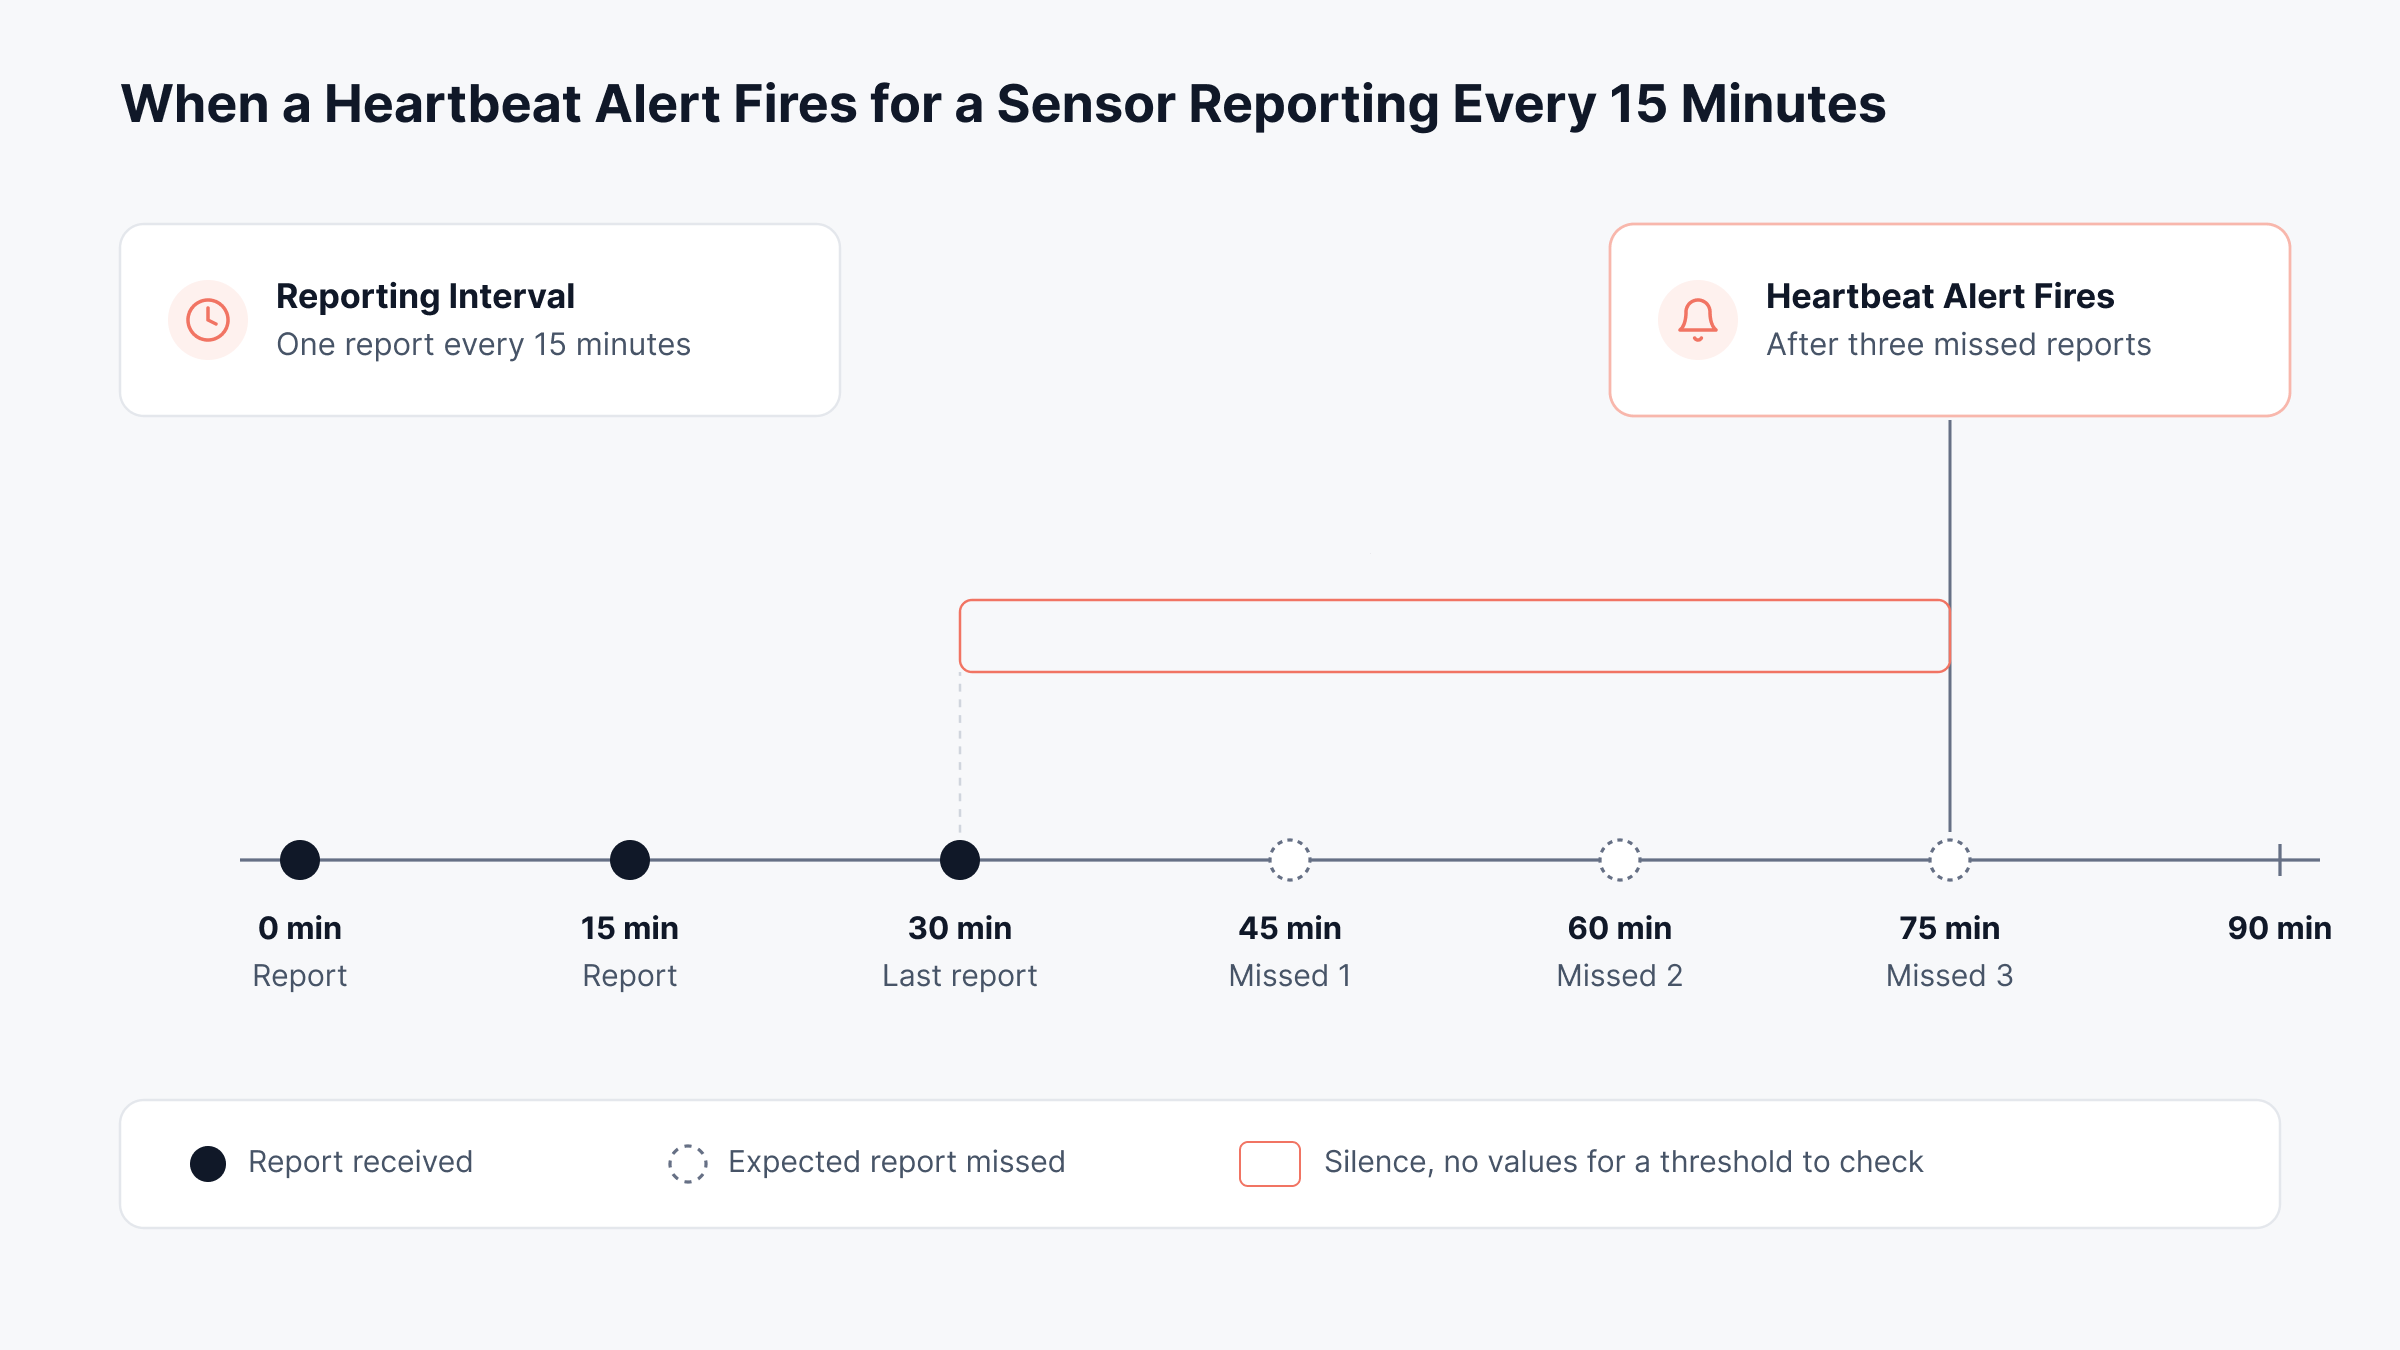
Three missed reports means 45 minutes of silence. That's late enough to ignore one dropped message and early enough to save the stock.
2. Intermittent Cellular and Wireless Links
Cellular and wireless links drop and come back all day; engineers call it flapping. Alert on every drop and the console is full within the hour. Alert on none and a site can be offline for half a shift unnoticed, so count the drops over a window and alert on the pattern.
3. Rising Polling Costs at Fleet Scale
Polling frequency multiplies fast, and so does the bill for storing and moving the data. Take 5,000 devices with 20 metrics each. That's 100,000 values on every poll.
A shorter polling interval costs more than it looks. The chart below works through the storage and network math for one fleet.
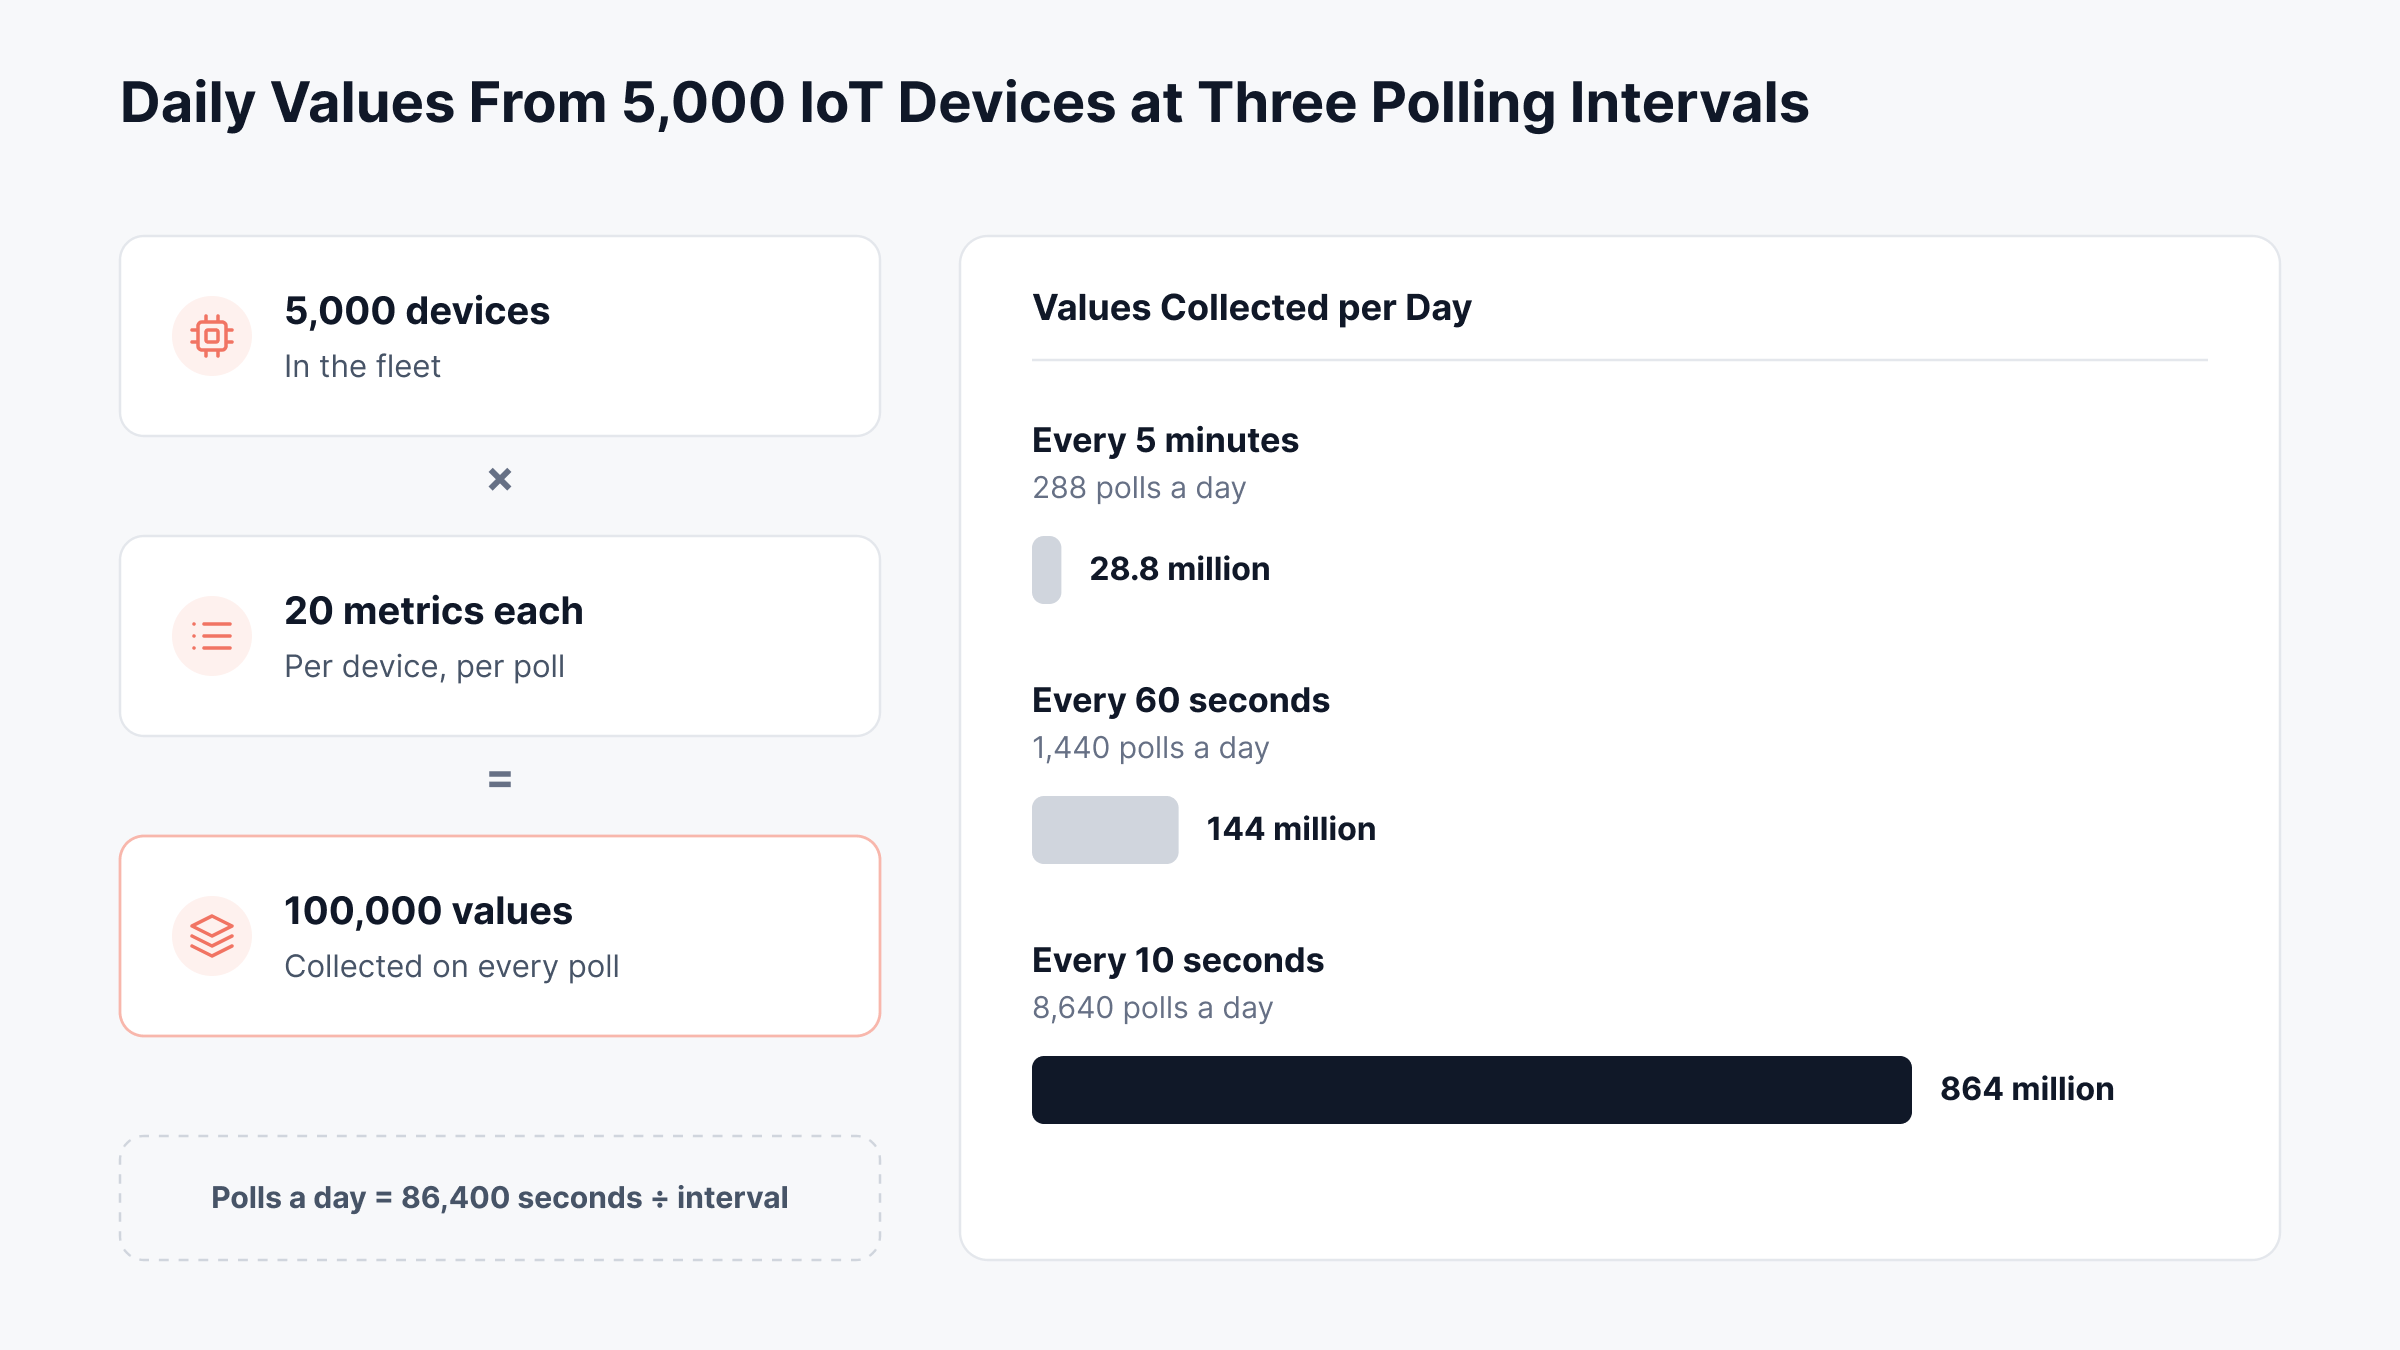
That's 144 million values a day at 60-second polling and 864 million at 10 seconds. We'd poll gateways and switches often and leave battery sensors on their own schedule.
4. Protocol and Vendor Sprawl Across Device Types
Every vendor ships its own MIBs (the files describing what an SNMP device reports), trap formats and APIs. If adding a model takes weeks, coverage lags every rollout.
5. Security Blind Spots in Connected Devices
Many devices still run their factory password on years-old firmware. NIST's IoT device baseline puts cybersecurity state awareness on its list of core capabilities; a device should report enough to reveal a compromise.
Two habits go a long way: SNMPv3 with authentication and encryption wherever a device supports it, and separate network segments for IoT devices, in line with zero trust principles.
6. Alert Storms from a Single Gateway Failure
A failed gateway can trigger hundreds of "device unreachable" alerts at once. Dependency mapping points them back to the one cause, which speeds up root cause analysis and makes alert noise reduction possible at IoT scale.
What Key Metrics Should You Track When Monitoring IoT Devices?
The key metrics for monitoring IoT devices fall into five groups. We'd pick three or four from each: device health, connectivity, gateway health, data quality and security. Depth in one group can't make up for a blind spot in another.
IoT Device Health Metrics
Last seen: Time since the device last reported, often the most useful IoT metric of all
Battery level: Remaining charge, plus how fast it is draining compared with similar devices
Unplanned reboots: Restarts outside maintenance windows
Internal temperature: Readings against the vendor's rated operating range
Firmware version: Whether the device matches your approved baseline
IoT Connectivity Metrics
Signal strength: RSSI or RSRP, by link type
Packet loss: Lost packets between the gateway and the platform
Latency: Round-trip time compared with that site's own baseline
Link drops: How many times the connection went down in a set window
IoT Gateway and Edge Metrics
CPU and memory: Sustained load on what is often a small Linux box
Storage: Free space for the local buffer that holds data during outages
Forwarding services: Whether the broker, agent or forwarder process is running
Power: UPS status and battery runtime for gateway cabinets at remote sites
IoT Data Quality Metrics
Delivery rate: Messages received as a share of messages expected
Stuck values: The same reading repeated for longer than the process allows
Out-of-range readings: Minus 5% humidity, say
Ingestion lag: Delay between the device timestamp and arrival at the platform
IoT Security Metrics
New or unknown devices: Addresses that appear on IoT segments without a matching record
Failed logins: Repeated authentication failures on gateways and device consoles
Unexpected traffic: A camera calling an address it has never used before
Thresholds depend on the device and the process. We treat the values below as opening numbers and tune them after two weeks of your own data.
Metric | Common starting alert | Why this level |
Last seen | Three missed reporting intervals | Allows for one or two dropped messages |
Battery level | Warn at 20%, critical at 10% | Time to book a visit |
Wi-Fi signal (RSSI) | Weaker than -70 dBm | Transfers start failing |
Cellular signal (RSRP) | Weaker than -100 dBm | Poor coverage, usually |
Packet loss | Over 1% for 10 minutes | Retries delay readings |
Gateway CPU or memory | Over 85% for 10 minutes | Long plateaus matter; spikes pass |
Delivery rate | Under 98% of expected messages | Reports start to skew |
Unplanned reboots | More than two in 24 hours | Usually power, firmware or heat |
Which IoT Monitoring KPIs Should IT Leaders Report?
Engineers need device metrics. Leaders need a handful of fleet numbers that show whether monitoring is paying off, and four cover a monthly review:
Fleet reporting rate: Share of devices that reported in the last expected interval
Time to detect a silent device: How long a dead sensor goes unnoticed, the IoT form of MTTD
Remote resolution rate: Share of device issues fixed without a site visit
Data completeness: Readings that reached reports and billing, as a share of expected
One monitoring dashboard per region keeps site managers and IT looking at the same numbers.
How Do You Set Up IoT Monitoring Step by Step?
You set up IoT monitoring by building the inventory first. Collection, baselines, alert rules and response steps follow, in that order; skip the inventory and coverage stays patchy.
We follow seven steps:
Build the inventory: Use network discovery to find every device, gateway and network hop, then tag each by site, owner and business process
Pick a collection method per device class: SNMP for infrastructure, traps for events, APIs or MQTT for sensor data
Set heartbeat rules: Alert on silence for every device class, with intervals that match how often each one reports
Map dependencies: Record which sensors report through which gateway, and which switch or WAN link each gateway uses
Baseline before you alert: Collect a week or two of data, then set thresholds against what normal looks like
Connect alerts to tickets: Route critical alerts into incident resolution workflows, with the site and device named on each ticket
Review monthly: Noisy rules out, new device types in, retention and firmware checked against policy
Where Does IoT Environmental Monitoring Fit in a Rollout?
IoT environmental monitoring watches temperature, humidity, leaks and power in rooms full of sensitive stock or equipment. Server rooms, cold storage, pharmacies and branch network closets are where we see it most.
Take a regional food distributor with cold rooms at twelve depots, each with wireless temperature sensors, a gateway and a small UPS in the gateway cabinet. Good coverage there means four alerts:
Temperature excursion: A cold room reading outside the safe range
Silent sensor: A sensor that misses its expected reports
Gateway offline: The gateway stops answering polls
Power event: The cabinet UPS switches to battery
In practice, the last two explain the first two more often than the cold room itself does.
What Should You Look for in IoT Monitoring Software?
The right IoT monitoring software depends on which layer you need covered. No category does devices, connectivity and infrastructure equally well; IoT monitoring solutions fall into four groups, and most enterprises end up combining two.
Category | What it covers well | Where it stops |
Device management platforms | Provisioning, settings, over-the-air firmware | Network paths, servers, downstream apps |
Connectivity management platforms | SIM status, cellular usage, carrier diagnostics | Device health, wired infrastructure |
Infrastructure observability platforms | Gateways, switches, wireless, WAN, servers, alerting, root cause | Sensor provisioning, firmware pushes |
Cloud IoT services | Ingesting and analyzing device data | On-premises networks, mixed-vendor hardware |
When you shortlist IoT monitoring platforms, we'd put these questions to every vendor:
New device types: How long until a model you've never seen is fully monitored?
Silence detection: Will it alert when a device stops reporting, as well as on thresholds?
Dependency mapping: Does one gateway failure produce one alert or hundreds?
Remote sites: Can collection run locally at each site and keep working when the WAN link fails?
Service desk link: Do critical alerts open tickets with the device and site details already attached?
Deployment options: Is on-premises deployment available for plants that keep data inside the network?
For most enterprises, the best IoT monitoring platform covers the infrastructure layer fully and takes sensor data from whatever device platform is already there.
How Does Motadata ObserveOps Bring Observability to IoT Infrastructure?
Motadata ObserveOps brings observability to the infrastructure an IoT deployment depends on, including gateways, switches, wireless, WAN links, UPS units and servers, and lets you add new device types yourself. We built it so the devices behind a gateway and the network in front of it show up in one place, with metrics, traps and logs side by side.
1. Bring Unknown Devices into View with the SNMP Device Catalog
During discovery, ObserveOps reads each device's System OID (the identifier that names its make and model) and checks it against the SNMP Device Catalog. On a match, the right template for SNMP monitoring is applied automatically.
For a gateway model we have never seen, you create a catalog entry with its System OID, vendor and type. You then add metric groups, either scalar (single values such as CPU) or tabular (lists such as interfaces), test the OIDs and use Assign Monitors. New metrics start polling from the next cycle.
2. Collect From Gateways and Vendor APIs With Metric Plugins
Some IoT hubs only share health data through a REST API. The HTTP Metric Plugin handles those: it calls the endpoint with GET or POST, adds any parameters and headers, and parses the reply with a Python or Go script. The SNMP Metric Plugin does the same for custom OIDs.
On Linux-based edge gateways, the MotaAgent can collect metrics every second. It identifies the gateway by hostname, so a changing cellular IP doesn't break its history, and it stores data locally for a set period when the connection drops.
3. Catch Events Between Polls with SNMP Traps
Polling misses whatever happens between cycles. That's what the SNMP Trap Listener is for: it takes v1, v2c and v3 traps, and SNMP Trap Profiles parse them and set severity for well-known trap OIDs.
A trap from an unfamiliar device still shows up in the Trap Explorer, minus a name and severity. Add a custom profile and ObserveOps recognizes it next time. Our guide to SNMP trap management walks through the setup.
4. Alert on Silence, Anomalies and Forecasts
Three policy types cover the IoT cases above:
Availability Policy: Set "Notify if Monitor/Instance is down for" and "Abnormality occurrence" so a flapping cellular link alerts only after repeated Down polls, which supports uptime assurance for each site
Anomaly Policy: Learns normal ranges from at least eight hours of data, aggregates samples every 30 minutes and evaluates every 15 minutes, which suits metrics with daily cycles
Forecast Policy: Uses at least 24 hours of history to project a metric forward, for example gateway storage filling up before the next site visit; it is part of our predictive analytics capability
Each policy can also run a runbook when it fires, so a ping or traceroute result is waiting before an engineer opens the alert. Our anomaly detection page covers the learned baselines in more detail.
5. Trace a Gateway Fault and Open a ServiceOps Incident
The topology map shows how devices connect. A single red node on a switch explains why everything below it is unreachable, and before maintenance you can check which sensors depend on a gateway.
From the map, the fault moves to the service desk:
Declare Incident: A ServiceOps incident, opened automatically at the severity you choose
Urgency mapping: Set from the alert, via the mapping defined during integration
Two-way status: Closing the request in ServiceOps clears the ObserveOps alert, once the bidirectional integration is set up
Following a single alert shows where the time goes. The flow below traces a warehouse gateway fault from the first failed poll to a ServiceOps incident.
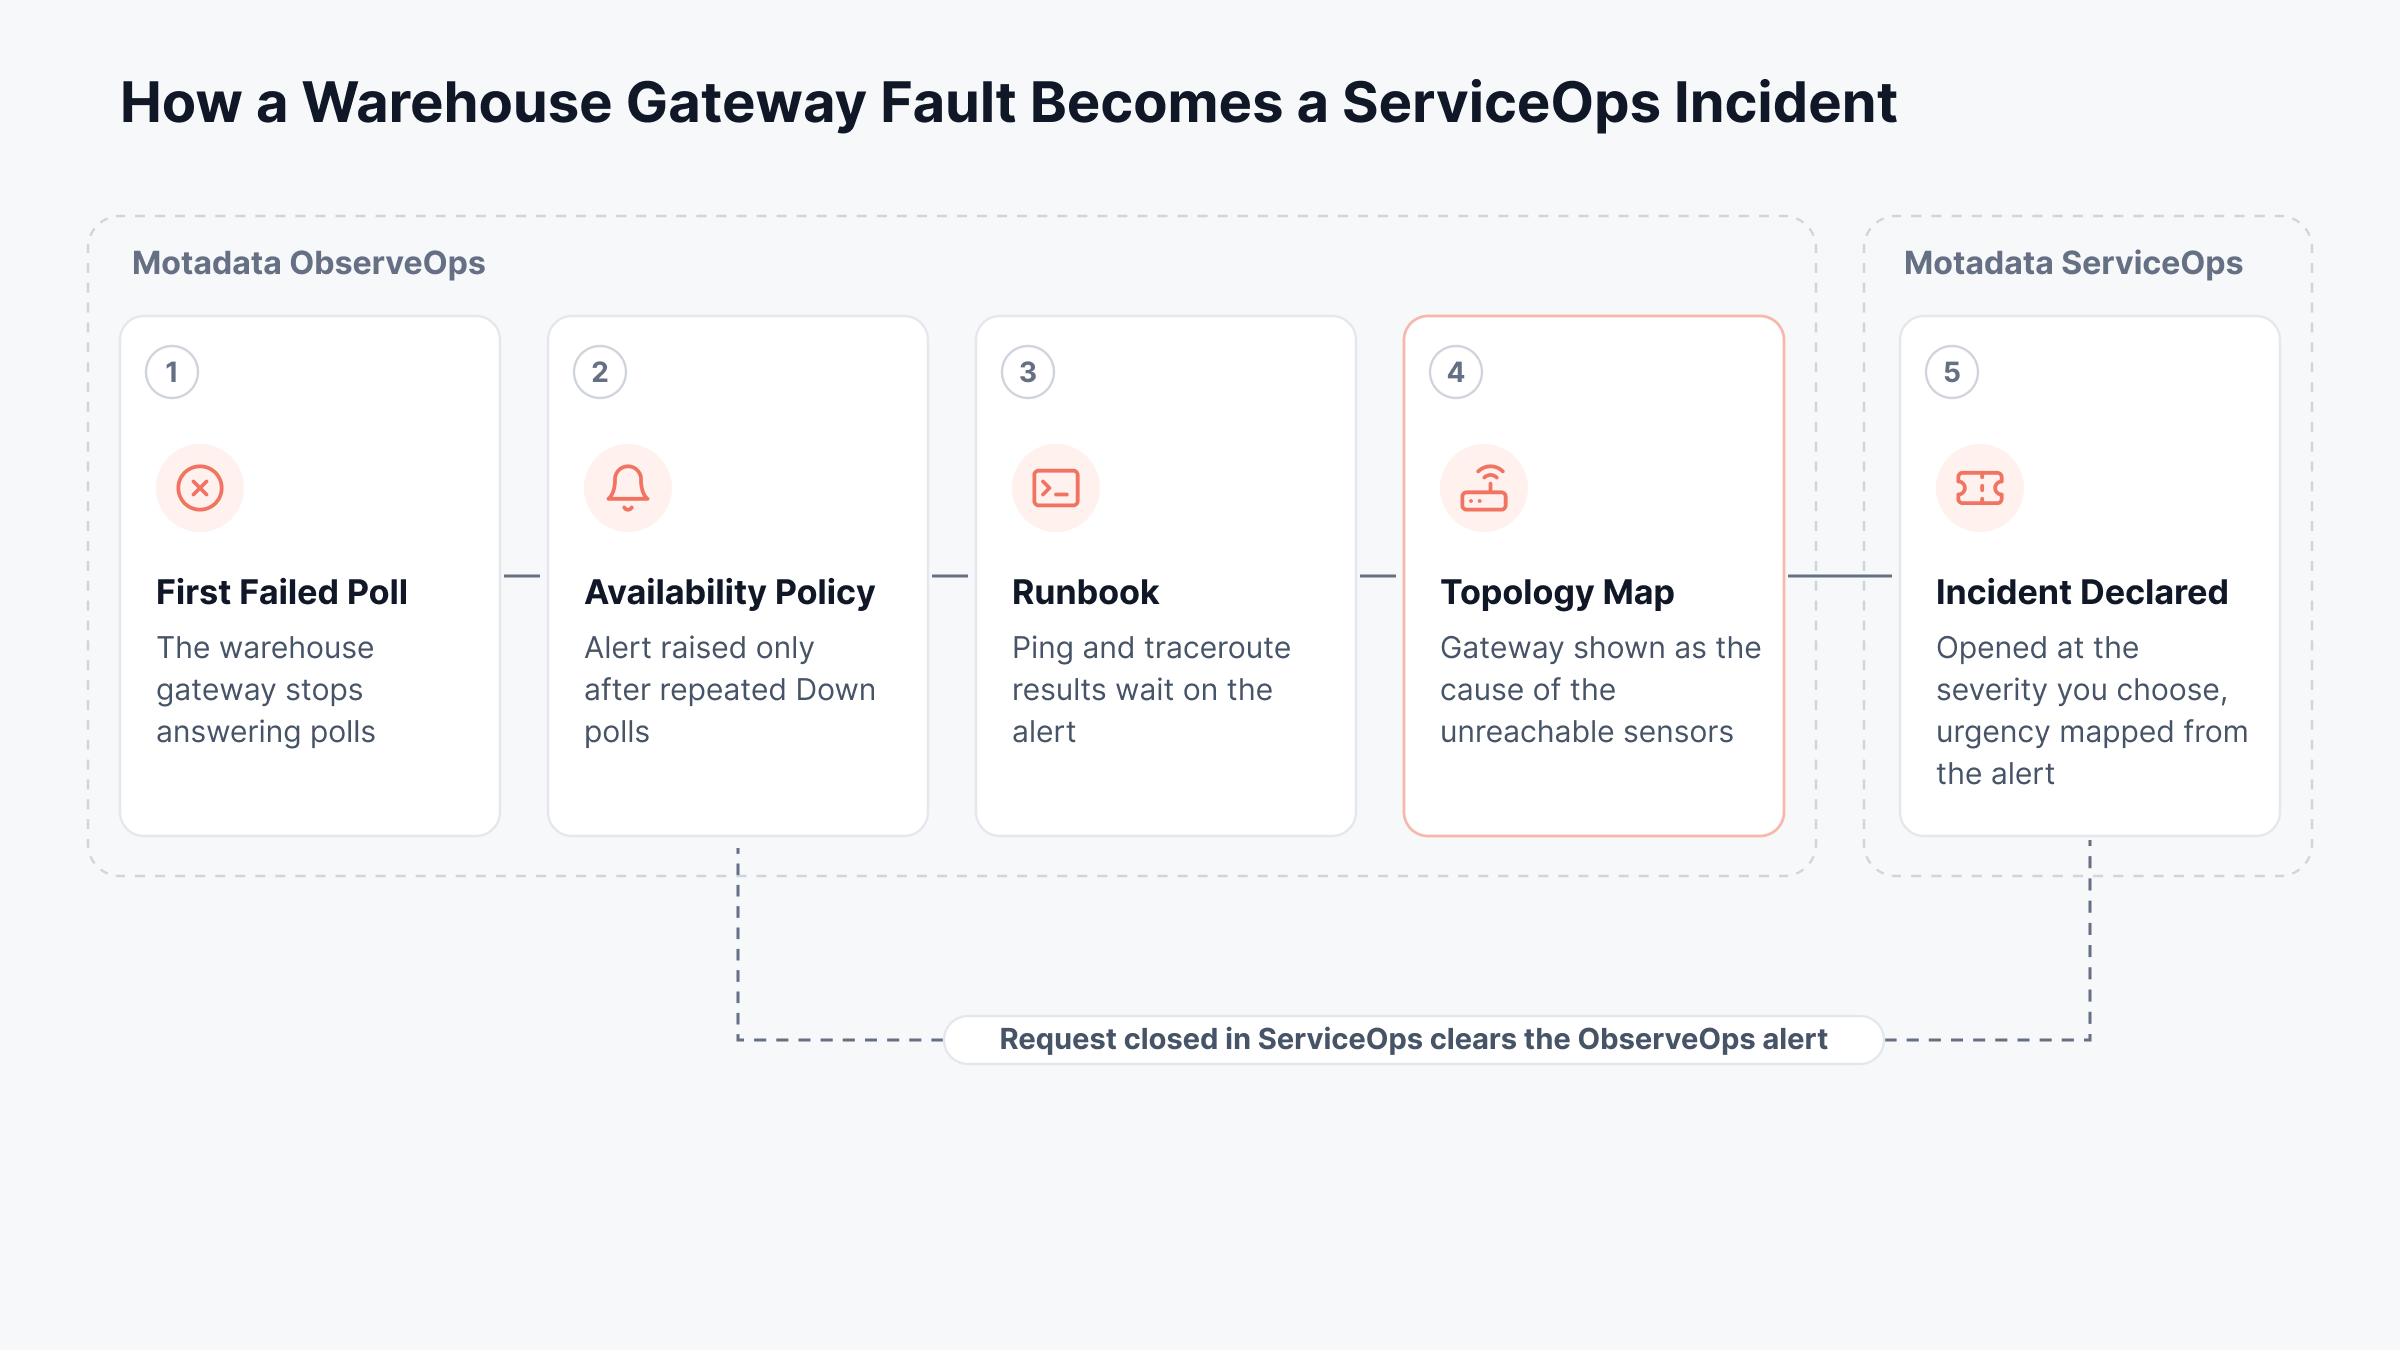
The engineer still makes the call on site. What changes is the starting point: the map already shows the gateway as the cause, and the incident is open before anyone starts working through sensor alerts.
6. Keep IoT Devices in the Asset Record with Motadata ServiceOps
Monitoring tells you a device is down. The asset record tells you what it is, which process depends on it and who owns it; ServiceOps asset discovery fills that record by scanning the network and adding new devices to the Asset or CI list, or to a staging area first.
Non-standard devices are where SNMP Custom Properties help:
Device definition: System OID mapped to asset type and manufacturer, so the next scan recognizes the model
Scalar properties: One value each, like a firmware build or a temperature
Table properties: Lists, like the probes on a multi-sensor unit
Take a temperature sensor at a remote site. Once polled, its reading shows on the asset's details page, right next to the owner a technician would call.
7. Monitor Power, Wireless and Location at Every Site
Gateways at remote sites often lose contact because of power or connectivity problems, so we cover both, along with location and local collection:
Power: UPS units from APC, Eaton, Schneider Electric and others; battery runtime and time on battery included
Wireless: Controllers, access points and clients, through Wi-Fi monitoring
Geo Map: Plots each monitored device by its configured location and colors each cluster by the worst status inside it, from Clear to Down
Local collection: Distributed Collectors at plants, depots or regional hubs, chosen per device range in each discovery profile
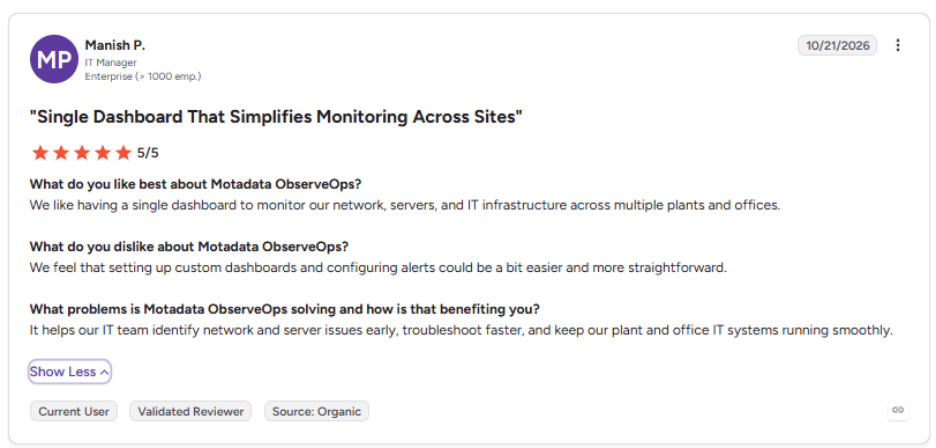
That cross-site view comes up in user reviews too, and this is what one IT manager says about Motadata ObserveOps on G2:
Move From Device-by-Device Checks to Full Observability of Your IoT Infrastructure with Motadata ObserveOps
Most IoT monitoring breaks down at the handoffs between tools. Device dashboards miss the network; network tools miss the sensors; the service desk hears last. ObserveOps joins those layers, from discovery through policies to topology and a ServiceOps ticket that already names the cause.
One concession, to be fair: no infrastructure observability platform replaces a device management platform for sensor provisioning or firmware pushes, and ObserveOps is no different. Where it helps is everything those devices depend on, at every site, so trouble reaches your engineers before your customers notice.
FAQs
What is IoT monitoring?
IoT monitoring is the continuous tracking of health, connectivity and data quality across connected devices, their gateways and the network between them. It alerts you when a device goes offline, degrades or sends readings that no longer make sense.
What is the difference between IoT monitoring and IoT device management?
IoT monitoring watches how devices and their supporting infrastructure behave over time. Device management handles provisioning, configuration and firmware updates, so most enterprises use both and connect the alerts from one to the actions in the other.
How often should IoT devices be monitored?
Poll gateways and network infrastructure every one to five minutes, and let battery-powered sensors report on their own schedule. Then alert when a device misses about three expected reports, which catches silent failures without flooding the console.
Can network monitoring tools monitor IoT devices?
Yes, for anything that speaks SNMP, sends traps, writes logs or exposes an API, which covers most gateways and industrial network devices. Platforms such as Motadata ObserveOps also let you add custom device types and metrics through catalogs and plugins.
What should an IoT monitoring platform include?
Look for device discovery, silence detection, baselining, dependency mapping and alert routing into a service desk. Support for on-premises deployment and local collection at remote sites matters too, and Motadata ObserveOps covers these for the infrastructure layer.
Author
Poonam Lalani
Content Strategist
Poonam Lalani is a B2B content strategist and writer with a background in computer engineering and experience across enterprise technology domains, including AI, cloud, DevOps, data engineering, and IT operations. She specializes in creating research-driven content that simplifies complex ideas and supports product education, thought leadership, and business growth.