What Is a Distributed System? Types, Examples and Monitoring Tips
A distributed system is a group of independent computers that work together over a network and appear to users as one system. Most modern apps run this way, from streaming platforms to online banking.
Spreading work across many machines makes an app easier to scale and harder to take down. It also means one slow service or dropped network link can break a request while every server still looks healthy.
That is why teams use application performance monitoring to follow each request from start to finish.
In this blog, you will:
Learn what a distributed system is, how it works and which types are common today.
Understand core concepts such as the CAP theorem, consensus and the fallacies of distributed computing.
Get practical tips for monitoring requests that cross many services.
What Is a Distributed System?
A distributed system is a collection of independent computers, called nodes, that coordinate over a network to do a shared job. Each node has its own CPU, memory and clock.
The nodes exchange messages to split up work, share data and cover for each other when one fails. To the user, the whole group behaves like a single application.
Most distributed systems share six traits:
Concurrency: Many nodes handle requests at the same time, often for the same data.
Scalability: You add capacity by adding nodes, instead of buying a bigger server.
Fault tolerance: The system keeps working when a node fails, because other nodes take over its work.
Independent failures: One part can fail while the rest keeps running, so failures are often partial and harder to spot.
No shared clock: Each node keeps its own time, so the order of events across nodes isn't always clear.
Transparency: Users see one system, even though the work is spread across many machines.
How Does a Distributed System Work?
A distributed system works by splitting one job into smaller tasks that run on different nodes. The nodes pass messages to each other until the job is done.
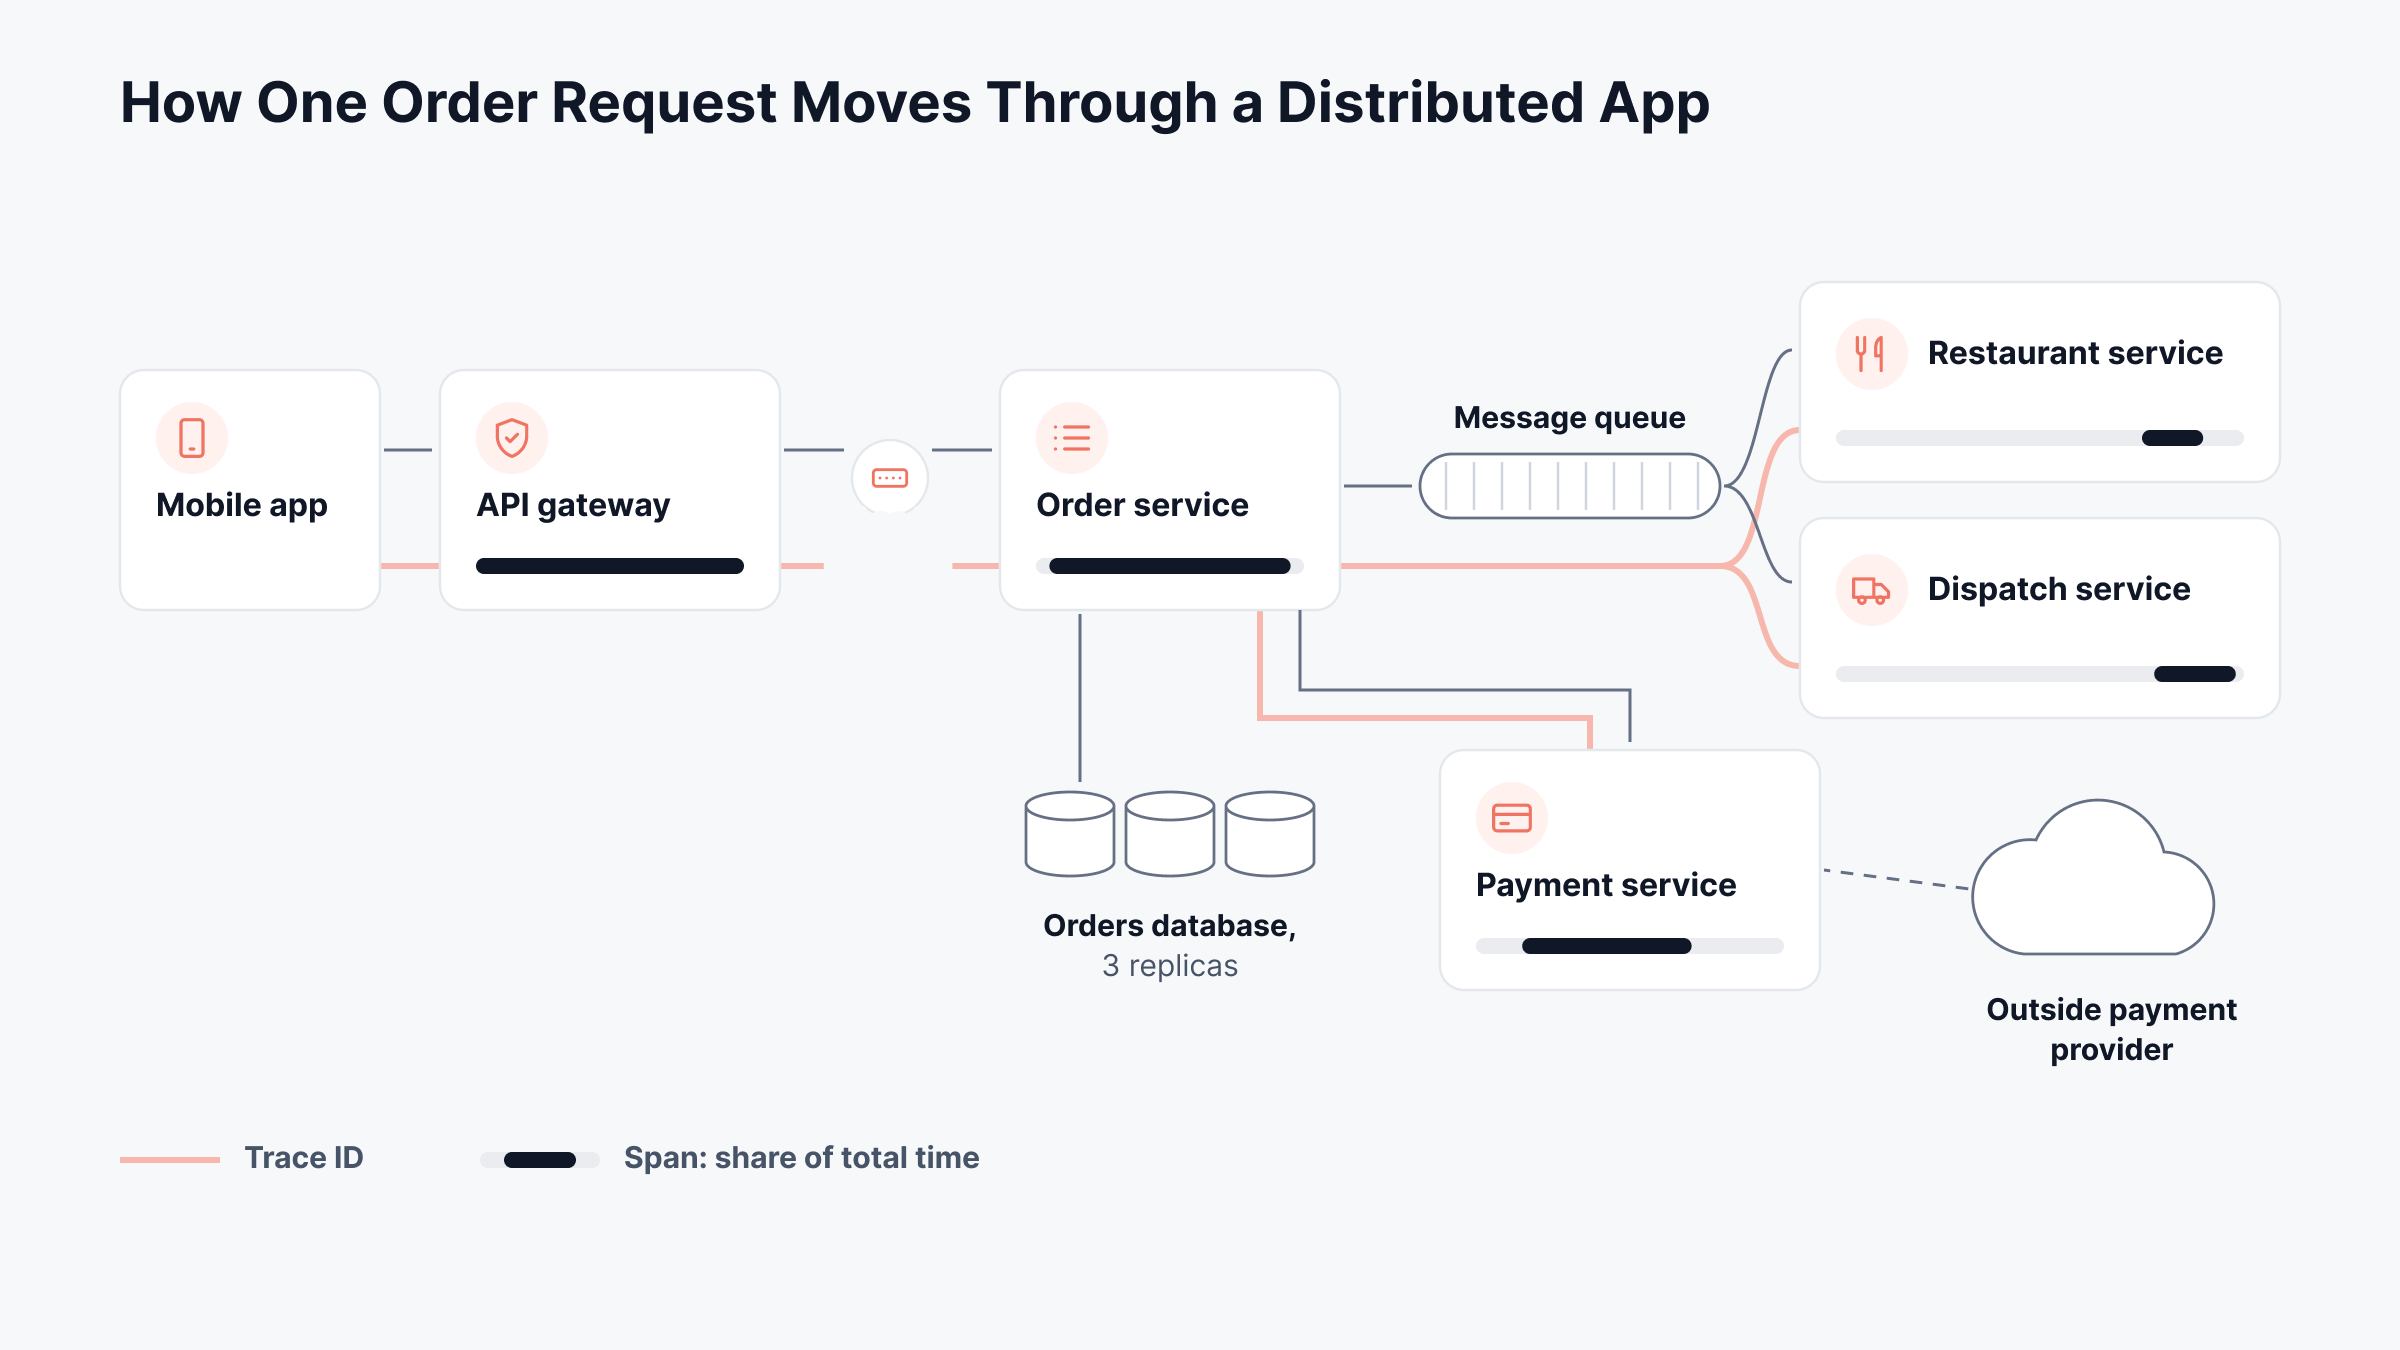
Take a fictional food delivery app. When a customer places an order, that single tap starts a chain of requests across several services:
API gateway: Receives the order from the mobile app and routes it to the right service.
Order service: Checks the cart, creates an order record and writes it to the orders database.
Payment service: Calls an outside payment provider to charge the customer's card.
Message queue: Holds an order placed event, so other services can act on it without waiting.
Restaurant and dispatch services: Read the event, send the order to the kitchen and assign a driver.
Services talk to each other in two main ways. Synchronous calls, such as HTTP APIs or gRPC, wait for a reply before moving on. Asynchronous messages, sent through a queue or event stream, let the sender continue right away.
A load balancer in front of each service spreads requests across several copies, so no single node takes all the traffic.
The orders database is distributed too. It keeps copies of each record on three nodes, so the data survives if one node fails. We'll come back to this same app when we look at failures and monitoring.
What Is the Difference Between Centralized and Distributed Systems?
A centralized system runs on one main server, while a distributed system spreads work across many nodes. The table below compares how each one behaves:
Aspect | Centralized System | Distributed System |
Where work runs | One main server | Many networked nodes |
Scaling | Buy a bigger server (vertical scaling) | Add more nodes (horizontal scaling) |
Failure impact | The server fails, and everything stops | One node fails, and others take over |
Data consistency | One copy of the data, so always consistent | Many copies that must be kept in sync |
Debugging | Logs and metrics in one place | Logs and metrics spread across many nodes |
Cost to start | Lower | Higher, with more parts to run |
Centralized systems are simpler to build and debug. We'd move to a distributed design once traffic, data or uptime needs outgrow what one server can handle.
What Are the Types of Distributed Systems?
The main types of distributed systems are client-server, multi-tier, peer-to-peer, cluster, grid, microservices and event-driven systems. Many real systems mix several of them. Each type also has a typical weak spot, which is worth knowing before you plan monitoring:
Type | How It Works | Example | Typical Weak Spot |
Client-server | Clients send requests to a central server that does the work | Email, web browsing | The server becomes a bottleneck or single point of failure |
Multi-tier (n-tier) | Work splits into layers, such as web, application and database | Most business web apps | A slow lower tier delays every tier above it |
Peer-to-peer | Every node acts as both client and server | BitTorrent, blockchain networks | Data quality and security are hard to control |
Cluster | Many similar nodes act as one powerful machine | Database clusters, Kubernetes | Uneven load and slow failover |
Grid | Loosely linked computers share spare capacity for big jobs | Scientific research projects | Slow or unreliable nodes hold up results |
Microservices and SOA | The app splits into small services that call each other | Streaming and e-commerce platforms | Long call chains that are hard to trace |
Event-driven | Services react to events on a queue or stream | Order processing, IoT data | Lost or delayed events that no one notices |
Our food delivery app combines three of these. It's a multi-tier app built from microservices, and it passes events through a queue.
What Are Some Examples of Distributed Systems?
Most large systems people use every day are distributed. Common examples include:
The internet and DNS: Millions of name servers answer lookups, and no single server holds every record.
Content delivery networks: Copies of web content sit on servers close to users, which cuts load times.
Cloud platforms such as AWS: Services run across Regions and Availability Zones, so one data center failure doesn't take everything down.
Kubernetes: A control plane schedules containers across many worker nodes and stores cluster state in etcd.
Distributed databases: Systems such as Cassandra and CockroachDB spread and copy data across many nodes.
Streaming and e-commerce platforms: Video, search, cart and payment features run as separate services.
Payment networks: A card payment passes through the merchant, the card network and the bank before approval.
Blockchain networks: Thousands of nodes keep matching copies of a shared ledger.
We often use Kubernetes as an example of a system that is distributed in two ways. It runs on many nodes itself, and it hosts distributed apps, which is why Kubernetes monitoring covers both the cluster and the workloads inside it.
What Core Concepts Should You Know About Distributed Systems?
A few core ideas explain why distributed systems behave the way they do. They also explain many of the failures teams see in production.
1. CAP Theorem
The CAP theorem covers three properties: consistency, availability and partition tolerance. It says a distributed data store can't guarantee all three at once. Eric Brewer proposed it in 2000, and Seth Gilbert and Nancy Lynch proved it in 2002.
Network partitions will happen sooner or later, so the real choice comes during a partition. The system either rejects some requests to stay consistent, or it keeps answering and risks returning stale data.
For example, we'd expect a bank balance service to pick consistency. A product review count can pick availability, because a slightly old number does little harm.
2. Consensus With Raft and Paxos
Consensus is how nodes agree on a single value, such as which node is the leader or the order of writes. Paxos, described by Leslie Lamport, came first and is known for being hard to implement. Raft, published in 2014, was designed to be easier to understand. etcd, the data store behind Kubernetes, uses Raft.
Both algorithms rely on a majority of nodes, called a quorum. A three-node cluster survives one failed node, and a five-node cluster survives two.
3. Replication and Sharding
Replication keeps copies of the same data on several nodes. It protects against node failure and spreads read traffic. Sharding splits data into parts and stores each part on a different node, which spreads write traffic.
Most large databases use both, so each shard is also replicated and losing one node doesn't lose any data.
4. Clocks and Event Ordering
Every node has its own clock, and those clocks drift apart over time. A few milliseconds of skew can make log entries from two servers appear in the wrong order. Teams sync clocks with NTP. When the order of events matters more than the exact time, they use logical clocks, such as Lamport timestamps.
5. The Fallacies of Distributed Computing
The fallacies of distributed computing are eight false assumptions that developers often make about networks.
L. Peter Deutsch and his colleagues at Sun Microsystems wrote them down in the 1990s. Each one shows up in production as a specific symptom, and each points to a signal you can monitor:
Fallacy | What You See in Production | Signal to Monitor |
The network is reliable | Timeouts and failed calls between services | Error rate and retry count per service call |
Latency is zero | Slow pages caused by chains of remote calls | P99 latency for each hop in a trace |
Bandwidth is infinite | Slow transfers when large payloads or backups run | Interface utilization and throughput |
The network is secure | Unexpected traffic between services | Flow data and access logs |
Topology doesn't change | Calls fail after nodes move or scale | Service map changes and DNS errors |
There is one administrator | A change by one team breaks another team's service | Change and deployment events |
Transport cost is zero | Rising cloud data transfer bills and CPU spent on serialization | Data transfer volume per service |
The network is homogeneous | Errors only in certain regions, devices or protocols | Error rate split by region, host and version |
We use this table as a checklist. If a signal in the right column isn't collected today, that fallacy can catch your team off guard.
What Are the Benefits and Challenges of Distributed Systems?
Distributed systems trade simplicity for scale and resilience. The benefits explain why most large apps are built this way, and the challenges explain why they need careful monitoring.
Benefits of Distributed Systems
The main benefits of distributed systems come from spreading work, data and risk across many nodes:
1. Horizontal Scalability
You add capacity by adding nodes, which is usually cheaper than buying a bigger server. Each service can also scale on its own. In the food delivery app, the order service can run 20 copies at dinner time while the restaurant service stays at 4.
2. Fault Tolerance and High Availability
Replicas and failover keep the app running when a node, a rack or a whole availability zone fails. A load balancer stops sending traffic to the failed copy, and the rest absorb its load. Users may never notice the failure at all.
3. Lower Latency for Users
Data and services can run in several regions, close to the people who use them. A customer in London reads from a European node, not one in Virginia. CDNs and edge caches apply the same idea to static content.
4. Parallel Processing
Large jobs split into smaller tasks that run on many nodes at once. Analytics queries, video encoding and machine learning training finish in a fraction of the time one machine would need.
5. Independent Releases
Separate teams can build, test and deploy separate services on their own schedule. A change to the payment service doesn't require redeploying the whole app. That speeds up delivery and limits the impact of a bad release.
6. No Single Point of Failure
A well-designed system has no one machine whose loss stops everything. Leaders are elected with consensus, data has replicas and every service runs more than one copy.
Those benefits come with a cost. Every network hop adds a new way for a request to fail, and failures become harder to see.
Challenges of Distributed Systems
These are the challenges we see most often when teams run distributed systems in production:
1. Partial Failures
One service fails while the others keep running, so the app half works. Customers might browse menus and fill a cart but fail at checkout. Server health checks often stay green, which makes the cause harder to find.
2. Cascading Failures
A slow dependency ties up threads and connections in every service that calls it. Those services slow down too, and the problem spreads up the call chain. Timeouts and circuit breakers limit how far it can travel.
3. Retry Storms
When a service struggles, its clients retry failed calls, often all at the same time. The extra traffic can stop a service from recovering. Retries need limits, plus exponential backoff with random jitter, to avoid this.
4. Data Consistency
Replicas take time to catch up after a write, so two users can briefly see different data. Teams have to pick where they need strong consistency and where eventual consistency is good enough. The CAP theorem above is the reason this trade-off exists.
5. Network Latency and Unreliability
Every remote call is slower and less reliable than a local function call. A request that crosses 10 services pays that cost 10 times. Small delays at each hop add up to a slow page for the user.
6. Security Across Many Endpoints
Each service, API and message queue is another entry point to protect. Traffic between services needs encryption and authentication, not just traffic from the internet. Secrets and certificates also have to be managed on every node.
7. Debugging and Observability
Evidence for one request is split across many logs, hosts and teams. Without a shared trace ID, engineers have to match timestamps by hand across systems whose clocks may not agree. This is often the challenge that costs teams the most time during an outage.
In our food delivery app, a slow payment provider can trigger most of these challenges at once. Orders hang, retries pile up and the order service runs out of threads.
The root cause, meanwhile, sits outside your own network. The next sections show how teams keep these problems visible, starting with how microservices fit into the picture.
Are Distributed Systems the Same as Microservices?
No, microservices are just one type of distributed system. Many distributed systems don't use microservices at all. A Cassandra cluster or a research computing grid is distributed without being built from microservices.
A microservices app, on the other hand, is always distributed, because its services talk over a network. So microservices monitoring uses the same tracing and log methods covered below.
How Do You Monitor a Distributed System?
You monitor a distributed system by collecting metrics, logs and traces from every service and linking them with a shared trace ID.
That link lets you follow one request across every node it touched. Without it, each team sees only its own piece of the problem. These are the practices we'd put in place first:
Trace every request end to end: Instrument each service, so a request carries one trace ID through every call. Distributed tracing then shows which hop added the delay or the error.
Track RED metrics for each service: Watch the rate of requests, the errors and the duration for every service. Add latency, traffic, errors and saturation for shared infrastructure such as databases and queues.
Map dependencies automatically: A live map of which service calls which shows how far a failure can spread. It also catches topology changes as services scale or move.
Centralize logs and tag them with the trace ID: Send logs from every node to one place, and include the trace ID in each log line. That turns a search across 20 hosts into one query.
Keep clocks in sync: Run NTP on every node, so timestamps from different hosts line up during an investigation.
Use percentiles, not averages: Averages hide the slow requests users notice. Track P95 and P99 latency for each service and each hop.
Alert on user-facing symptoms: Alert when errors or latency rise at the edge of the system, then use traces to find the cause. Alerting on every internal metric floods teams during a cascading failure.
Standardize your instrumentation: OpenTelemetry gives every service the same format for traces, metrics and logs, whatever language it's written in.
Here's how that plays out in the food delivery app. Order confirmations slow from 1 second to 8 seconds, and the error rate on the order service climbs.
A trace of a slow order shows the order service waiting 7 seconds on the payment service. The payment service's own spans show most of that time spent calling the outside payment provider.
Its logs, found with the same trace ID, show repeated timeouts and retries. So the fix belongs in the payment provider integration, even though the order service raised the first alert. A root cause analysis that starts from the alerting service alone would have looked in the wrong place.
How ObserveOps Follows a Request Across Services
ObserveOps collects traces, metrics and logs in one platform, and its APM module ties them to each request. Below, we walk through how we'd investigate the slow order above, based on the steps in our product docs.
Step 1: Instrumenting Services, Including Kubernetes
ObserveOps APM collects traces through MotaAgent, with agent-based setup for Java, .NET, PHP, Node.js, Python, Go, C++ and Ruby. For containerized apps, Kubernetes APM uses a Kubernetes Operator with OpenTelemetry-based agents.
Together, they instrument workloads automatically. The setup covers Kubernetes, OpenShift, EKS, GKE, AKS, OKE, Rancher and EKS Fargate. You start it under Menu, Settings, APM and Application Registration.
Step 2: Spotting the Slow Service in APM Explorer
APM Explorer lists every instrumented service as a tile with its response time, throughput and error rate. Response time can be viewed as P99 latency or P50. P99 shows the worst outliers, while P50 shows the typical request. In the food delivery example, the order service tile would show a rising P99 and error rate first.
Step 3: Following Dependencies on the Service Map
Each service has a Service Map tab that shows the databases, queues, caches and other services it talks to. Hovering over an entity shows its own response time and error rate. For the order service, the service map would point straight at the payment service as the slow dependency.
Step 4: Reading the Trace in a Flame Chart
From the Transactions tab, you can open any root span and see its traces plotted by response time. Selecting a trace opens a flame chart of the root span and its child spans, with the time each span took. A long bar for the payment call would confirm where the 7 seconds went.
Step 5: Checking Host, Network and Database Context
The trace drill-down includes Host, Network, Process and Database tabs for the node where the root span ran. The Host and Metric tabs show a 2-hour window around the trace, from one hour before to one hour after. That helps you see whether the slowdown matched a CPU spike, TCP connection issues or a busy database.
Step 6: Jumping From a Trace to Its Logs
The Logs tab shows application logs for the same service, filtered automatically to 15 minutes before and after the trace. With this log correlation, the payment timeouts appear next to the trace without a separate search.
One limit is worth stating plainly. Tracing only covers services you instrument. A third-party API, such as the payment provider, appears as a call from your own service, but you can't see inside it. We'd instrument the services on your most important request paths first, then expand from there.
Monitor Distributed Systems With Motadata ObserveOps
A distributed system spreads one application across many independent nodes that work as one. That design brings scale and resilience, but it also brings partial failures, clock drift and requests that cross many services.
Core concepts like the CAP theorem and the fallacies of distributed computing explain why these problems appear. Good monitoring then shows you where they appear in your own system.
Traces linked by a shared ID, RED metrics, a live dependency map and correlated logs let your team follow any request to the hop that failed.
We built ObserveOps as part of our unified observability and ITSM platform, so traces, metrics, logs and infrastructure data sit in one place. Your team can move from a slow service to its root cause without switching tools.
FAQs
Is AWS a distributed system?
Yes, AWS is a distributed system. It runs services across many data centers grouped into Regions and Availability Zones. Services such as Amazon S3 and DynamoDB store copies of data on multiple nodes, so they keep working when individual servers fail.
Is Kubernetes a distributed system?
Yes, Kubernetes is a distributed system. Its control plane schedules containers across many worker nodes. Cluster state lives in etcd, which uses the Raft consensus algorithm. Kubernetes also hosts distributed apps, so it's both a distributed system and a platform for running them.
What is the difference between distributed and parallel computing?
Parallel computing splits a task across processors that usually share memory inside one machine. Distributed computing splits work across separate machines that each have their own memory and talk over a network. Distributed systems must also handle network delays and partial failures.
Is the internet a distributed system?
Yes, the internet is the largest distributed system in use. Millions of independent networks and servers cooperate through shared protocols such as TCP/IP and DNS. No single computer controls it, and it keeps working when individual parts fail.
Can a database be distributed?
Yes, a database can be distributed across several nodes, often in different locations. It uses replication to keep copies of data and sharding to split large datasets across nodes. Examples include Cassandra, CockroachDB and Amazon DynamoDB.
Author
Ramya Shah
Technical Writer
Ramya Shah is a technical content writer with a computer engineering background and roots in automotive journalism. He covers IT Service Management, observability, IT operations, and AI-driven automation. An early adopter of AI-assisted writing workflows, he turns complex IT processes into clear, engaging content optimized for search and answer engines (AEO), lifting content output and organic visibility.