Cyber Security Monitoring for Faster Threat Detection and Lower Breach Costs
When a firewall logs hundreds of denied connections from one external address overnight, does anyone look at them before that address finds an open port? In most organizations, the logs exist. What's missing is a rule that reads them, an alert that reaches the right person and a clear next step.
The delay usually comes from how security data is split up. Firewall events land in one console, Windows logs in another and cloud audit trails in a third, so a pattern that crosses all three has no owner. Attackers rely on that quiet period between the first signal and the first response.
Cyber security monitoring turns those scattered records into alerts with an owner and a playbook, and it builds on the same log monitoring most IT operations already run. In this blog, you will see what cyber security monitoring covers, what it saves the business, which signals to watch in each layer, and how to respond when an alert fires.
What is Cyber Security Monitoring?
Cyber security monitoring is the continuous collection and analysis of logs, network traffic, configuration changes and user activity to detect threats and start a response before they cause damage. Because an attack typically leaves small traces in several systems before it does harm, reading those systems together gives you time to act while the damage is still limited.
When people ask "what is monitoring in cyber security?", this is usually what they mean: An ongoing watch over systems the organization owns, tied to a response process. Cybersecurity monitoring, cyber security threat monitoring and cyber threat monitoring all describe the same discipline, and it has four jobs:
Collect: Logs, flow records, endpoint events and configuration snapshots from every layer
Detect: Rules, baselines and threat intelligence that separate attack patterns from normal activity
Alert: A notification with context, sent to whoever owns the affected system
Respond: A defined path to contain the threat, fix the cause and record what happened
How Does Cyber Security Monitoring Differ from Network Security Monitoring, SIEM and Security Observability?
These terms overlap and are often used interchangeably. Here is how they separate by scope:
Term | Scope | Typical data |
Cyber security monitoring | The whole program, every layer plus the response process | Logs, flows, endpoint events, cloud activity, configuration changes |
Traffic entering, leaving and moving inside the network | Flow records, packet captures, firewall and IDS events | |
A tool category that centralizes and correlates security logs | Normalized log events from many sources | |
The ability to explain why a signal appeared | Logs, metrics, flows and traces joined by host, user and time |
Monitoring answers "did a known bad thing happen?" Observability answers "what is going on here, and why?" when an alert matches nothing on file, so a mature program needs both.
What is Continuous Monitoring in Cyber Security?
Continuous monitoring in cyber security means checking threats, vulnerabilities and security controls often enough to support risk decisions, which in practice mixes real-time alerts with scheduled reviews. An attacker can move from one stolen login to a file server in hours, so a check that runs once a week may find the intrusion only after the data is gone.
Search for "continuous monitoring cyber security" and most definitions trace back to NIST SP 800-137. NIST describes it as keeping ongoing awareness of security, vulnerabilities and threats so the organization can make risk decisions, and it leaves the exact frequency to each organization. So "continuous" covers two speeds:
Real time: Failed logons, privilege changes, traffic to known malicious addresses, audit logs being cleared
Scheduled: Vulnerability scans, configuration compliance checks, access reviews and daily summaries of denied traffic
Continuous security monitoring works best when each signal gets the speed its risk deserves. A login from a new country to an admin account can't wait for tomorrow's report; an unpatched printer driver usually can.
Why Does Cyber Security Monitoring Matter to the Business?
Cyber security monitoring matters because the time between an intrusion and its discovery drives much of the cost of a breach. Every extra day inside the network gives an attacker more time to find valuable data, so slower discovery usually means a larger and more expensive incident.
According to IBM's 2026 breach cost report, organizations took an average of 183 days to identify a breach and another 64 days to contain it. Breaches with lifecycles over 200 days averaged $5.65 million; those resolved sooner averaged $4.32 million.
Most of a breach's lifecycle goes to finding it, so detection speed is where the savings are. The chart below puts the two halves of the lifecycle and the two cost averages side by side.
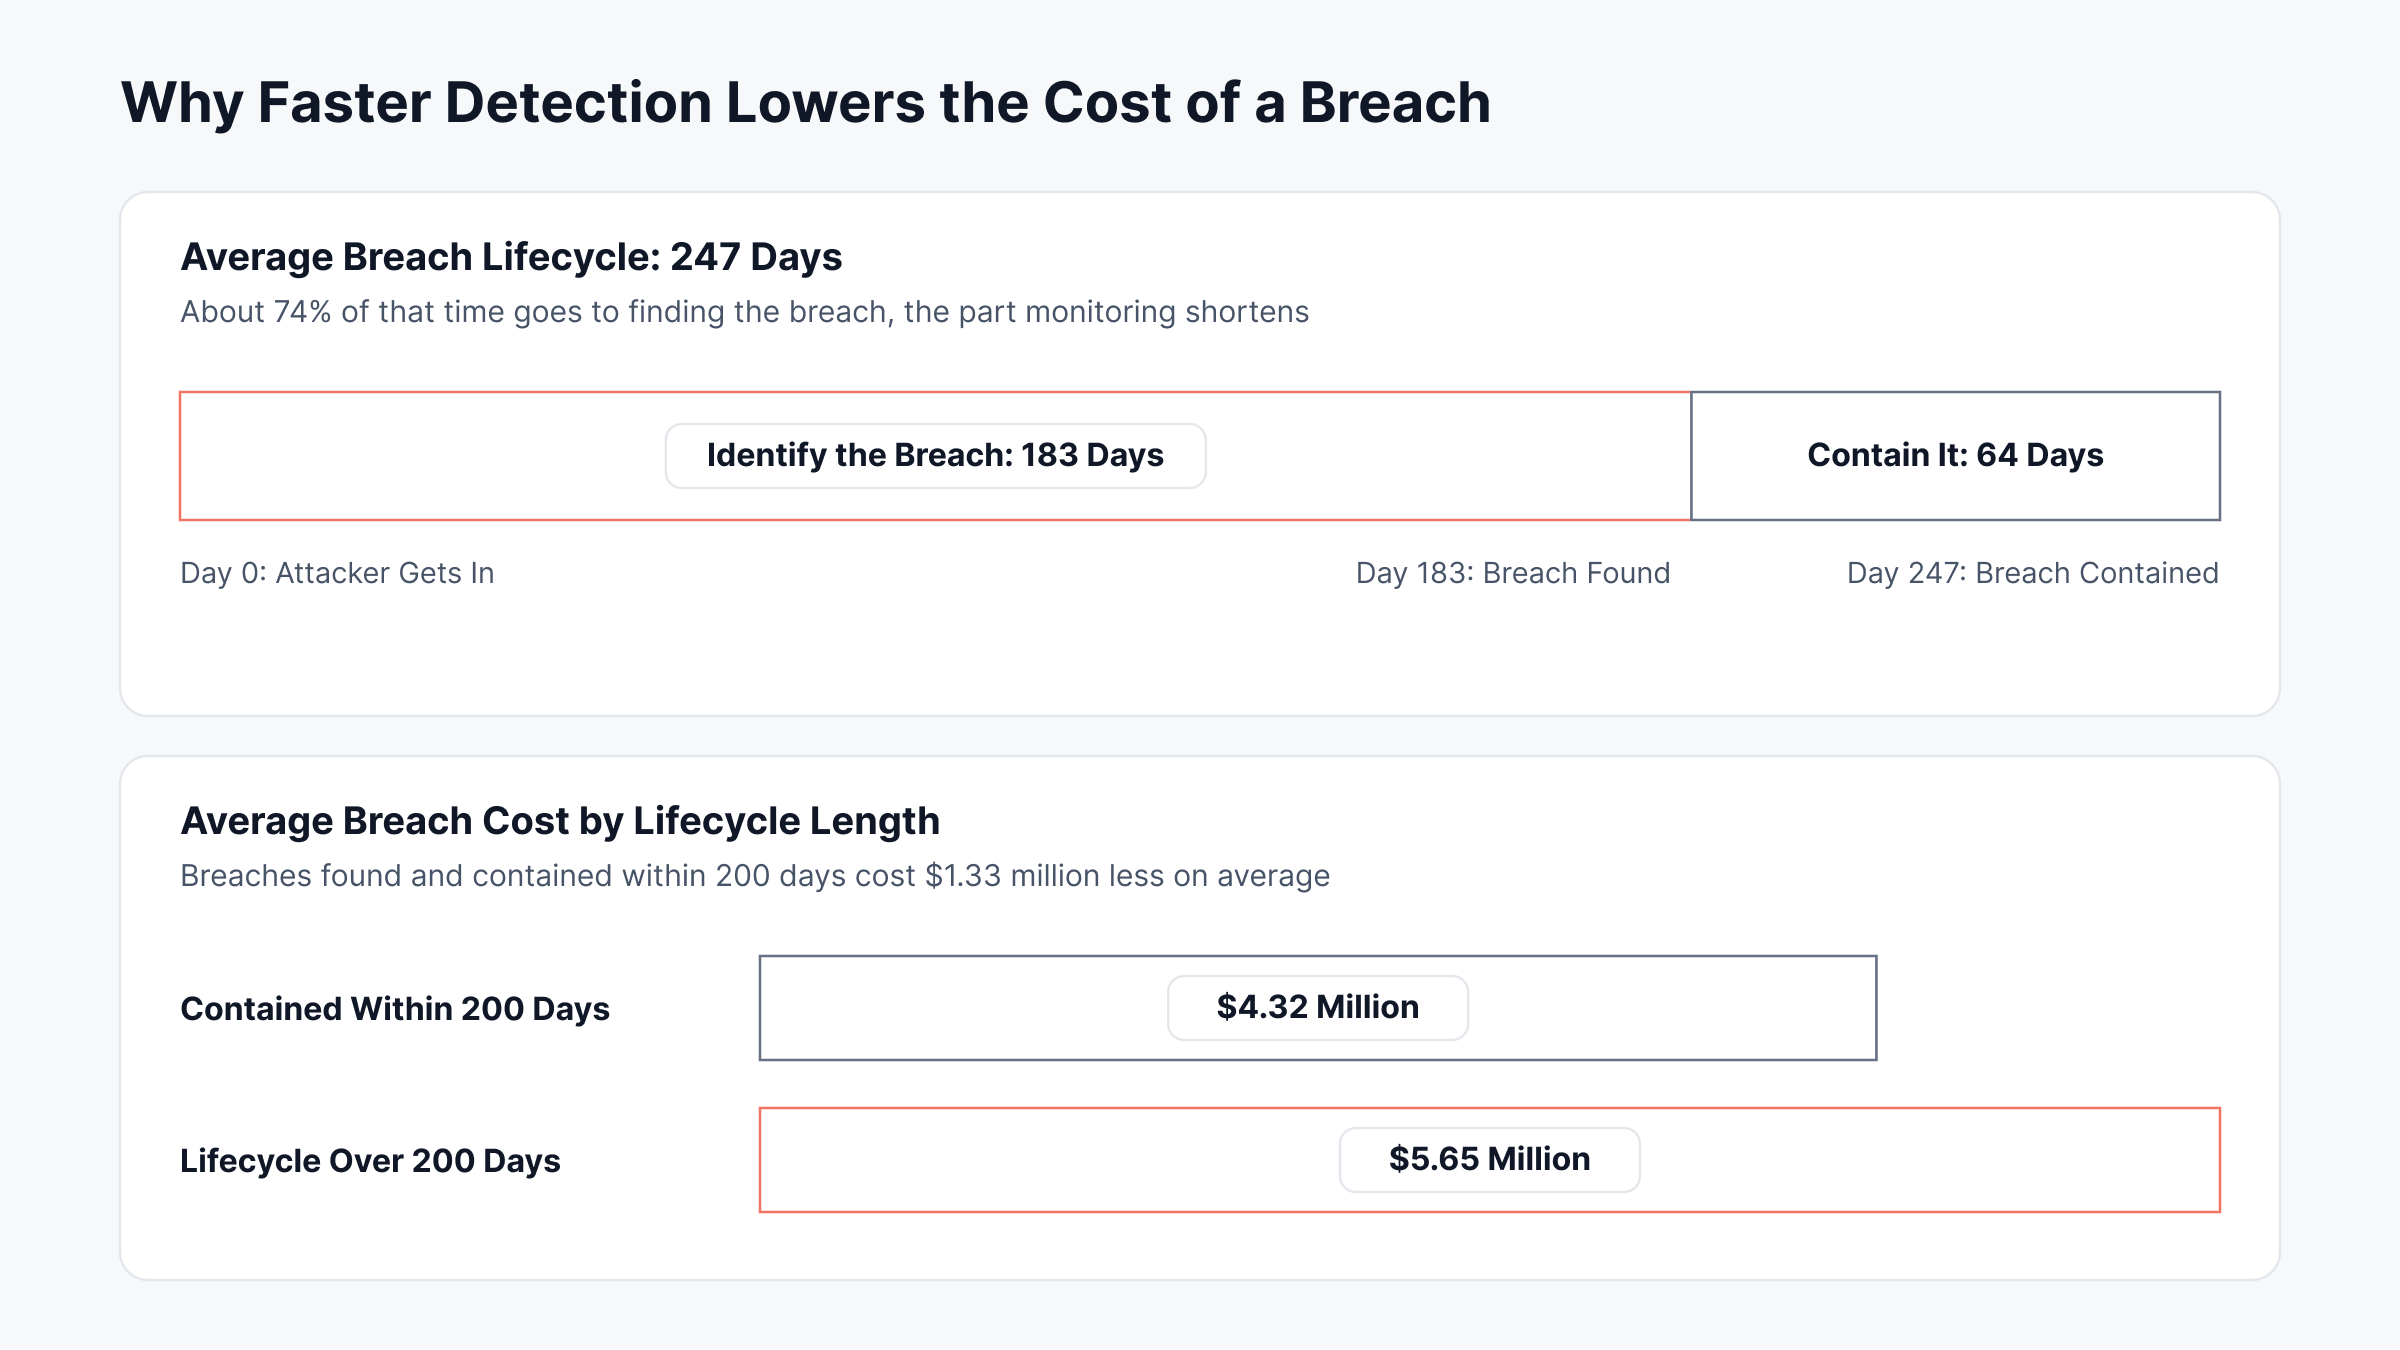
That is roughly 74% of the lifecycle spent on discovery, the part monitoring is built to shorten. The gains reach well past the security budget:
Shorter dwell time: An attacker found in hours has less time to reach backups, payroll or customer records
Audit evidence: Retained logs and alert records support PCI DSS, HIPAA, ISO 27001 and SOC 2 compliance reviews
Fewer surprise outages: Ransomware often shows up first as odd traffic or failed logons
Clear accountability: Each alert carries an owner, a ticket and a closing note
How Does Cyber Security Monitoring Work?
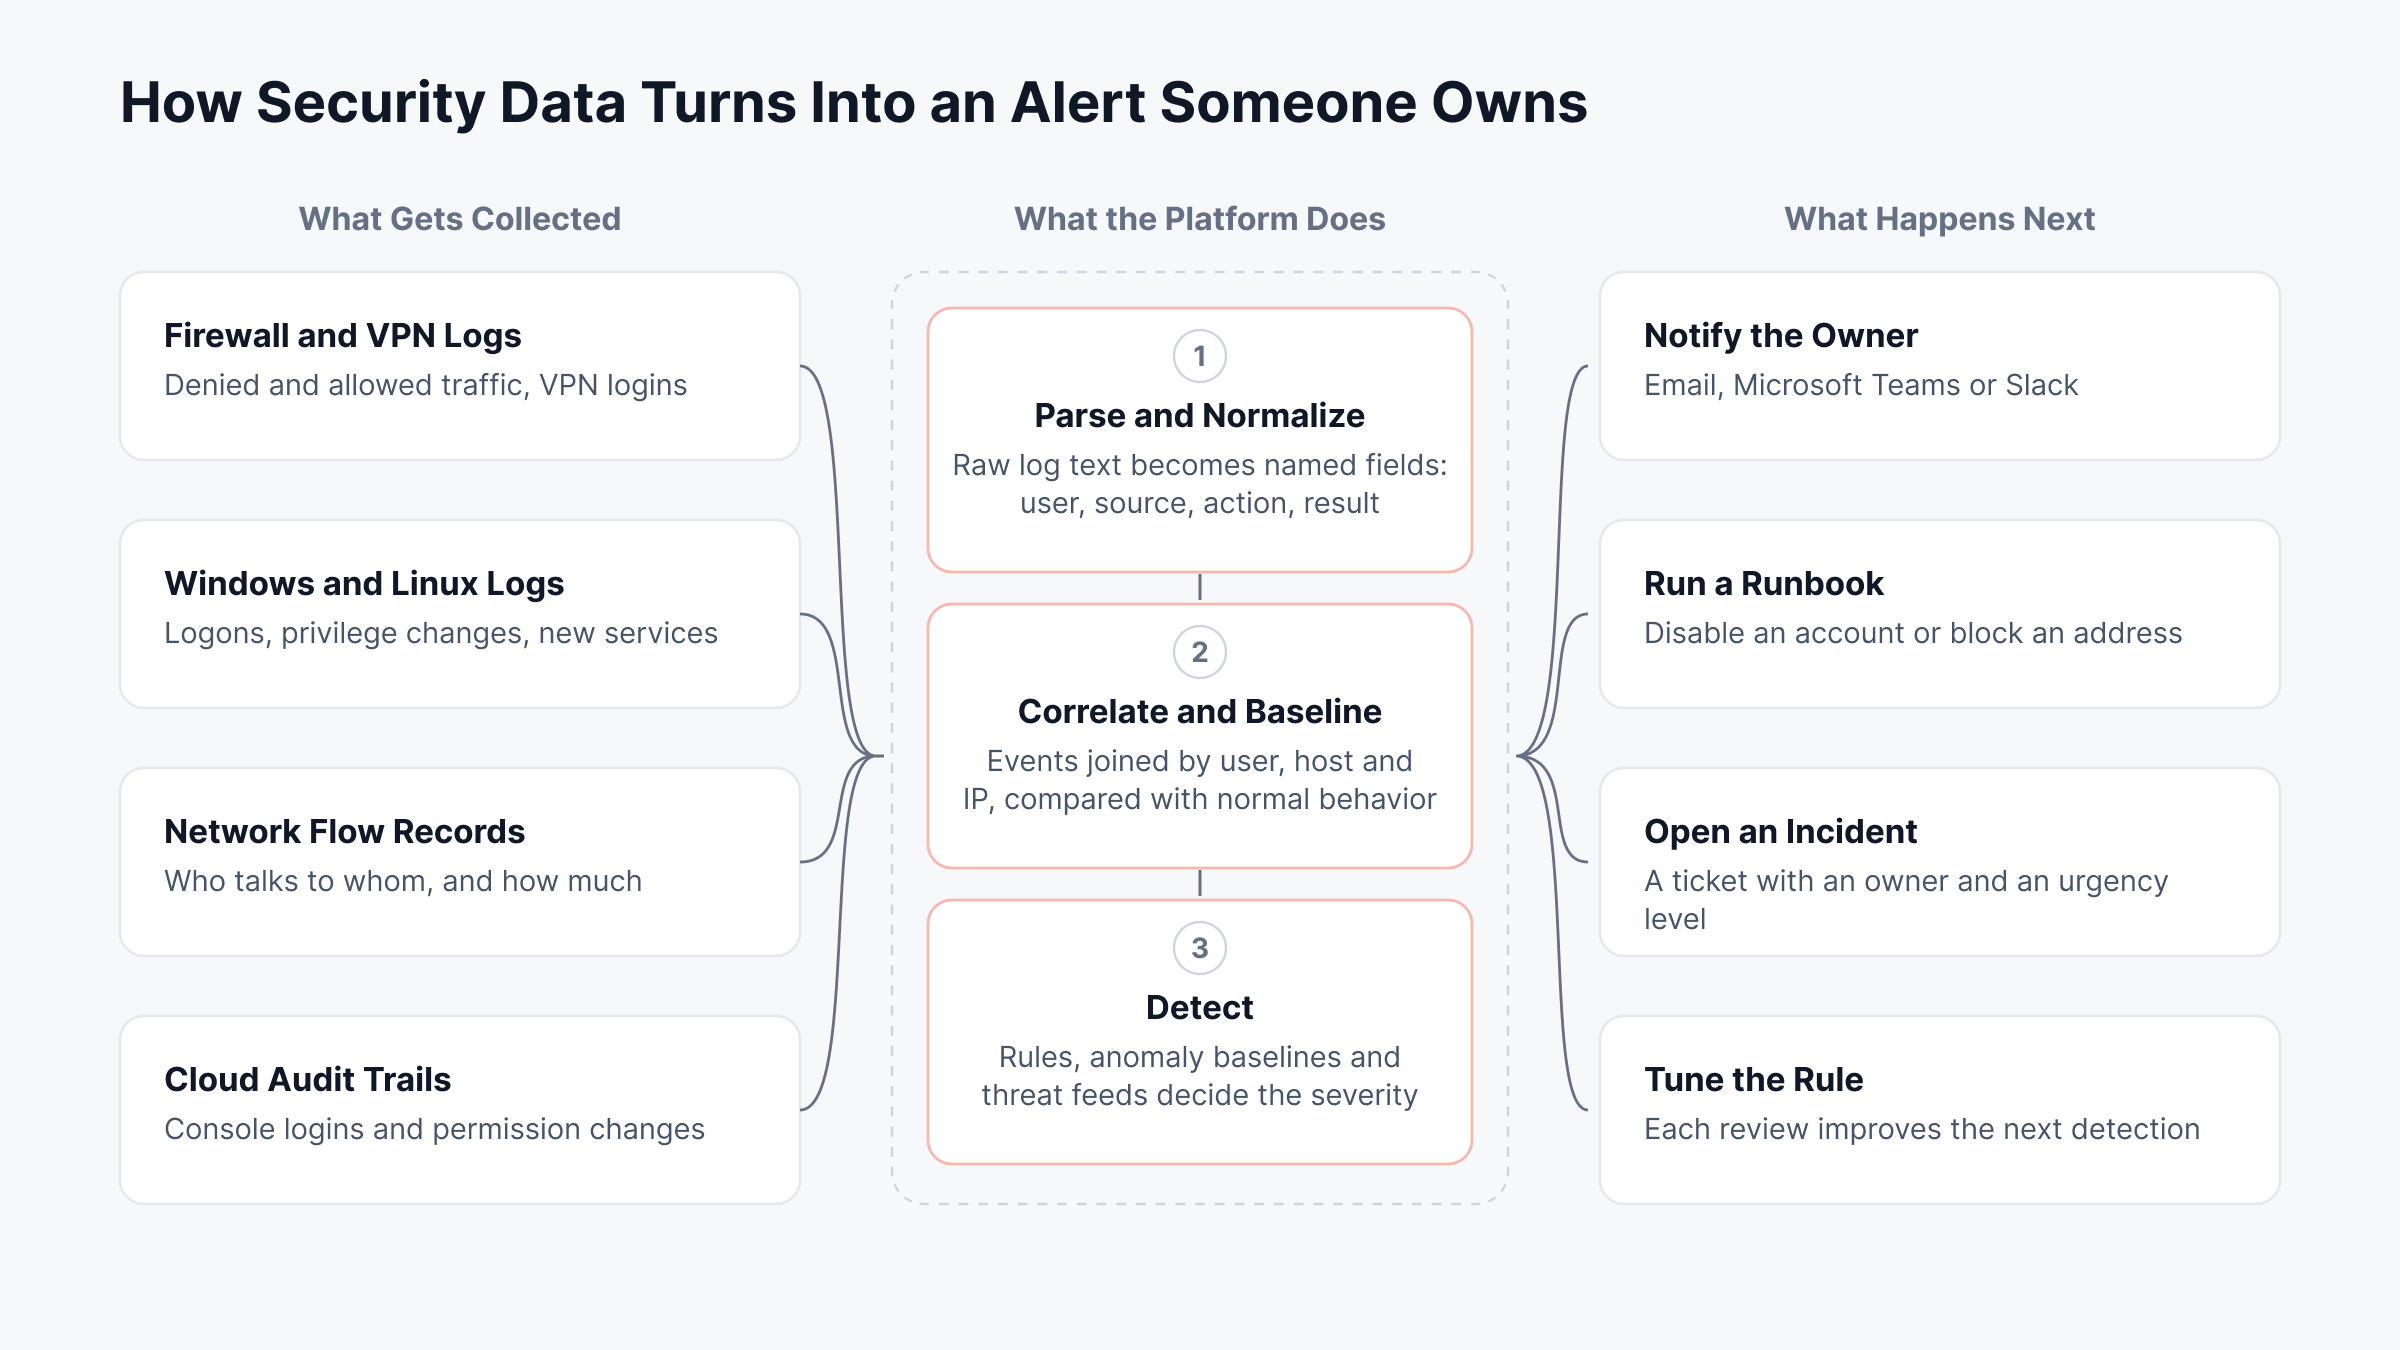
Cyber security monitoring works as a pipeline that collects telemetry, normalizes it, correlates related events, detects threats and routes each alert into a response. If one stage is missing, every stage after it works on incomplete data; for example, a rule cannot match a user name that was never parsed out of the raw log.
Each stage feeds the next one:
Collection: Syslog, Windows event logs, flow records (NetFlow, sFlow, IPFIX) and cloud audit trails
Parsing and normalization: Each source's format becomes named fields such as user, source IP, action and result
Correlation and baselines: Related events joined across sources through event correlation, with normal behavior learned per host, user or link
Detection: Rules, thresholds, anomaly models and threat feeds that decide what counts as suspicious
Triage and response: An alert with context, then containment, a ticket and a review
Correlation is the stage that turns separate events into one story. For example, if the VPN logs a login from a new country and a domain controller logs a privilege change for the same account minutes later, correlation can raise one alert in place of two unrelated ones.
Most missed detections trace back to a source that never got collected or a stage that was skipped. The diagram below shows how four common data sources pass through the platform and come out as four kinds of action.
Which Detection Methods Do Security Monitoring Tools Use?
Detection is the stage where security monitoring tools differ most, and most of them combine four methods because each one misses something the others catch:
Rules and signatures: Known patterns, such as a malware file hash or "more than 10 failed logons in five minutes"
Thresholds: Counts and rates, such as outbound traffic above a set volume per hour
Anomaly detection: Machine-learning baselines of normal activity per user, host or link, explained in our guide to anomaly detection
Threat intelligence: Feeds of known malicious IP addresses, domains and file hashes matched against your traffic
Behavior monitoring in cyber security, often sold as UEBA, applies the third method to people and devices. It catches the insider threat or stolen account that no signature describes.
What Should You Monitor in Each Layer of Your Environment?
Cyber security monitoring should cover the eight layers where attackers leave traces: Identity, network traffic, the perimeter, endpoints and servers, DNS, cloud and applications, device configuration and vulnerability exposure. Each layer records a different step of an attack, so a gap in one layer can hide a step the others never see.
Start with systems that hold sensitive data and privileged accounts. Each layer below ends with the business risk it guards against, to help decide where to invest first.
1. Identity and Authentication Activity
Stolen or misused credentials appear in a large share of intrusions, so logon activity is the first place to look. On Windows, a short list of Security log events carries most of the signal:
Event ID | What it records | What to alert on |
4625 | Failed logon | Many failures for one account or source in minutes |
4624 (logon type 10) | Successful remote desktop logon | RDP logons from unexpected hosts or out of hours |
4672 | Special privileges assigned at logon | Admin-level logons by accounts that rarely use them |
4728 and 4732 | Member added to a security group | Additions to Domain Admins or local Administrators |
1102 | Security audit log cleared | Every occurrence, since legitimate clearing is rare |
4698 and 7045 | Scheduled task created, service installed | New tasks or services on servers that rarely change |
Linux needs the same attention: Sudo and su use, SSH authentication failures in auth.log or secure, and new keys in authorized_keys files. Vendor and contractor accounts deserve the same alerts, since third-party access is a common way in. A zero trust model helps here, because every access request is checked and leaves a record.
Business risk: Account takeover that leads to data theft or fraudulent payments
2. Network Traffic and Flow Data
Flow records show who talks to whom, on which port and how much. That makes them the best source for spotting movement inside the network, where perimeter tools see nothing.
One internal host reaching many others over SMB (port 445) or RDP (port 3389), a common sign of lateral movement
Connection attempts across many ports from one source, the shape of a port scan
Large or steady outbound transfers to an address the organization has never used
Traffic to countries or autonomous systems where the business has no presence
Flow-based traffic analysis adds learned baselines for volume and protocols. For example, if a file server that usually sends a few gigabytes a night to the backup host starts sending far more to an unknown address, the change stands out even when it looks small on a company-wide graph.
Business risk: Ransomware spreading between servers, or data leaving the business unnoticed
3. Firewall, VPN and Perimeter Logs
Perimeter devices log what they allow as well as what they block, and the allowed side matters more during an attack.
Repeated denies from one source, followed by an allow from the same source
VPN logins from a new country, or from two locations too far apart in a short time
Admin logins to the firewall itself and every rule or policy change
Security features switched off, such as an IPS profile moved to monitor-only
Firewall log monitoring keeps these events readable when the network mixes firewall vendors.
Business risk: An exposed service or a compromised remote access account
4. Endpoints and Servers
Endpoint signals catch what the network never sees, such as a script that runs and finishes on one laptop.
New processes launched by Office applications or browsers, for example PowerShell started from a Word document
Antivirus detections, including Microsoft Defender event 1116 (malware detected), and real-time protection being turned off
Changes to critical files and folders: Web roots, startup folders, system binaries
New local administrator accounts and new services
An EDR (endpoint detection and response) agent covers this layer best; logs fill the gaps where an agent can't run.
Business risk: Ransomware encrypting file servers and halting operations
5. DNS and Web Traffic
Malware has to find its controller, and that lookup usually goes through DNS.
Queries to newly registered or rarely seen domains
Long, random-looking subdomains, a sign of data hidden inside DNS queries
A spike in failed lookups (NXDOMAIN) from one host, typical of malware cycling through generated domains
Clients that skip the internal resolver and query outside DNS servers directly
Business risk: Malware staying in contact with attackers through a channel few tools inspect
6. Cloud, SaaS and Application Activity
Cloud attacks often look like ordinary administration, so the audit trail tells you more than the traffic does.
Console or admin logins without multi-factor authentication
New access keys, new roles, or permissions widened to a wildcard
Storage buckets made public, security groups opened to 0.0.0.0/0, or a trail stopped in AWS CloudTrail
Mailbox rules that forward mail to an outside address, a frequent step in business email compromise
Web application logs with spikes in 401 and 403 responses or requests to admin paths
Business risk: Exposed customer data, invoice fraud and cloud bills inflated by hijacked resources
7. Network Device Configuration
An unauthorized change on a router or firewall can open a path that traffic logs will never flag as unusual. Configuration monitoring catches it at the source.
Differences between the running configuration and the approved baseline, known as configuration drift
Running and startup configurations that disagree, which means a change was made and never saved or reviewed
New local users, SNMP communities or management access rules on network devices
Business risk: A quiet change that opens a regulated network segment, followed by a failed audit
8. Vulnerability and Patch Exposure
Exposure data tells you which alerts deserve attention first. An exploit attempt against a patched server can wait; the same attempt against an unpatched, internet-facing one cannot.
Critical and actively exploited vulnerabilities on internet-facing systems
Patch age on servers and endpoints, measured against your own policy targets
New devices on the network with no owner and no scan history
Vulnerability management feeds this layer, and its results belong next to the alerts they help rank.
Business risk: A known, fixable flaw becoming the way in
What are the 7 Stages of a Cyber Attack, and What Can Monitoring See at Each?
The seven stages most often cited come from the Cyber Kill Chain model: Reconnaissance, weaponization, delivery, exploitation, installation, command and control, and actions on objectives. This means each stage you can see is a chance to stop the attack before the next one starts.
Mapping each stage to a signal shows where detection is thin. The MITRE ATT&CK framework covers the same ground in more detail, technique by technique.
Stage | What the attacker does | Signal monitoring can catch |
Reconnaissance | Scans ports and services, gathers staff email addresses | Port scans in flow data, bursts of firewall denies |
Weaponization | Builds the payload on its own infrastructure | Little inside your network; threat feeds may list the infrastructure |
Delivery | Sends a phishing email or a malicious link | Mail gateway detections, first visits to new domains |
Exploitation | Runs code through a flaw or a stolen login | Failed then successful logons, exploit signatures on the IPS |
Installation | Plants a backdoor or a way to persist | New services (7045), scheduled tasks (4698), new admin accounts |
Command and control | Calls home for instructions | Connections at regular intervals, DNS lookups to rare domains, known bad IPs |
Actions on objectives | Steals, encrypts or destroys data | Large outbound transfers, mass file changes, cleared audit logs (1102) |
The earlier the stage, the cheaper the response. Many monitoring programs see installation and later stages best, so adding flow and DNS visibility is often the quickest way to move detection earlier.
How Should You Respond When a Security Alert Fires?
Responding to a security alert means confirming it, scoping it, containing the threat, fixing the cause and recording what happened, in that order. Containment depends on knowing the scope, so acting before you scope can lock out the wrong account or leave the real entry point open.
NIST SP 800-61 Revision 3, finalized in April 2025, ties this work to the Detect, Respond and Recover functions of the NIST Cybersecurity Framework 2.0.
How to Triage a Security Alert in the First Few Minutes
The first minutes decide whether an alert becomes an incident, so work through five checks before you change anything:
Confirm: The raw log line or flow record behind the alert, read before anything else
Identify: The account involved, plus the asset's owner, business function and criticality
Check changes: Any planned change or new deployment that explains the alert
Scope: The same source IP, user or file hash, searched across other systems
Rate: A severity level from the table below
Once the checks are done, the condition behind the alert usually points to the first action:
If this condition holds | Check this first | Then act |
Failed logons keep rising after a lockout | Internal or external source | Block the source, reset the account |
An admin logs on from a new country | Travel or a known VPN | End the session, reset credentials |
A host sends large volumes to an unknown address | Who owns the destination | Block it, isolate the host |
The security audit log is cleared | Who held admin rights then | Treat as Critical, isolate the server |
Firewall running and startup configs differ | An approved change ticket | Restore the approved config if none exists |
How to Match the Response to Alert Severity
A severity scheme tells everyone how fast to move and whom to involve, so keep it short enough to apply overnight without a manual.
Severity | Example signal | First action | Who gets involved |
Critical | Audit log cleared on a domain controller | Isolate the host, open a major incident | Security lead, IT operations, management |
Major | A successful logon after many failures | Disable the account, review its activity | Security analyst, system owner |
Warning | A port scan from the internet | Confirm the block held, watch for follow-up | On-call engineer |
Example: Responding to a Brute-Force Alert on a File Server
Say a file server in the finance subnet logs 60 failed logons (event 4625) for the svc-backup account in ten minutes, all from one warehouse workstation. Then one logon succeeds.
Naming an owner for every step before an incident is what keeps a response fast. The swimlane below tracks this hypothetical case from the first alert to the closed ticket, with each step placed in its owner's row.
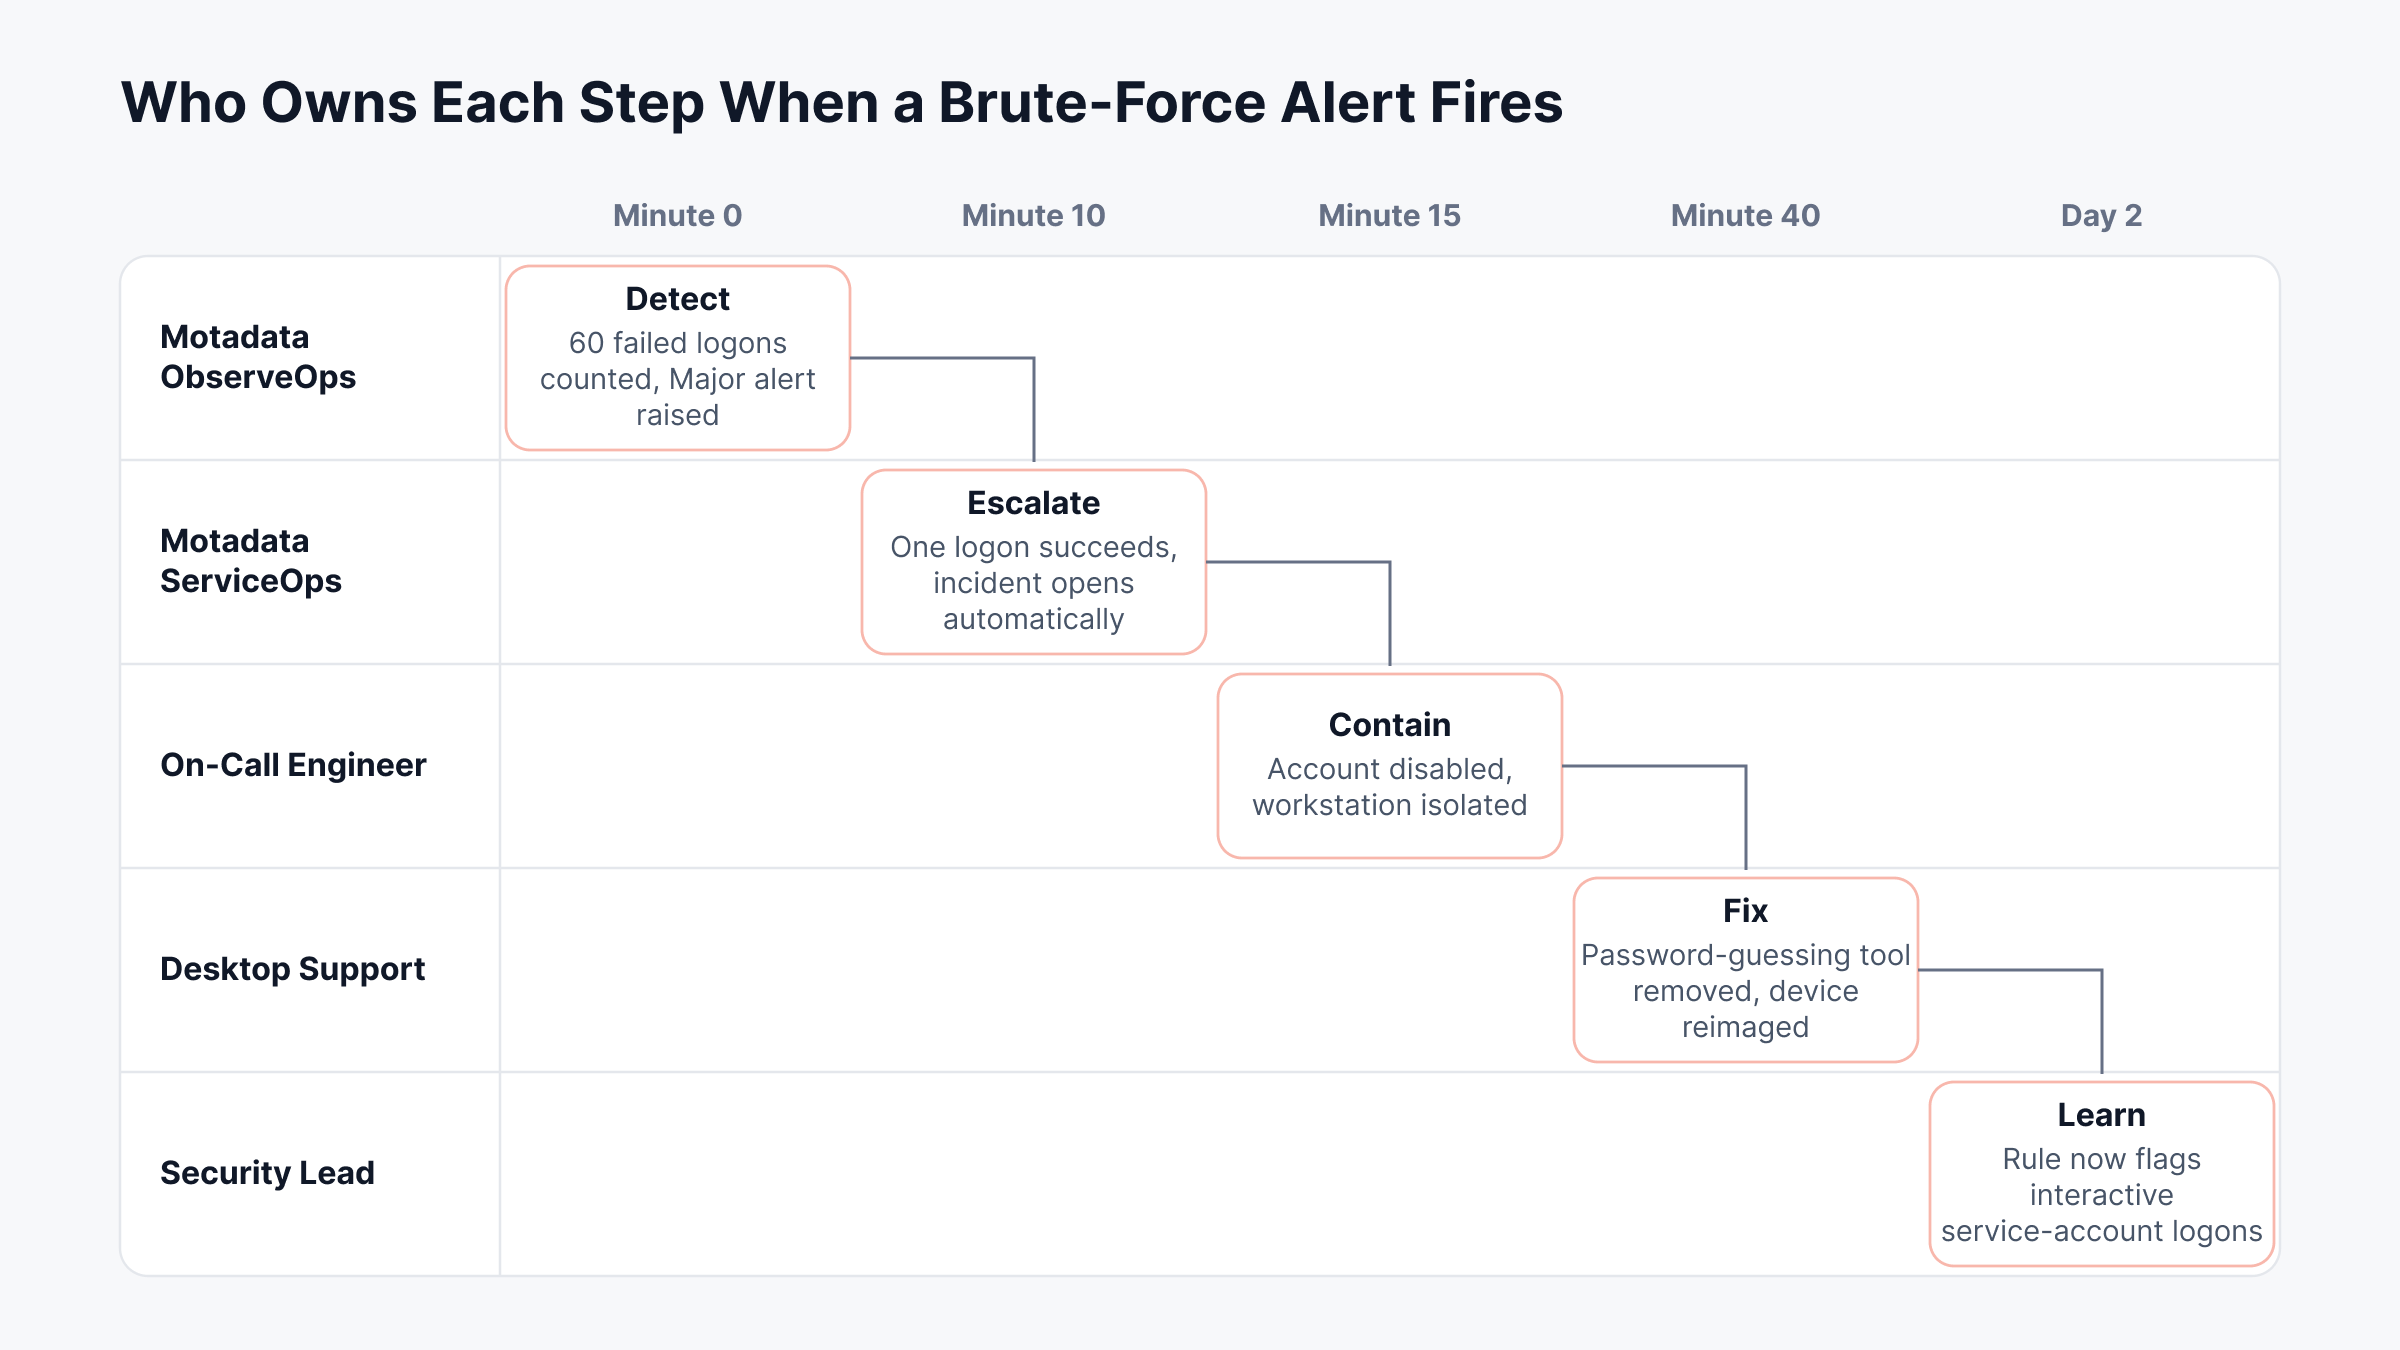
Two things keep this response short: The alert arrives with account, source and asset attached, and every step has a named owner before the incident starts.
How to Close the Loop After a Security Incident
Every incident should change something: A rule, a threshold, a baseline or a runbook. That review is where false positives drop and detection improves.
Record the root cause and timeline in the incident ticket
Tune the rule that would have caught it earlier
Automate the first containment step if it repeats, through a runbook or a SOAR platform
What Types of Cyber Security Monitoring Tools Do You Need?
Cyber security monitoring tools fall into a few categories, and most organizations combine several of them, each covering a different layer. Each reads a different data source, so one category alone typically leaves blind spots.
Tool category | What it watches | Best at |
SIEM | Security logs from many sources | Correlation, compliance reporting |
Log analyzer and log management | All logs, security and operational | Search, parsing, pattern detection |
Flow analytics and NDR | Flow records and traffic | Lateral movement, scans, exfiltration |
EDR and XDR | Processes, files and behavior on endpoints | Malware, ransomware, local persistence |
IDS and IPS | Packets at key points in the network | Known exploit signatures, blocking in line |
Vulnerability scanner | Missing patches and misconfigurations | Exposure and prioritization |
SOAR | Alerts from the other tools | Repeatable, automated response steps |
ITSM | Incidents and changes | Ownership, approvals, history |
When people ask "what are the top 5 monitoring tools?", a category list like this is the useful answer, since the right security monitoring tools depend on the environment.
How to Choose Cyber Security Monitoring Software
Before comparing cyber security monitoring solutions, answer these questions about your own environment:
Can an alert open a ticket on its own?
Can low-value logs be dropped before storage?
Can operations and security staff share one view?
What will it cost in licenses, storage and staff time over three years?
When Do Cyber Security Monitoring Services Make Sense?
Cyber security monitoring services, such as managed detection and response or an outsourced security operations center, suit organizations that need around-the-clock coverage without hiring for every shift.
The trade-off is context, since the change calendar and system owners stay in house, so many organizations keep tools in house and buy overnight coverage.
Which Metrics Show That Security Monitoring is Working?
The metrics that show security monitoring is working are detection speed, response speed, alert quality and log source coverage. Without them, a program can raise thousands of alerts and still not show leadership whether risk is falling.
Mean time to detect: First malicious activity to first alert, also called MTTD
Mean time to respond: Alert to containment, tracked separately for each severity
False positive rate: Share of alerts closed as benign; a rising rate means rules need tuning
Log source coverage: Share of critical assets sending logs
Alerts per analyst per shift: An early warning of fatigue
For leadership, faster detection means less breach exposure, and fewer false alarms mean fewer paid hours spent on noise.
What Makes Cyber Security Monitoring Hard, and How Do You Fix It?
The hardest parts of cyber security monitoring are alert volume, data cost, blind spots, staffing and privacy rules, and each one has a practical fix. Most of these problems grow with the environment, especially once cloud accounts and branch offices join it.
Alert fatigue: Attach asset owner and criticality to each rule
Log volume and storage cost: Drop noisy logs before storage, keep security logs in full
Blind spots in hybrid environments: Track log source coverage as a metric
Skills shortage: Automate first containment steps and buy overnight coverage
Privacy and compliance limits: Agree notice and retention rules with legal before rollout
What are the Best Practices for Continuous Security Monitoring?
The best practices for continuous security monitoring come down to five habits. Each targets a common reason detections fail:
Start with the most sensitive systems: Customer data, payment data and admin credentials first
Tune every week: The ten noisiest rules reviewed, with asset context added before any rule is muted
Correlate across sources: Events that mean little alone, joined through log correlation
Protect the logs: Copies forwarded off the source host as they are written, and log retention set per regulation
Test the coverage: Simulated attacks, such as purple-team exercises, to confirm each expected alert reaches the right owner
How Does Motadata ObserveOps Support Cyber Security Monitoring?
Motadata ObserveOps supports cyber security monitoring by bringing logs, flow data, configuration changes and alerts into one observability platform, then sending each alert into a defined response. This means an analyst can check logs, flows and configuration history where the alert was raised.
Because ObserveOps is built for observability, security signals arrive next to the performance data that explains them. For example, a burst of failed logons reads differently when the same server is also running out of memory, since a failing service may be the cause.
Collect and Search Security Logs in ObserveOps
We built log management in ObserveOps so that logs can be collected remotely, without an agent on the end device, and parsed with Regex, JSON, Delimiter or Custom Plugin parsers. For Windows, our Windows Logs reference lists the minimum event IDs to forward for each of 28 server roles, from Active Directory Domain Services to Remote Desktop Services. The Log Pipeline then controls what is kept:
Exclusion rules: Noisy logs dropped before storage, still counted in metrics
Indexes: A retention period for each class of log
Log Forwarding: A copy sent elsewhere over TCP or UDP
Log Pattern groups messages into templates by replacing variable parts with typed tokens such as IP, EMAIL and URL, then shows the spread of values behind each token. A high count on a "Failed password" pattern, concentrated on a few IP values, is a brute-force attempt visible at a glance, and our log intelligence applies the same pattern detection across sources.
Detect Threats with Log, Flow and Configuration Policies
Detection runs through policies, which you create under Settings > Policy Settings, each with Critical, Major and Warning severities:
Log Policy: Counts matching log messages in Real Time or on a schedule (Once, Daily, Weekly or Monthly), for example messages containing sudo, su or root
Flow Policy: Alerts on flow counters per source host or group, with default policies for ICMP Flood Attack and Malicious Activity with Black IP (Threat Feed Integration)
Network Config Policy: A Config Conflict alert when running, startup and baseline configurations differ
Anomaly Policy: A baseline per metric, learned from at least 8 hours of polling data and evaluated every 15 minutes
Flow Analytics maps each address to its geolocation and AS Details, which answers the first question about odd traffic: "Who is this, and why are we talking to it?" Our docs include flow export guides for NetFlow, sFlow, IPFIX, jFlow and NetStream devices, Cisco ASA and FortiGate firewalls among them.
Investigate Security Alerts with Correlated Context
When a metric alert fires, the Correlation button opens four tabs for the same monitor and time window: Correlated Metrics, Correlated Logs, Correlated Alerts and Log Pattern.
Respond Through Runbooks and ServiceOps Incidents
Every policy can act on its own alert. Here is how one log alert moves from detection to a ServiceOps ticket, in five steps:
Evaluate: The Log Policy checks logs in Real Time and raises an alert at the severity you set
Notify: The alert reaches the users, email addresses or Teams and Slack handles in the To field
Take Action: A runbook (SSH, PowerShell, HTTP and others) runs at once, for example to disable an account
Declare Incident: An integration profile opens a ServiceOps incident, with urgency mapped from the alert severity
Suppress Action: Repeats are held for the Suppress Window, so one event pages someone once
On the ServiceOps side, incident management tracks ownership through to resolution. Its vulnerability management (Windows endpoints) and patch management (Windows, macOS and Linux) then fix the exposure that monitoring keeps surfacing.
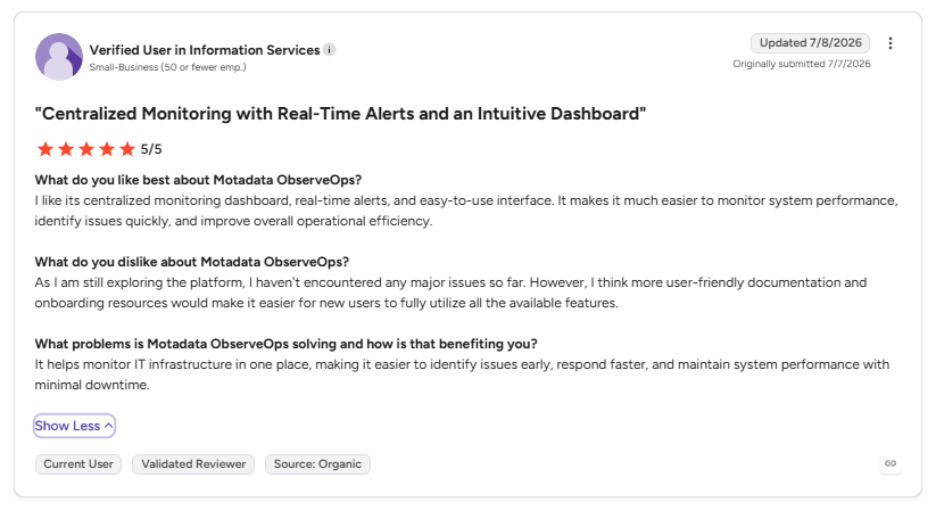
This is what one user says about Motadata ObserveOps on G2:
Bring Security Logs, Flows and Alerts into One Observability Platform with Motadata ObserveOps
Most security monitoring stalls between tools: The firewall sees the scan, the server logs the failed logons, and no single view connects them to an owner. ObserveOps puts those signals in one place, ties each to a policy and sends confirmed alerts to a runbook or a ServiceOps incident.
One caveat applies to every product in this category: Monitoring finds threats early, and stopping them still depends on endpoint protection, patching and a tested response plan. A practical first step needs no new tool:
Pick your three most sensitive systems
List the events from this guide that apply to them
Confirm each event reaches a named owner
FAQs
What are the 7 types of cyber security?
Common lists name network security, application security, cloud security, endpoint security, identity and access management, data security and operational security, though groupings vary by source. Monitoring touches all seven, since each layer produces logs or events that show when its controls fail.
Is cyber security monitoring legal?
Monitoring systems and networks that an organization owns is legal, and regulations such as PCI DSS and HIPAA often require it. Monitoring employee activity can carry notice and privacy obligations that vary by country and state, so check with legal counsel before collecting user-level data.
What is the difference between cyber security monitoring and a SOC?
Cyber security monitoring is the activity of collecting data, detecting threats and raising alerts. A security operations center is the function, made up of people, processes and tools, that performs that monitoring and leads the response, either in house or through a managed provider.
Can a small IT department run continuous security monitoring?
Yes, if it starts with a narrow scope: The most sensitive systems, a short list of high-value events and alerts routed to a named owner. Platforms such as Motadata ObserveOps help by keeping logs, flows and alerts in one console, which cuts the number of screens a small department has to watch.
How long should security logs be kept?
Retention depends on regulation and risk. PCI DSS requires at least 12 months of audit log history, with the most recent three months immediately available, and many organizations keep a year or more for investigations. In Motadata ObserveOps, separate log indexes can hold different retention periods for security and operational logs.
Author
Poonam Lalani
Content Strategist
Poonam Lalani is a B2B content strategist and writer with a background in computer engineering and experience across enterprise technology domains, including AI, cloud, DevOps, data engineering, and IT operations. She specializes in creating research-driven content that simplifies complex ideas and supports product education, thought leadership, and business growth.