Database Observability: What It Is and How It Differs From Monitoring
Why does a checkout request take eight seconds when the database server shows normal CPU, free connections and no alerts? It's a familiar incident call: The application side suspects the database, the DBA shares healthy graphs, and the slowdown keeps costing orders while both sides argue.
Database observability is how that call ends quickly. It links what the engine is doing (waits, locks, plans, sessions) to the application requests that created the work, so a slowdown arrives with its cause attached.
Classic database monitoring still matters, because it tells you when a known limit is crossed, and observability picks up from there by explaining why. In this blog, you will see:
The definition: What database observability means and how it differs from monitoring
The signals: Queries, waits, locks, plans, traces and change events
The workflow: How the pieces connect, including in database DevOps
The practice: Three troubleshooting scenarios, a tool checklist and rollout advice
What is Database Observability?
Database observability is the practice of explaining database behavior by connecting engine-level evidence, such as queries, wait events, locks and execution plans, to the application requests that created the load. This matters because most slow requests cross both the application and the database, so evidence from only one side leaves the cause open to debate.
Monitoring watches limits you defined in advance. Observability lets you ask a question you never planned for, like "why did this one endpoint slow down after the release?", and answer it from data you already collect. In practice, that means questions like these:
"Which service sent the query that's holding this lock?"
"Why did this statement move from an index seek to a full table scan?"
"Is the request slow inside the database, or still waiting for a connection?"
"What changed between yesterday's fast run and today's slow one?"
Each of those questions crosses the line between the application and the engine, and that line is where most incident time goes.
How is Database Observability Different from Database Monitoring?
Database observability differs from database monitoring in the question it answers. Monitoring reports whether the database is healthy against known thresholds; observability explains why a specific request or query behaved the way it did. That difference decides how long an incident lasts, because a threshold alert says where to look while correlated evidence says what to fix.
Dimension | Database monitoring | Database observability |
Core question | "Is the database up and within limits?" | "Why is this request slow, and what caused it?" |
Unit of analysis | The server or instance | The query, the session and the request behind it |
Typical data | CPU, memory, storage, connections, uptime | Query statistics, wait events, lock chains, plans, database spans |
Alerting | Static thresholds on known metrics | Baselines and anomalies, with linked evidence to investigate |
Application context | Usually none | Service, endpoint and trace ID on each query |
Change awareness | Drift found after the fact | Releases, migrations and plan changes lined up with latency |
Main users | DBAs and infrastructure operators | DBAs, developers, SREs and incident leads together |
Strongest at | Catching known failure modes early | Explaining new, intermittent or cross-tier problems |
You need both, because monitoring gives early warning on failure modes you already know and observability shortens the path from that warning to a cause. Our guide to observability vs monitoring covers the wider distinction across the stack.
What Signals does Database Observability Use?
Database observability uses six kinds of signals: Query statistics, wait events, locks, execution plans, database spans in application traces, and logs or change events. Each one answers a different part of "why," and how each is exposed varies across database models.
1. Query Statistics and Samples
Query statistics group every execution of the same statement shape, with literal values stripped out, into one fingerprint. For example, a lookup run for 10,000 different customer IDs counts as one fingerprint, with total time, calls, rows and errors tracked per database query. The engines expose this natively, for example pg_stat_statements in PostgreSQL, Query Store in SQL Server and Performance Schema in MySQL.
Samples add individual executions with their own timing, which is how you find the one slow outlier that an average across thousands of calls hides.
2. Wait Events
A wait event records what a session is waiting on, such as a row lock, a disk read, a latch or the client fetching results. For example, average CPU can look calm at 30% while forty sessions queue on one row, and only the wait data shows that queue.
3. Locks and Blocking Chains
Lock data shows which session holds a resource and which sessions are stuck behind it. The useful part is the chain itself:
Blocking session: Its query, user, program and how long it has run
Blocked sessions: Their queries and wait time so far
Lock detail: Resource type and lock mode on each side
If one long report holds a lock on a busy table, twenty checkout sessions can stall behind it, and without the chain the only visible symptom is "slow."
4. Execution Plans
An execution plan is the route the optimizer picks through tables and indexes. Plans change when statistics refresh, data grows or a release alters a predicate. A changed plan is one of the most common reasons a 40 ms query starts taking two seconds, and SQL tuning usually starts by comparing the old plan with the new one.
5. Database Spans in Application Traces
A database span is the part of an application trace that covers one call to the database. It carries the statement, the target database, the operation and the duration. This is the signal that ties a slow endpoint to a specific query, and it comes from distributed tracing across your services.
6. Logs and Change Events
Slow-query logs, error logs and deadlock reports belong here. So do schema migrations, configuration changes and deploy markers, whose timestamps answer "what changed?" once they are lined up against latency.
How does Database Query Monitoring Fit into Database Observability?
Database query monitoring is the query-level layer of database observability. It tracks how often each statement runs, how long it takes and how much data it reads, so the most expensive queries are visible at a glance.
On its own, it answers "which queries cost the most?" It can't tell you which user action sent them, or whether the time went to working or waiting. Here's what query data contributes once it's linked to traces and wait events:
Top queries by total time: The usual starting point for tuning
Execution count per fingerprint: A sudden jump often means an N+1 pattern in code
Rows read against rows returned: A wide gap hints at a missing index
Latency against its own baseline: Catches a plan change before users report it
Trace context on each query: Names the service and endpoint that pay the cost
Once the expensive query is found, the fix is a tuning job. Our glossary on database performance tuning covers the techniques.
How does Database Observability Work, Step by Step?
Database observability works by collecting telemetry on both sides of the database connection, tagging it with shared context, and correlating it on one timeline. The six steps in this database observability guide apply to most stacks.
Instrument the application: OpenTelemetry SDKs or auto-instrumentation agents record a span for every database call
Collect engine-side data: Waits, locks, sessions, top queries and plans from the database's own views
Add shared context: Service name, host and database name, plus the trace ID in a SQL comment where the driver allows it
Sanitize before storing: Literals replaced with placeholders, so customer data stays out of telemetry
Baseline normal behavior: Per-query latency and per-service call counts, by hour of day
Correlate on one timeline: Trace, query, wait, host metric and deploy marker for the same minutes
The OpenTelemetry conventions define the attributes most tools now expect on a database span:
Attribute | What it records | Why it helps |
db.system.name | The engine, such as postgresql or mssql | Routes the span to the right views and parsers |
db.namespace | Database or schema name | Separates environments and tenants |
db.operation.name | SELECT, INSERT, UPDATE or DELETE | Splits reads from writes |
db.collection.name | The table or collection | Shows which object is under pressure |
db.query.text | The statement, with literals sanitized | Matches the span to a query fingerprint |
db.query.summary | A short, low-cardinality summary | Keeps span names readable on dashboards |
server.address | The database host | Links the span to host metrics |
Note that the conventions say non-parameterized query text shouldn't be captured by default unless it's sanitized. Parameter values are opt-in because they can hold personal data, so check your collector settings before you switch them on.
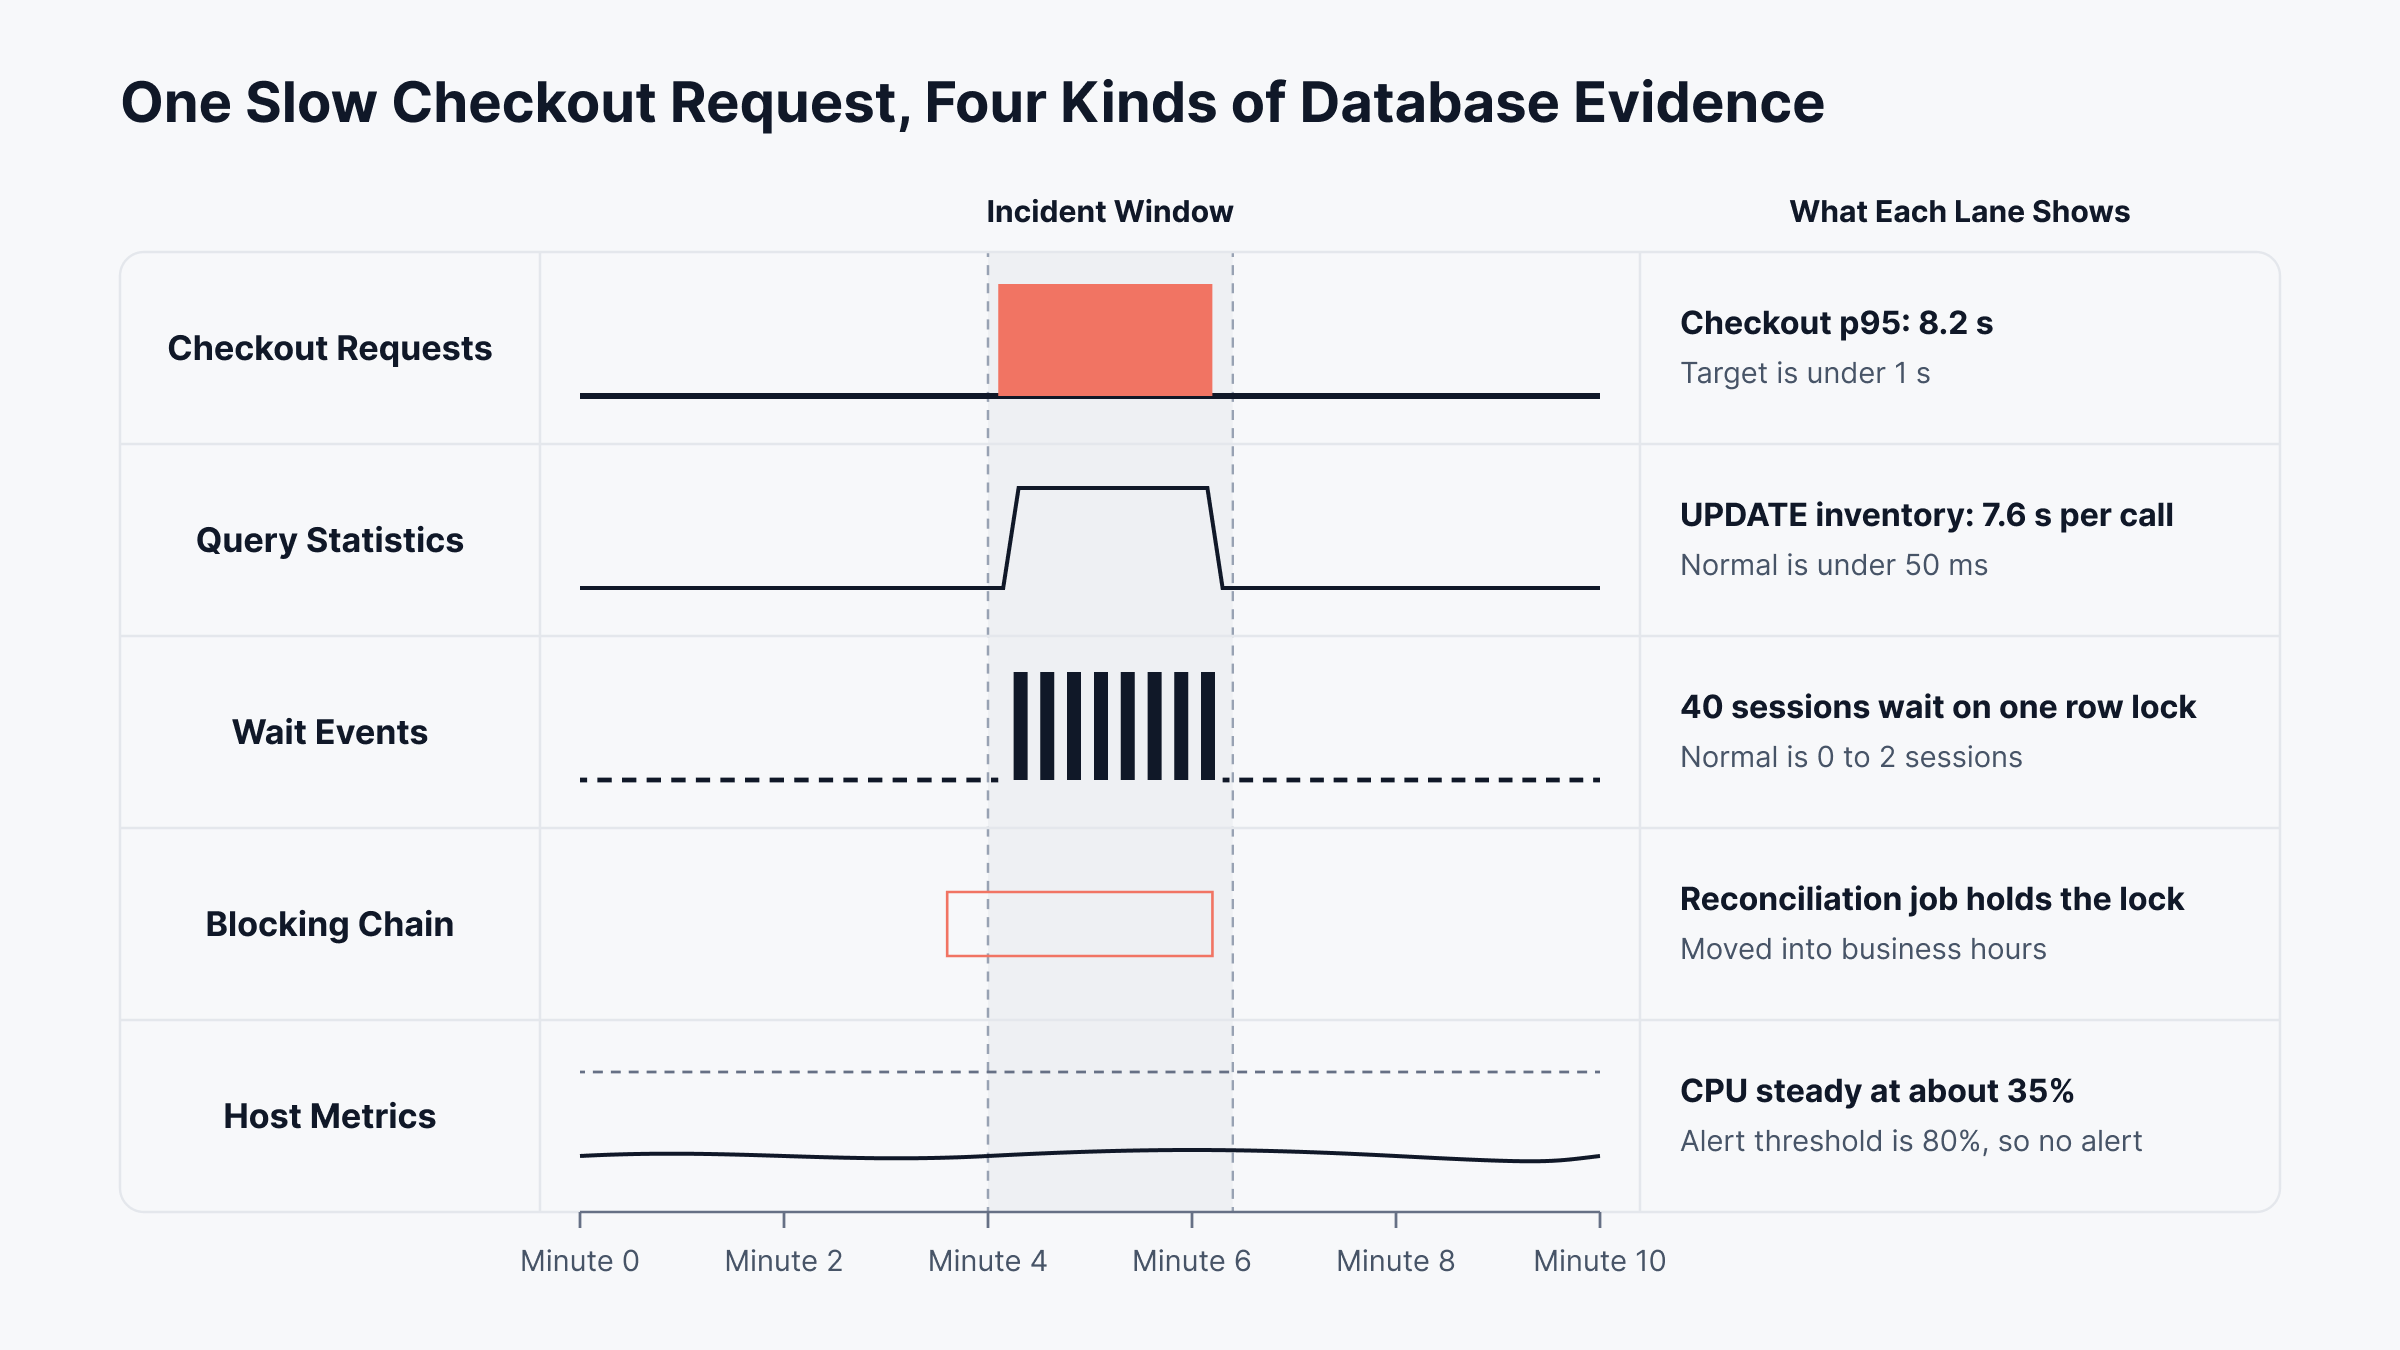
Start every investigation from the request, then move outward to the engine and the host. Four kinds of evidence hang off a single trace ID, as laid out below.
What do Database Observability Scenarios Look Like in Practice?
Database observability scenarios show the same pattern: Monitoring confirms something is wrong, and correlated evidence names the cause. The three below are hypothetical, but each follows a pattern that shows up across production systems.
1. A Slow Checkout with Healthy Database Dashboards
A retailer runs a weekend promotion. Checkout p95 latency climbs from under a second to eight seconds, and support tickets start arriving.
What monitoring shows: CPU at 35%, connections within limits, no threshold alerts
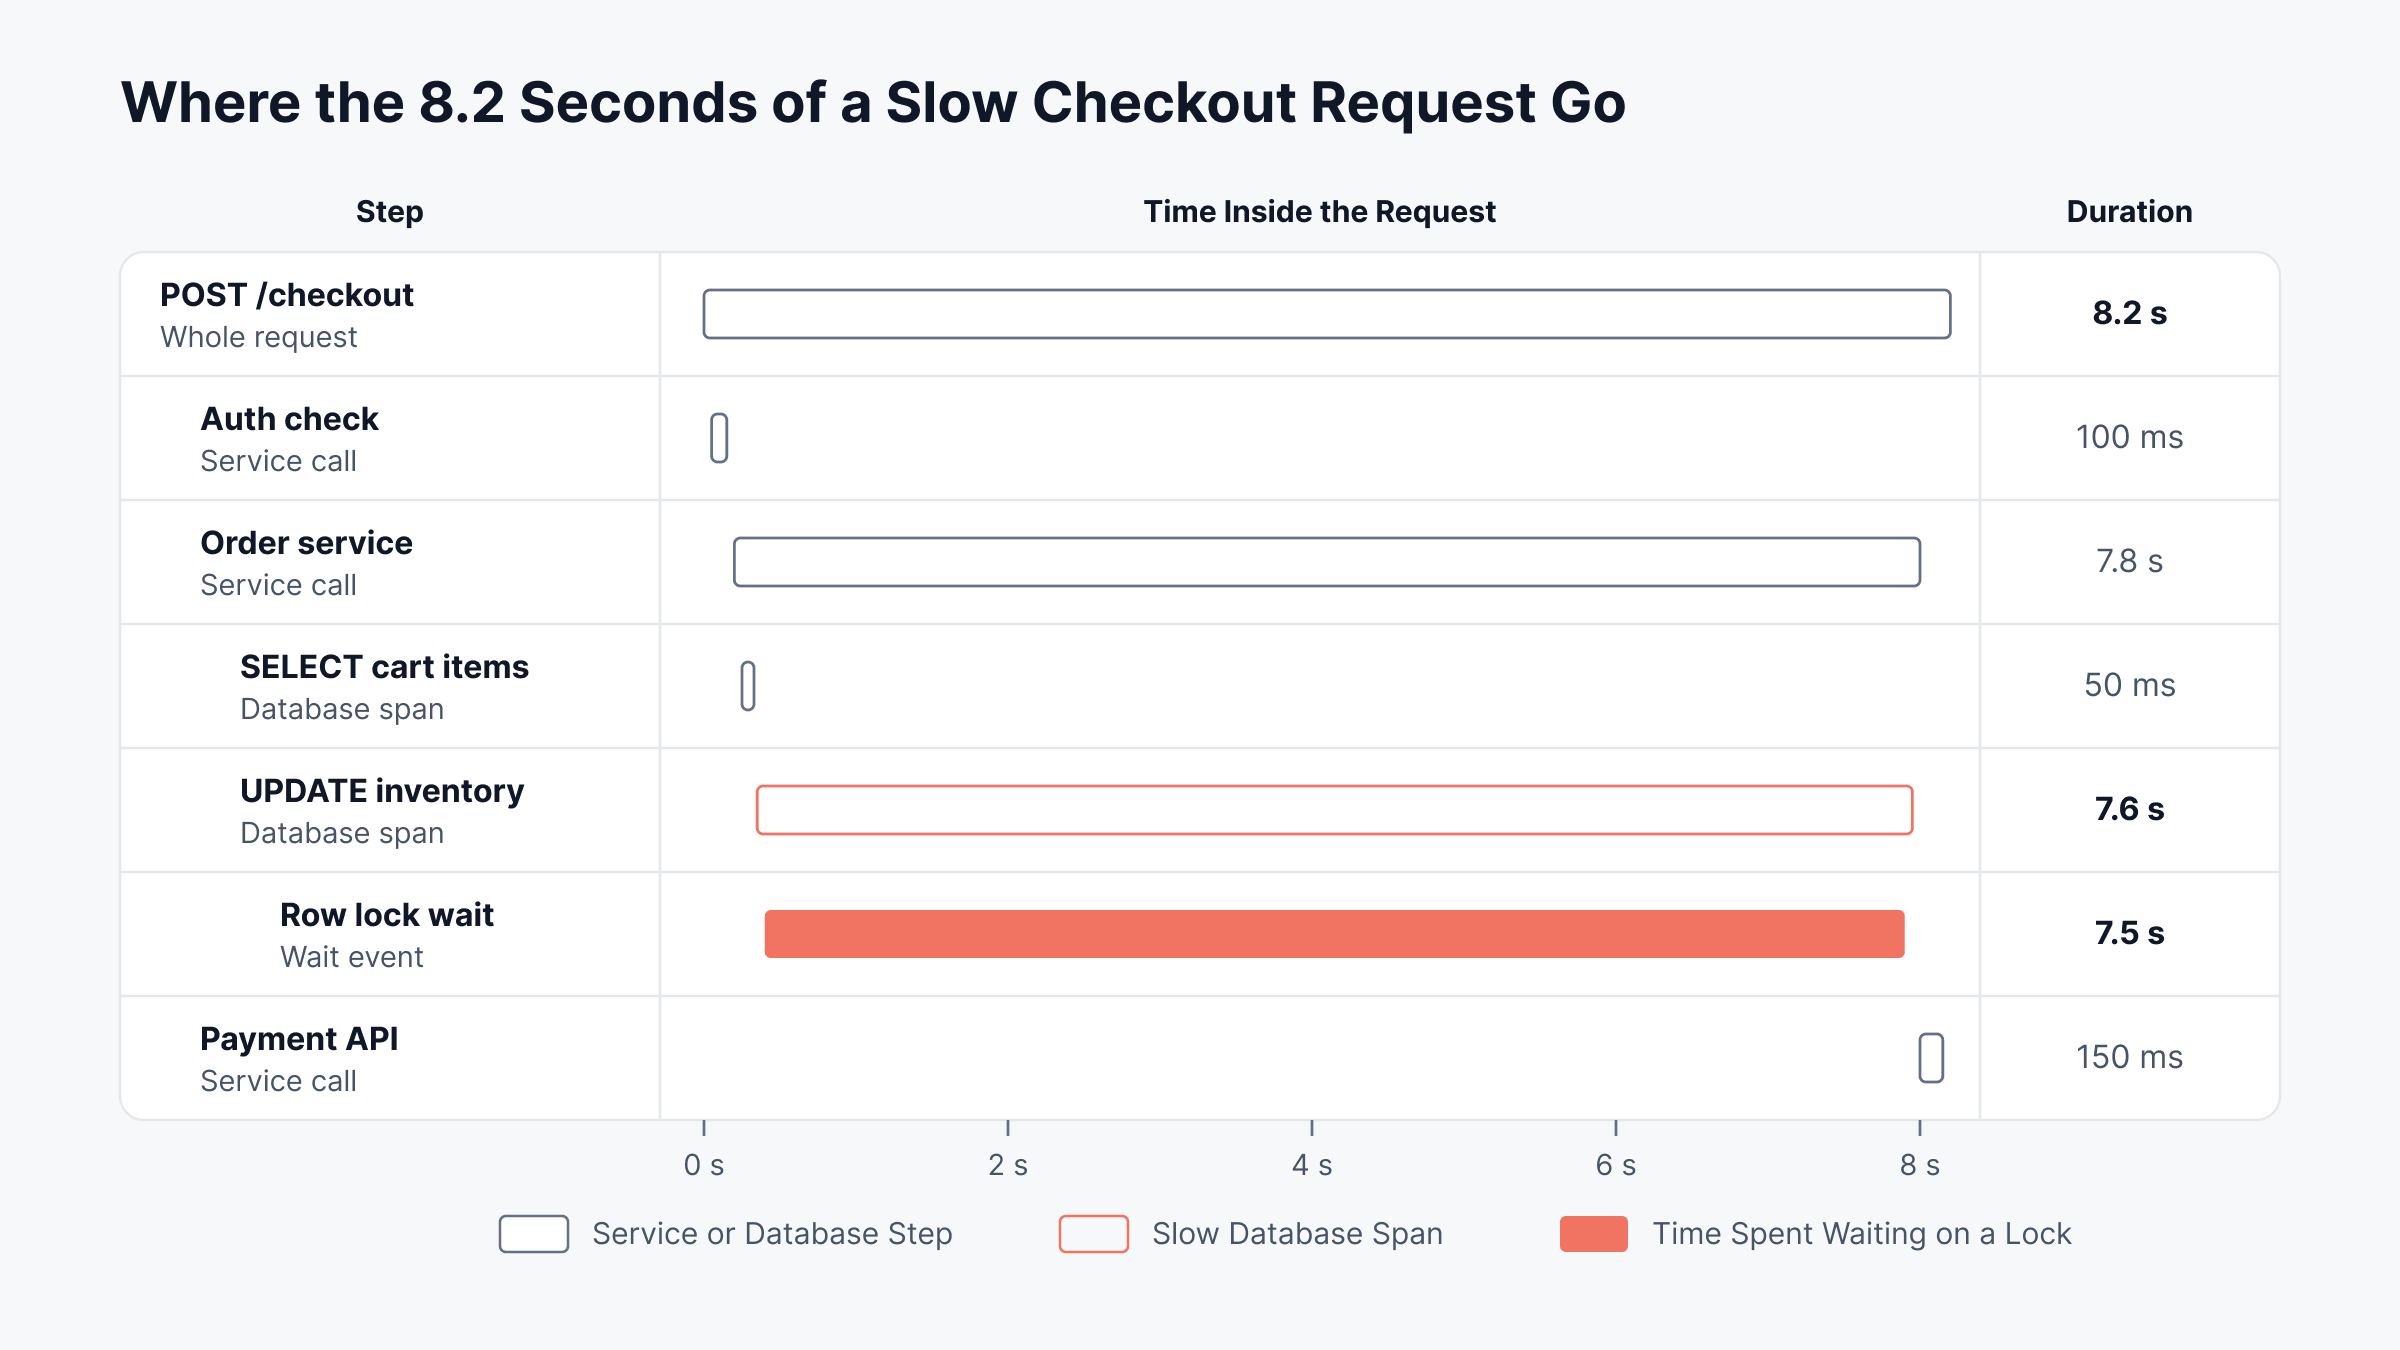
What the trace shows: 7.6 seconds of an 8.2-second request spent inside one UPDATE on the inventory table
What wait and lock data show: A row lock wait, with the blocking session traced to a stock reconciliation job moved into business hours
The fix: Reschedule the job and cut its batch size so each transaction holds locks briefly
Trace a slow endpoint layer by layer before anyone adds hardware. Here's where the eight seconds in this checkout scenario go:
2. A Release That Changes a Query Plan
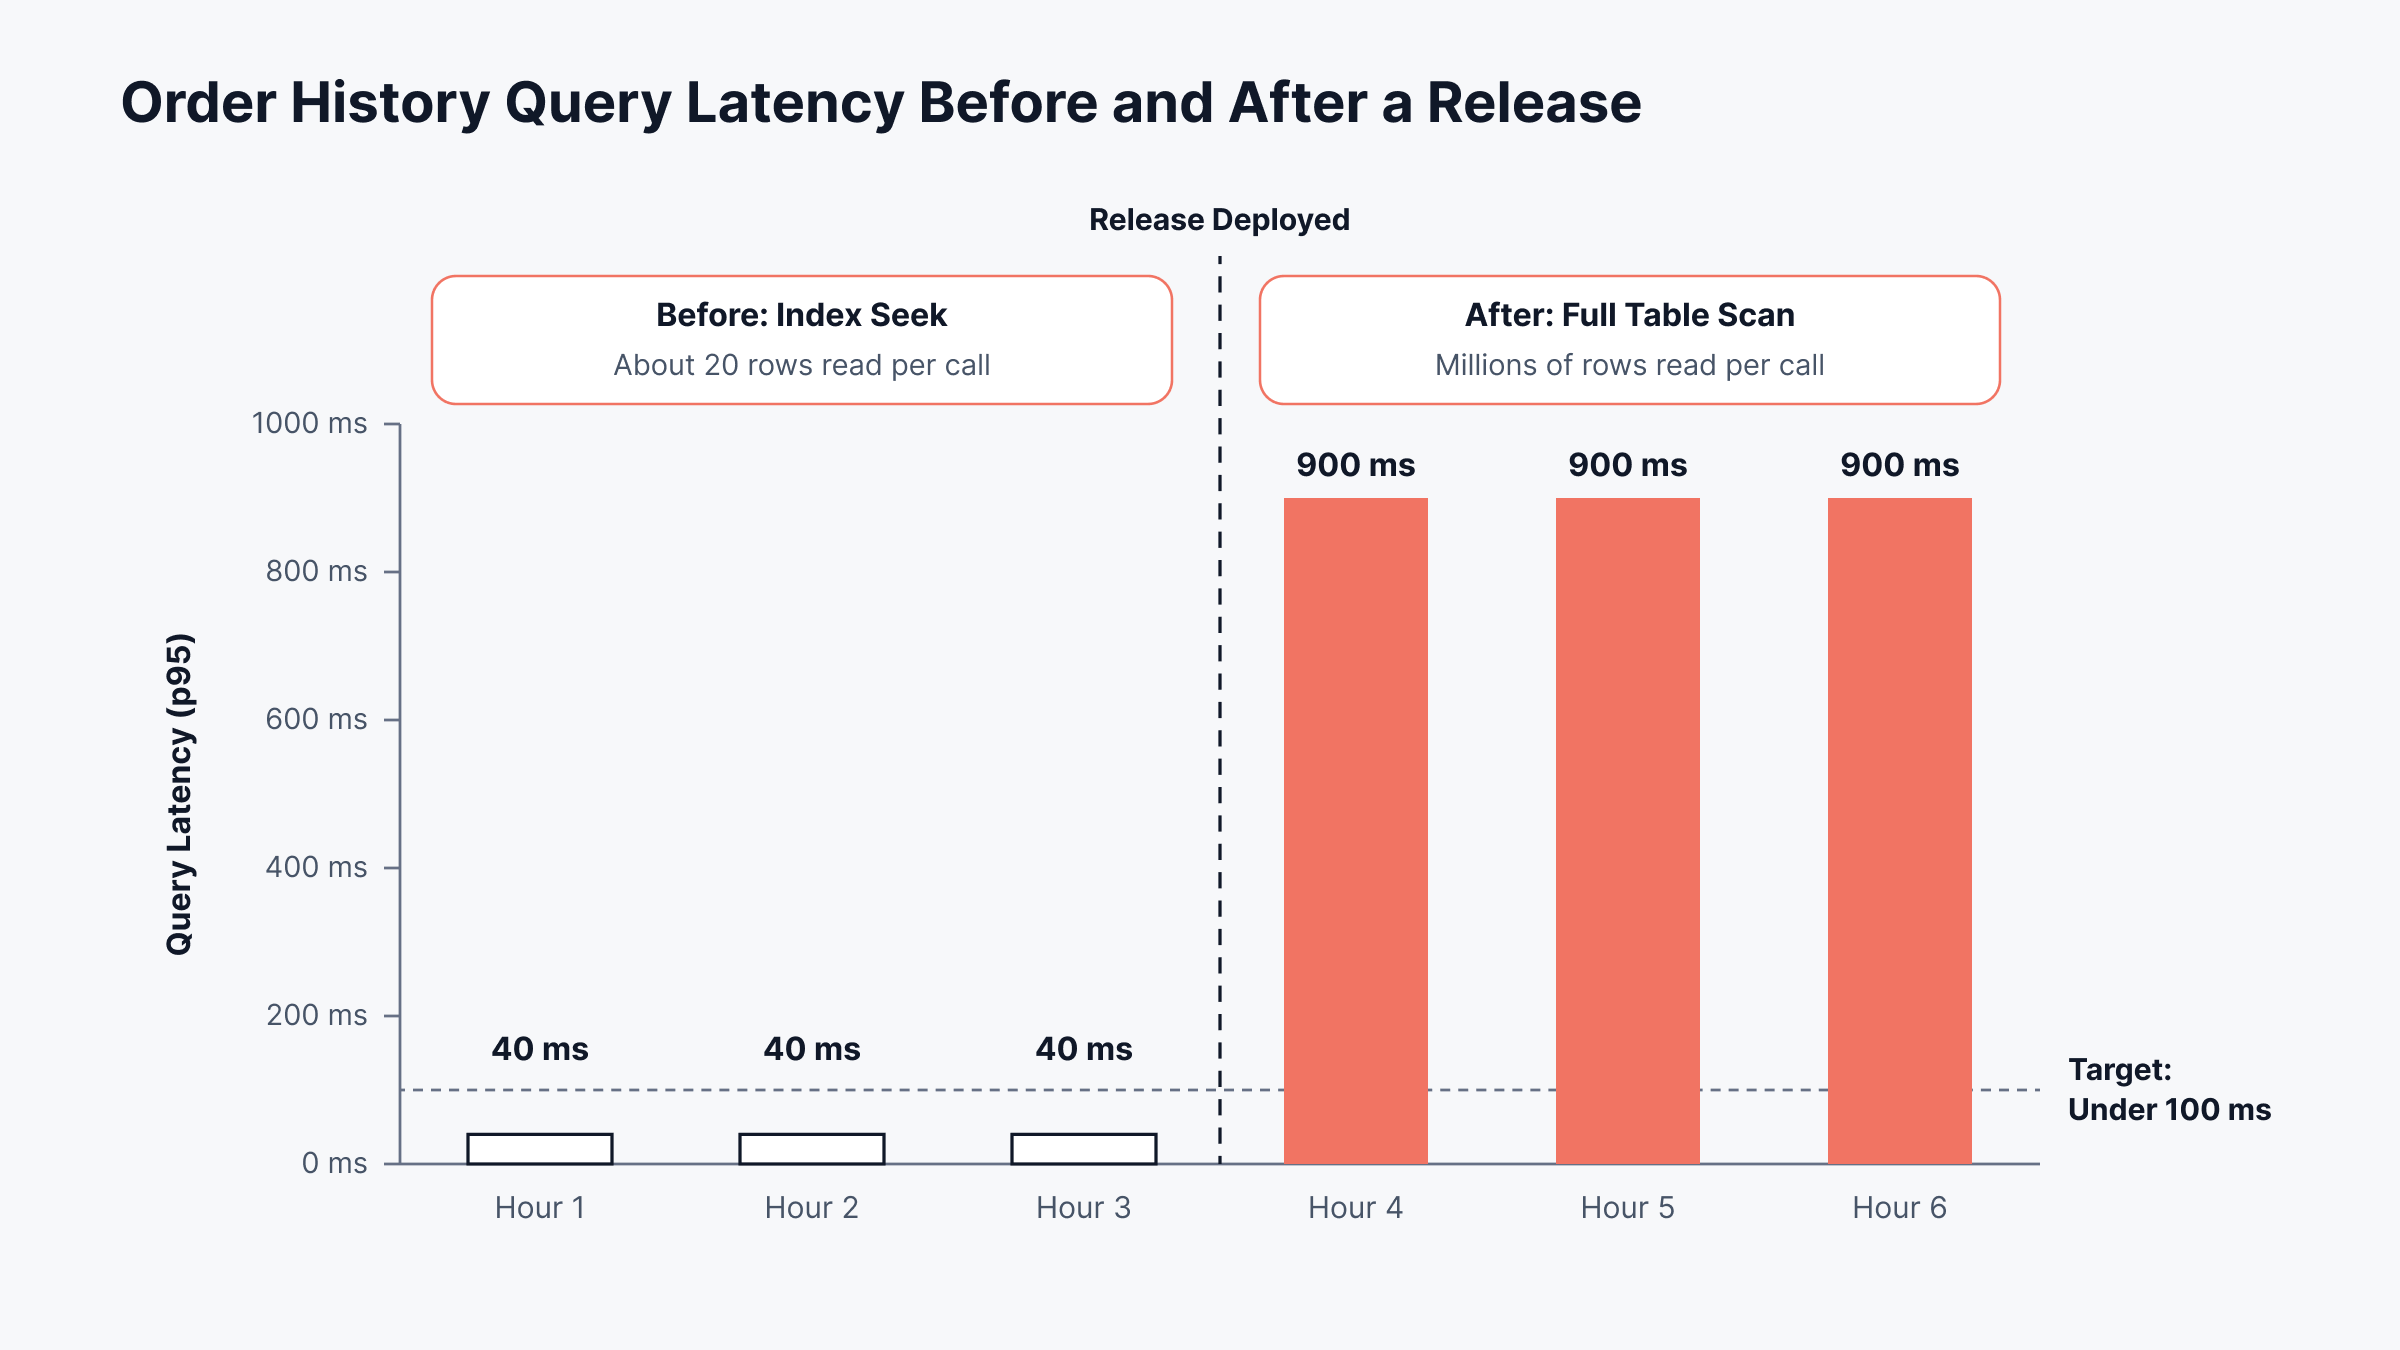
A new release adds a date filter to the order history page. The ORM wraps an indexed column in a function, and the optimizer switches from an index seek to a full scan. Latency on that page goes from 40 ms to 900 ms.
What monitoring shows: Disk reads up, CPU slightly up, perhaps an I/O alert
What observability shows: The deploy marker lines up with the jump; the same query fingerprint now reads millions of rows per call to return twenty
The fix: Rewrite the predicate so the index applies, then add a plan check to the CI pipeline
3. A Connection Pool That Runs Dry
The application logs timeouts, yet the database shows only a handful of active queries. The trace explains the gap: Each request waits seconds before its first database span even starts.
What monitoring shows: Low database load, moderate application CPU
What observability shows: One endpoint now issues 300 small SELECTs per request after a lazy-loading change, holding pool connections for the whole loop
The fix: Batch the query into one call and size the pool against measured concurrency
In all three cases the database dashboards look acceptable, and the cause only appears when application and engine evidence share a timeline. The same signals repeat across most incidents, so it helps to agree in advance on what each one usually means:
If you see this | It usually points to | Check this first |
Query latency rises while host CPU stays flat | Lock or wait contention | The blocking chain and its oldest session |
Rows read per call jumps right after a release | An execution plan change | The deploy marker and the old and new plans |
Time before the first database span grows | Connection pool exhaustion | Pool size and queries issued per request |
Executions per request rise sharply | An N+1 query pattern in code | The endpoint that issues the calls |
Deadlocks per second climb | Transactions updating rows in conflicting order | Recent changes to transaction logic |
What is Observability in Database DevOps?
Observability in database DevOps means treating schema changes, migrations and query changes as tracked events in the delivery pipeline, so the effect of each release on the database is visible within minutes of deployment.
Databases are often the slowest part of a system to change and the hardest to roll back. A migration that locks a large table or a query that loses its index can undo an otherwise clean release. Database devops observability makes those effects measurable, and database observability devops tools should give you:
Deploy markers: On every query latency chart, so a regression lines up with its release
Migration events: Start time, duration and the locks each migration took
Pre-merge plan checks: EXPLAIN output for changed queries, run against production-sized data in CI
Per-release query comparison: New fingerprints, retired ones and regressed ones
Rollback evidence: A before-and-after view that justifies reverting quickly
That's what observability devops for database work looks like day to day. The same release view applies at the application layer, as our guide to application observability explains.
Put a deploy marker on every query latency chart so a regression is obvious within minutes. Scenario two's plan change looks like this before and after the release:
How is Database Observability Different from Data Observability?
Database observability watches the engine and the workload; data observability watches the data itself, checking whether it is fresh, complete and trustworthy for the people who use it.
The two get confused because both carry the word "observability," and a question like "what is observability in database management?" can mean either one. A pipeline can deliver stale data from a healthy database, and a fresh table can still be stuck behind a lock queue. Data observability is commonly described through five pillars:
Freshness: How recently the data was updated
Volume: Whether row counts match what's expected
Schema: Whether structure changed unexpectedly
Distribution: Whether values fall in their usual ranges
Lineage: Where the data came from and what depends on it
Most organizations need both, since one protects application performance and the other protects analytics and reporting.
Why does Database Observability Matter to the Business?
Database observability matters to the business because the database is in the path of almost every revenue transaction. Every minute spent finding a database cause adds to the cost of an outage.
That cost is rising. According to Uptime Institute's Annual Outage Analysis 2026, 57% of survey respondents said their most recent major outage cost more than $100,000; one in five put it above $1 million. Faster database answers pay back in four places:
Shorter incidents: Fewer people on the bridge, less debate over which tier is at fault
Safer releases: Regressions caught in the first minutes of a rollout
Better spending decisions: A query fix before a hardware upgrade
Credible service levels: Database latency measured against what customers feel, alongside availability monitoring
What Should You Look for in Database Observability Tools?
Database observability tools should connect application traces to engine-level evidence in a few clicks, cover every engine you run and keep sensitive data out of telemetry. A good shortlist starts with these questions to ask each vendor:
"How is the platform licensed, and will the cost grow with every new database or host?"
"Can I click from a slow endpoint to the exact query and its wait events?"
"Which engines do you cover, and is lock and wait data available for each one?"
"Do you accept OpenTelemetry traces, or do I need a proprietary agent per language?"
"How do you sanitize query text and remove sensitive attributes?"
"Can I see deploy markers and schema changes on the same timeline as latency?"
"What does collection cost the database in CPU and connections?"
Answers to the last two separate observability tools in database devops from classic dashboards. Our roundup of database monitoring tools compares options on coverage and price.
How do You Roll Out Database Observability Without Adding Risk?
Database observability best practices focus on getting useful evidence at low overhead: Start with revenue-critical services, sample sensibly and keep sensitive data out of telemetry.
We recommend five practices:
Start with one critical journey: Checkout, login or claims submission, instrumented end to end before anything else
Sample traces, keep statistics complete: Query statistics are cheap to keep in full; full trace capture on every request usually isn't
Sanitize at the collector: Strip literals and drop sensitive attributes before data leaves the host
Use a dedicated read-only account: Collection should never need write rights on production
Tag queries with service context: Service and endpoint names turn an anonymous fingerprint into an owned problem
Once the first journey has helped close an incident, expand one service at a time.
How does Motadata ObserveOps Bring Database Observability into One View?
Motadata ObserveOps brings database observability into one view by recording each database call as a span inside the application trace, then placing engine metrics, logs and host data beside it. A typical investigation runs in five steps:
Open the service: In APM Explorer, select Service and open the service behind the slow endpoint
Find the operation: In the Database tab, compare Avg and Max Response Time per operation, filtered by Operation Type
Read the statement: Click View Query on the slow operation
Open a trace: In the flame chart, check the database span, then the Logs, Host and Metric panels
Check the engine: Compare the blocking, wait and top-query metrics for the same database and time window
1. Database Calls Inside Every Trace
We built our application performance monitoring so that every database call is recorded as a span within the trace that triggered it. The Database tab lists each operation with Total Requests, Error Count and Min, Max and Avg Response Time, and the Operation Type filter separates Select, Insert, Update and Delete. The View Query link on each row opens the statement behind the numbers.
Directly discovered databases also link into APM traces and service topology, which is how database performance correlation works across instrumented and discovered systems. In the flame chart, the Logs panel filters correlated logs for the same service to 15 minutes either side of the trace, and the Host and Metric panels show a two-hour window around it.
2. Engine-Side Evidence for Locks, Waits and Top Queries
The trace shows where the time went and the engine shows why, so we collect from the database side as well.
SQL Server: Blocked and blocking session queries side by side, wait types, deadlocks per second, and top queries by CPU and elapsed time
Oracle: Enqueue and buffer waits, blocking sessions with user and program, and top SQL by SQL ID
PostgreSQL: Held and waiting locks, deadlocks, cache hit ratio and the query each session is running
Wider coverage: MySQL, MariaDB, MongoDB, Oracle RAC, IBM Db2, SAP HANA, Sybase and Redis, plus managed services such as Azure SQL, AWS RDS and GCP Cloud SQL
Before a PostgreSQL instance reports these metrics, open port 5432 to the ObserveOps server and add the server's address to pg_hba.conf. Agentless collection also needs remote access for the monitoring user, while agent-based collection does not.
That pairing is what we mean by application database correlation: Application response, database behavior and host metrics read together.
3. Alerts and Investigations with Context
APM policies alert on trace metrics with Threshold, Baseline, Anomaly or Forecast conditions, and Declare Incident triggers an integration profile at the severity you choose. Note that an anomaly policy needs at least eight hours of polling data before it can baseline a metric, so expect a short learning period after onboarding.
For metric alerts, the Correlation view lists Correlated Metrics, Correlated Logs, Correlated Alerts and Log Pattern for the same monitor and time window. Database Runbooks run a script against a database over JDBC and parse the output in Go or Python.
4. OpenTelemetry Standards and Privacy Controls
MotaAgent is built on OpenTelemetry standards, and auto-instrumentation covers Java, .NET, Python, Node.js and PHP. Go services need their QueryContext or ExecContext calls wrapped with otelsql for query performance monitoring at span level. If statements shouldn't appear in span details, add an attributes/remove processor for db.statement to otel-config.yaml and restart the agent.
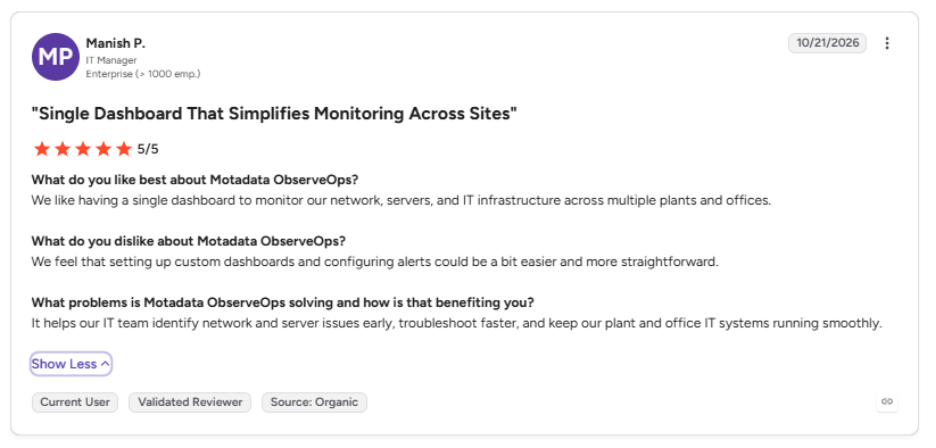
This is what one IT manager says about Motadata ObserveOps on G2:
Connect Every Slow Query to the Request Behind It with Motadata ObserveOps
Database observability takes effort. Instrumentation adds some overhead, telemetry adds storage, and no tool repairs a poorly designed schema; monitoring also stays in place for the failures you already know. What observability changes is the length of the incident call between "the database is slow" and "this job holds this lock."
Motadata ObserveOps puts the trace, the query, the wait and the host on one timeline, so that answer comes from evidence. Where to start:
Pick one journey: The checkout, login or claims flow that carries the most revenue
Instrument both sides: APM on the services, database integrations on the engines behind them
Measure the next incident: Track how long it takes to name the blocking query or regressed plan, then expand
FAQs
What is database observability in simple terms?
Database observability is the ability to explain why a database behaves as it does. It connects queries, wait events, locks and execution plans to the application requests that caused them, so a slowdown can be traced to a specific statement, session or change.
Is database observability the same as database monitoring?
No. Monitoring checks known metrics such as CPU, storage and connections against thresholds and raises alerts. Observability adds query, wait, lock and trace data so you can investigate new or intermittent problems and find their cause, and most organizations run both together.
What is observability in database devops?
It means tracking schema migrations, deployments and query changes as events alongside database performance data. Teams can then see within minutes whether a release changed a query plan, locked a table or increased latency, and decide quickly whether to fix forward or roll back.
Does database observability slow down the database?
Collection adds some load, but it is usually small when done well. Reading query statistics from engine views is light, while trace sampling, a read-only monitoring account and sanitizing query text at the collector keep both overhead and data exposure under control.
Can Motadata ObserveOps link application traces to database queries?
Yes. Motadata ObserveOps records each database call as a span within the application trace that triggered it. Engineers can move from a slow endpoint to the specific operation, its response times and error count, and the related logs and host metrics in one workspace.
Author
Poonam Lalani
Content Strategist
Poonam Lalani is a B2B content strategist and writer with a background in computer engineering and experience across enterprise technology domains, including AI, cloud, DevOps, data engineering, and IT operations. She specializes in creating research-driven content that simplifies complex ideas and supports product education, thought leadership, and business growth.