Top 10 Synthetic Monitoring Tools for Uptime, API and Browser Transaction Checks
How often does a customer find a broken login or checkout before your monitoring does? Servers may report no problems at all while a payment API times out. By the time a complaint reaches the service desk, those lost sales are already gone.
Synthetic monitoring tools exist to find that failure first. Scheduled checks behave like a user and raise an alert when a step breaks or slows down. Picking a tool takes more thought, because options range from basic uptime checkers to full observability suites.
The problem: Healthy servers, broken user journeys
What we compare: Ten tools on five weighted factors
What we score: Correlation, coverage and alert handling
What we concede: When a free tool suffices
What you get: A situation-based decision guide
This guide builds on the basics of synthetic monitoring and compares the leading options for IT and business leaders.
What are Synthetic Monitoring Tools?
Synthetic monitoring tools run scripted visits to your websites and APIs on a timer, doing what a user or another system would do. If a step fails or takes too long, you get an alert. Because none of this depends on live traffic, problems come to light overnight and before a release reaches customers.
In practice, synthetic monitoring software covers four kinds of checks:
Uptime and HTTP checks: Availability, response codes, response time, DNS and SSL certificate validity for a URL or endpoint
Synthetic API monitoring: Scheduled requests with assertions on status, headers and payload, sometimes chained into multi-step workflows
Browser synthetic monitoring: Automated browsers that click through journeys such as login, search and checkout without anyone at the screen
Network path checks: Ping, traceroute, DNS and internet routing tests that show how traffic reaches the application
Nearly every synthetic monitoring solution handles the first two. Where products start to differ is browser journeys, and how well results connect to the rest of your observability data.
How Does Synthetic Monitoring Fit into an Observability Strategy?
Synthetic monitoring is a proactive part of observability. It tests services before users arrive, and the other signals explain what happens once traffic flows:
Synthetic checks: Show whether a service or journey works before users arrive
Real user monitoring, or RUM: Shows what actual visitors experience in their browsers, as our guide to RUM vs synthetic explains
Application traces: Follow each request through services and databases, the core job of APM tools
Infrastructure metrics: Track the servers, networks and cloud resources underneath
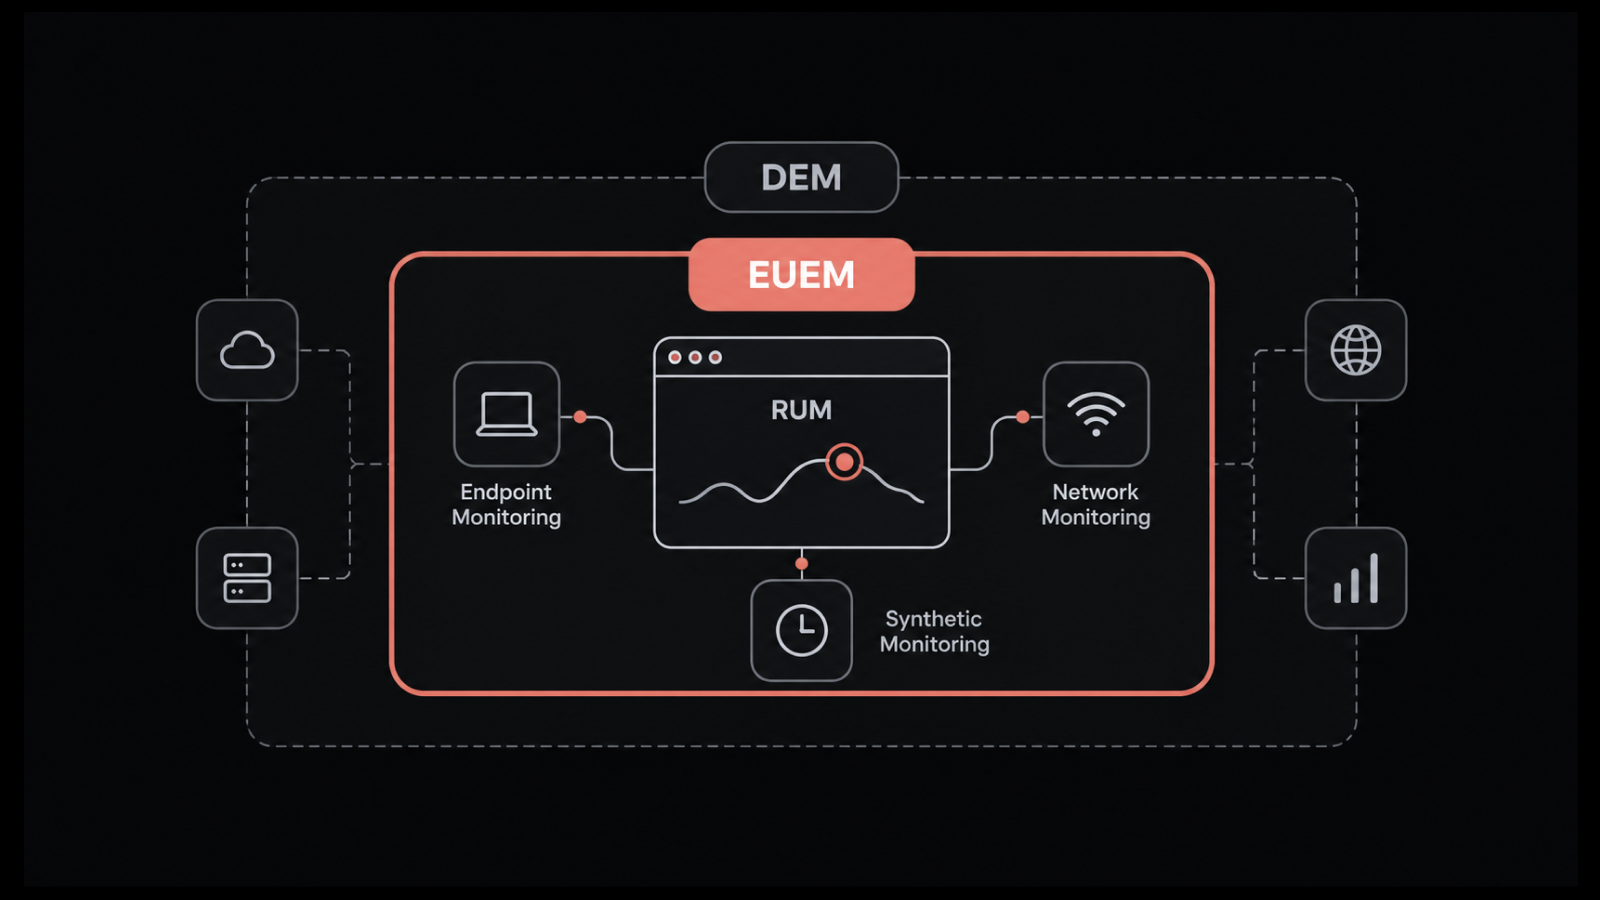
Each signal answers a different question, so a synthetic monitoring platform delivers more when its results appear next to the other three. Synthetic checks and real user monitoring together also form digital experience monitoring, the practice of measuring service quality from the customer's side.
What are Synthetic Monitoring Tools Used for?
Organizations use synthetic testing tools for a handful of recurring jobs:
Outage detection: Finding a failed endpoint before users report it, which lowers the mean time to detect, or MTTD
Journey validation: Confirming that revenue paths such as signup and checkout still work
Release checks: Running the same tests in the release pipeline, often called CI/CD, before and after deployment
SLA evidence: Recording availability from outside the network for service level agreements, against targets such as five nines uptime
Third-party watch: Tracking payment gateways, identity providers and CDNs the business depends on
How We Evaluated These Synthetic Monitoring Tools
Synthetic monitoring platforms on this list were scored against those jobs using five weighted factors, each mapped to a cost the business pays:
Check depth and journey coverage (25%): The range of check types, from HTTP and API monitoring to browser journeys, which decides whether revenue paths are covered
Failure-to-cause correlation (25%): How quickly a failed check leads to its cause through traces, logs and metrics, which drives the engineering hours spent on each outage
Deployment and private coverage (20%): Whether checks can run from private locations, meaning agents inside your network, and whether data can stay in your environment, which shapes audit exposure
Where the alert ends (15%): Whether a failure stops at a notification or becomes a tracked ticket, which affects SLA penalties
Pricing clarity (15%): How easy cost is to forecast as frequency and locations grow, which limits license sprawl
What This Synthetic Monitoring Evaluation Did Not Cover
Our comparison relies on documentation and published data. That brings a few limits:
Testing: No hands-on benchmark of every tool in identical conditions
Sources: Vendor documentation and live pricing pages, read in October 2026
Ratings: G2, Capterra and Gartner Peer Insights in the Infrastructure Monitoring Tools market
Pricing: Confirm current rates on each vendor's page before you buy
Disclosure: Motadata ObserveOps is our own platform
How Do the Top Synthetic Monitoring Tools Compare?
The top synthetic monitoring tools look alike on paper until you compare coverage, deployment and alert handling. That is what the table below does.
Tool | Best For | Deployment | What It Checks | Internal or Firewalled Apps | Where the Alert Ends | Pricing | G2 Rating |
Motadata ObserveOps | Checks tied to infrastructure, application and ticket | On-premises, private cloud or hybrid | URL, ping, port, DNS, domain, SSL, email, FTP, NTP, RADIUS, plus real user sessions, traces, servers and network | Yes, inside your own environment | ServiceOps ticket from correlated alerts | Quote-based | 4.6/5 |
Datadog Synthetic Monitoring | Datadog APM users | SaaS | API, multistep API, browser and mobile tests | Private locations | Datadog alerting, incident product separate | Per test run | 4.4/5 |
Checkly | Code-first Playwright checks | SaaS | API, Playwright browser, URL and TCP checks | Private locations on Team and above | Alert channels, incident modules priced separately | From $24 per month | 4.6/5 |
Grafana Cloud Synthetic Monitoring | Grafana and k6 users | SaaS with self-hosted probes | HTTP, ping, DNS, TCP, traceroute, k6 scripted and browser checks | Private probes | Grafana alerting | Free tier, then usage-based | 4.5/5 |
Dynatrace | AI-assisted root cause at enterprise scale | SaaS or managed | Browser clickpaths, HTTP and network availability monitors | Private synthetic locations | Problem record with root cause | Consumption-based | 4.5/5 |
New Relic Synthetics | Usage-priced observability | SaaS | Ping, browser, scripted browser, scripted API and step monitors | Private locations | New Relic alerts and issues | Free tier, then ingest and seats | 4.4/5 |
Catchpoint | Internet path and ISP visibility | SaaS with enterprise nodes | Web, API, transaction, BGP, DNS and traceroute tests | Enterprise nodes | Alerts and integrations | Quote-based | 4.5/5 |
Site24x7 | Recorded browser transactions | SaaS with on-premise poller | Website, API, DNS, SSL and recorded web transactions | On-premise poller | Alerts and ITSM integrations | From $10 per month | 4.6/5 |
Pingdom | Simple uptime and transactions | SaaS | Uptime, page speed and transaction checks | Public endpoints only | Alert notifications | From $16.50 per month | Not available |
Better Stack | Checks with built-in on-call | SaaS | Uptime, heartbeat and Playwright transaction checks | Not documented | Built-in on-call and incidents | Free plan, then modular | 4.8/5 |
Top 10 Synthetic Monitoring Tools Reviewed in Detail
Each synthetic monitoring tool review below covers strengths, trade-offs and verified pricing. Keep in mind that one buyer's limitation is often another buyer's deliberate choice.
1. Motadata ObserveOps
Best for: Organizations that want synthetic checks tied to the infrastructure, application and ticket behind them
Rating:
G2 - 4.6/5
Gartner Peer Insights - 4.6/5
Capterra - 4.7/5
ObserveOps is our own platform, so read this review, and its cons in particular, with that in mind. Its starting point is observability: scheduled service checks run on the same platform as real user monitoring and application traces.
When a URL check fails, nobody has to open another tool to look at traces or network metrics. The uptime assurance workflow can also raise a ServiceOps ticket before an SLA is breached. Scripted browser checks are outside the platform today, so a pre-release flow needs a separate test step.
Pros
- One platform covers availability checks, frontend experience, traces and infrastructure metrics
- Failed checks can be investigated against dependency maps and correlated alerts in the same platform
- On-premises, private cloud and hybrid deployment keep monitoring data inside your own environment
- Service level objectives with error budgets turn check results into availability reporting
Cons
- Pricing is quote-based and scoped to the environment, so there is no public rate card to compare
- Value is strongest where several monitoring tools are being consolidated into one
- Deployment mode is chosen at the start, so plan where data must live before rollout
- Browser journeys are measured from live user sessions, so pre-release flows need a separate test step
Pricing:
Licensing: Quote-based, scoped to the environment and deployment mode
Trial: A 30-day free trial is available
2. Datadog Synthetic Monitoring
Best for: Engineering organizations already running Datadog for APM, logs and infrastructure
Rating:
G2 - 4.4/5
Gartner Peer Insights - 4.6/5
Capterra - 4.6/5
Datadog offers one of the widest ranges of test types on this list, from multistep API chains to recorded browser tests. Correlation is the standout, since a failing browser test links straight to the backend traces and RUM sessions behind it.
Cost is the main consideration, since tests bill per run and frequency and location count multiply the invoice. Our Datadog alternatives breakdown compares that pricing with other platforms.
Pros
- Close correlation between a failed test and backend telemetry
- The codeless recorder opens browser testing to QA and operations staff
- Broad protocol coverage for API checks
- The same tests can run in CI/CD pipelines before release
Cons
- Per-run billing grows quickly with frequency and locations
- Most of the value depends on adopting the wider Datadog platform
- SaaS only, with private locations as the route to internal applications
Pricing:
API tests: $5 per 10,000 test runs per month billed annually, $6 month-to-month, $7.20 on demand
Browser tests: $12 per 1,000 test runs per month billed annually, $15 month-to-month, $18 on demand
Mobile app testing: $50 per 100 test runs per month billed annually
Trial: A free trial is available
3. Checkly
Best for: Developers who want browser and API checks written as Playwright code
Rating:
G2 - 4.6/5
Checkly treats monitoring as code. Browser checks are standard Playwright scripts stored in Git and deployed through a CLI, so the same checks run in CI before a release and on a schedule afterwards.
That code-first model is also the trade-off. Operations staff without JavaScript or TypeScript experience face a steeper start, and incident communication features are priced as separate modules.
Pros
- Browser checks reuse the Playwright skills developers already have
- Checks are reviewed and versioned like application code
- A usable free Hobby tier for small projects
- Published overage rates make usage easy to model
Cons
- Code-first authoring is a steeper start for non-developers
- Infrastructure and backend correlation depend on other tools
- Costs scale with check frequency, run duration and locations
Pricing:
Hobby: Free, with 10 uptime monitors, 1,000 browser runs and 10,000 API runs per month
Starter: $24 per month billed annually, with 3,000 browser runs and 25,000 API runs
Team: $64 per month billed annually, with 12,000 browser runs, 100,000 API runs and private locations
Enterprise: Quoted
Trial: A free trial is available on Starter and Team
4. Grafana Cloud Synthetic Monitoring
Best for: Organizations already using Grafana, Prometheus or k6 that want a generous free tier
Rating:
G2 - 4.5/5
Gartner Peer Insights - 4.5/5
Capterra - 4.6/5
Grafana Cloud runs protocol-level checks plus scripted and browser checks written in k6, Grafana's open-source load-testing tool, with results stored as metrics in Grafana dashboards. For an organization already invested in Grafana, synthetic data appears next to everything else it watches.
Correlation with traces and logs depends on running the matching Grafana backends, and anything beyond a simple check is written as code. Still, the free tier covers a meaningful set of checks before any spend.
Pros
- A free tier with 100,000 API and 10,000 browser executions per month
- Load-testing scripts carry over into monitoring
- Results fit directly into existing Grafana dashboards
- Self-hosted probes cover private networks
Cons
- Full log and trace correlation needs additional Grafana components
- Scripted checks require coding skills
- Usage-based billing across products can be hard to forecast
Pricing:
Free: 100,000 API test executions and 10,000 browser test executions per month
Pro: $19 per month platform fee, then from $5 per 10,000 API executions and from $50 per 10,000 browser executions beyond the free allowances
Enterprise: Custom, with a $25,000 per year minimum commitment
5. Dynatrace
Best for: Large enterprises that want AI-assisted root cause across complex applications
Rating:
G2 - 4.5/5
Gartner Peer Insights - 4.6/5
Capterra - 4.6/5
Dynatrace replays browser clickpaths and runs HTTP monitors from public and private synthetic locations. Its AI engine then connects a failed test to the service or host responsible, using the same topology model as its full-stack monitoring.
Billing is the main consideration. Under its consumption subscription, each capability has a separate rate-card unit. That model pays off best in organizations that already run Dynatrace as their standard platform.
Pros
- Strong automatic root-cause analysis
- A recorder lowers the barrier to browser journeys
- Synthetic results connect directly to RUM and APM
- Scales to large, distributed environments
Cons
- Consumption pricing is complex to forecast
- Platform depth brings a longer learning curve
- Best value requires broader Dynatrace adoption
Pricing:
Synthetic browser monitor: $4.50 per 1,000 synthetic actions, consumption-based under an annual platform subscription
Synthetic HTTP monitor: $1.00 per 1,000 synthetic requests, consumption-based under an annual platform subscription
Trial: 15 days
6. New Relic Synthetics
Best for: Organizations that want synthetic checks inside a usage-priced observability platform
Rating:
G2 - 4.4/5
Gartner Peer Insights - 4.5/5
Capterra - 4.5/5
New Relic offers simple and scripted monitors for pages and APIs. For multi-step journeys, there are step monitors that need no code. Results land in the same entity model as APM and infrastructure data, which gives an investigation one starting point.
Scripted monitors use New Relic's own Node.js runtime, and they are harder to move to another tool than plain Playwright tests. Pricing combines data ingest with user seats, so synthetic cost depends on how the wider account is used. Buyers weighing that model can compare options in our New Relic alternatives roundup.
Pros
- A free tier that includes synthetic checks
- No-code step monitors for non-developers
- One query language across all telemetry
- Simple per-check overage pricing
Cons
- Scripts are tied to New Relic's runtime
- Seat-based pricing climbs as full platform users grow
- SaaS only
Pricing:
Free: 100 GB data ingest per month, one full platform user and 500 synthetic checks
Data ingest: $0.40 per GB beyond the free 100 GB
Pro: $349 per full platform user per month on an annual commitment, or $418.80 pay as you go
Additional synthetic checks: $0.005 per check
7. Catchpoint
Best for: Global enterprises that need internet path, ISP and CDN visibility
Rating:
G2 - 4.5/5
Gartner Peer Insights - 4.6/5
Catchpoint focuses on internet performance monitoring from a large global agent network that includes backbone and last-mile vantage points. Beyond web and API tests, it tracks BGP routes, the paths traffic takes between internet providers, which helps locate regional failures outside your own infrastructure.
LogicMonitor now owns Catchpoint. Its synthetics are sold as an add-on to the LogicMonitor platform, priced by quote. For typical web application monitoring, that depth can exceed what an organization needs.
Pros
- Pinpoints ISP, CDN and DNS issues outside your direct control
- A wide range of external vantage points
- Useful SLA evidence for externally hosted services
- RUM and session replay available in the same suite
Cons
- Quote-based enterprise pricing
- More capability than most web application use cases require
Pricing:
Licensing: Quote-based, sold as the LM Synthetics and Internet Performance add-on to LogicMonitor
Trial: No trial length is published for the add-on
8. Site24x7
Best for: IT operations staff who prefer recorded browser transactions to scripts
Rating:
G2 - 4.6/5
Gartner Peer Insights - 4.5/5
Capterra - 4.7/5
Site24x7 records multi-step web transactions in a browser and replays them on a schedule, next to uptime checks for websites and APIs. An on-premise poller brings the same checks to internal applications.
Transaction monitors come in small numbers on lower plans. ManageEngine has also moved Site24x7's infrastructure and observability capabilities into OpManager Nexus, while website and digital experience monitoring keep the Site24x7 name, so confirm which product a quote covers.
Pros
- A no-code recorder suits operations staff
- Low entry price for uptime and transaction checks
- Internal applications covered through the on-premise poller
- A free plan for basic uptime monitoring
Cons
- Transaction monitors are limited on lower plans
- The product naming change adds buying complexity
- Anomaly detection and event correlation are Enterprise-plan features
Pricing:
Web Uptime: $10 per month, or $9 per month paid annually, for 25 websites from 32 locations
Web Perf: $39 per month, or $36 per month paid annually, for 40 websites and 8 transaction monitors
Synthetic transactions: $10 per 10,000 runs per month at list price
Free plan: Uptime monitoring for up to 50 resources
Trial: 30 days
9. Pingdom
Best for: Small and midsize businesses that want simple uptime and transaction checks
Rating:
Capterra - 4.5/5
Pingdom, part of SolarWinds, pairs uptime checks with multi-step transaction checks for flows such as login and checkout. Setup takes minutes, and real user monitoring is sold as a separate subscription.
Advanced checks come in far smaller allocations than uptime checks, and tests run from public locations only. Outgrowing Pingdom? Our Pingdom alternatives guide walks through the main options.
Pros
- Very quick to set up
- Low entry price
- Clear reports for non-technical stakeholders
- A long-established service
Cons
- A long-established service
- No coverage for internal applications
- Limited correlation with backend telemetry
Pricing:
Synthetic Monitoring: From $16.50 per month billed annually, $198 per year, for 10 uptime checks, one advanced check and 50 SMS alerts
Real User Monitoring: From $16.50 per month billed annually, $198 per year, for 100,000 pageviews
Trial: 30 days
10. Better Stack
Best for: Startups that want synthetic checks, on-call and status pages in one product
Rating:
G2 - 4.8/5
Capterra - 4.8/5
Better Stack is built for organizations that want monitoring and incident response from one vendor. Uptime checks and Playwright transaction checks come with on-call scheduling and status pages. A failed check can page the right responder and update a status page automatically.
The trade-off is billing. Responder seats, monitor packs and browser minutes are each charged separately, and the total can be hard to predict. Data is kept in EU regions unless you arrange custom residency on an enterprise agreement.
Pros
- Monitoring and incident response in one tool
- A free plan for personal projects
- Unlimited phone and SMS alerts with each responder license
- A clean, fast interface
Cons
- Modular billing complicates forecasting
- SaaS only
- Checks for internal networks are not documented
Pricing:
Free: 10 monitors and heartbeats with one status page
Responder license: $34 per month, or $29 per month billed annually
Additional monitors: $25 per month for 50, or $21 per month billed annually
Playwright transaction checks: $1 per 100 browser minutes
Guarantee: 60-day money-back guarantee on paid plans
Do You Really Need a Dedicated Synthetic Monitoring Tool?
A dedicated synthetic monitoring tool isn't necessary if you only need to know that a few public pages are up. A free uptime checker or a self-hosted open-source synthetic monitoring project handles that well, and our guide to website monitoring tools covers those options.
A free or self-hosted tool is often all you need when:
Scope is small: A handful of public URLs with no multi-step journeys
Alerts are simple: An email or chat message is all the response you need
Stakes are low: A few minutes of undetected downtime carries little revenue or contract risk
One structural limit is worth knowing. When the network fails, a checker hosted on it fails too, and the outage goes unreported. An external vantage point alongside it covers that case.
When Does a Free Synthetic Monitoring Tool Stop Being Enough?
Free tools stop being enough at three predictable points:
Journeys carry revenue: Once login, signup or checkout must be tested end to end, single URL checks miss the step that breaks
Applications live behind the firewall: Intranets, ERP portals and internal APIs need checks that run from inside the network, which public probes cannot reach
Alerts need an owner: When an SLA or customer contract is involved, a failed check has to become an assigned, tracked incident with its cause attached
An online retailer is a good example. Its checkout hands off to a third-party payment gateway, and a free uptime check will keep reporting that the homepage is up all day. It takes a browser journey that reaches the payment step to spot the gateway timing out, and the sooner that happens, the fewer carts are abandoned.
What Should You Look for in a Synthetic Monitoring Tool?
A synthetic monitoring tool should earn its budget. We would hold it to six checks, each tied to a cost you already pay:
Check coverage: Uptime, API and browser journey checks, so revenue paths are tested before customers find a fault
Private locations: Agents inside your network that test internal applications, protecting the working hours of staff who depend on them
Correlation: A path from a failed check to the dependency mapping that explains it, cutting engineering hours per incident
Alert handling: Multi-location confirmation and routing into ticketing, which cuts false pages and missed handoffs
Deployment options: SaaS, on-premises or hybrid, so monitoring data stays where audit rules require
Predictable pricing: A cost model you can forecast as checks and locations grow, avoiding budget overruns
How Much do Synthetic Monitoring Tools Cost?
Synthetic monitoring tools are sold under four pricing models. The model can matter as much as the rate itself, since check volume climbs with each journey and location you add:
Per test run: Datadog, Grafana Cloud Pro and Dynatrace bill each execution, so cost rises with frequency and locations
Plan allocation: Checkly, Site24x7 and Pingdom sell monthly plans with a set number of checks or runs
Seats plus data: New Relic charges for user seats and data ingested, with synthetic checks included up to a limit
Quote-based: Motadata ObserveOps and Catchpoint price against the scope of the environment
What Does a Typical Synthetic Monitoring Schedule Cost?
A modest browser schedule generates more runs than most budgets expect. Take an organization that tests five revenue journeys every five minutes from three locations:
Runs per journey per day: 288
Runs per month across five journeys: 43,200
Runs per month across three locations: 129,600
On Datadog, browser runs are published at $12 per 1,000 on annual billing. That puts this schedule at about $1,555 a month, with API tests on top. Grafana Cloud Pro works out lower at its starting rates: roughly $620 a month, counting the $19 platform fee and $50 per 10,000 browser executions after the free allowance.
Is either figure too high for a journey that brings in revenue? In most cases, no. The point is that both climb with every journey and location you add, so model that growth before signing.
What are Synthetic Monitoring Best Practices?
Synthetic monitoring best practices help control spend and false alarms after rollout. None of them depends on which platform you pick.
1. Reserve Browser Synthetic Checks for Revenue Paths
Browser checks are the expensive ones, and they are also the first to break when a page changes. Save them for flows where a failure costs money.
Map the journeys that carry revenue or contracts, such as login, checkout and quote requests
Run frequent, low-cost HTTP and API checks for general availability
Schedule browser journeys for the critical flows only
2. Confirm Synthetic Check Failures from More Than One Location
If only one probe fails, the problem is usually that location's network. Wait for a second or third location to confirm before paging anyone.
Run each critical check from at least two or three locations
Alert only when several locations fail in the same window
Add a retry before escalating
3. Run Synthetic Checks on Internal Applications from Inside the Network
Internal users depend on applications that public probes cannot see, and their outages cost working hours.
List internal portals, APIs and line-of-business applications
Deploy private agents or collectors at each site that uses them
Track branch performance separately from headquarters
4. Use Dedicated Test Accounts for Synthetic Transactions
Synthetic checks that log in or place orders with production accounts skew analytics, and test orders can affect inventory.
Create test accounts with clear naming and limited permissions
Use test payment methods or sandbox endpoints for checkout flows
Exclude synthetic traffic from business analytics
5. Tie Synthetic Check Results to Service Level Objectives
Leadership pays attention to availability when it is measured against something the business promised.
Define service level objectives for each customer-facing service
Feed synthetic availability and latency into the error budget, the downtime an SLO allows
Compare synthetic timings with Core Web Vitals from live sessions
6. Review Synthetic Checks After Every Release
Rename one button and a script can fail while the site works perfectly. Leave checks like that unattended and people stop trusting the alerts.
Add check reviews to the release checklist
Run synthetic tests in staging before production deployment
Retire checks for flows that no longer exist
How do You Choose the Right Synthetic Monitoring Tool?
Choosing the right synthetic monitoring tool starts with who writes the checks, where your applications run and what has to happen when an alert fires. Match your situation to a row below:
Your Situation | Shortlist |
Failed checks must arrive with infrastructure context and open a ticket | Motadata ObserveOps, Dynatrace |
Monitoring data must stay on-premises or in your own cloud | Motadata ObserveOps, Grafana Cloud with private probes |
Engineers want checks as Playwright code in Git | Checkly, Motadata ObserveOps for the infrastructure behind them |
Already standardized on an observability platform | Datadog, New Relic, Dynatrace |
QA or operations staff need to record journeys without code | Site24x7, Datadog |
ISP, CDN or BGP problems affect global users | Catchpoint |
Small budget, simple public uptime | Grafana Cloud free tier, Pingdom, Better Stack |
Most buyers land on one of these, and for a developer-led web application in public cloud, they detect broken journeys well. Developers who write their own checks often go with Checkly, while organizations that want correlation inside one platform tend to look at Datadog or Dynatrace. If you already use k6, Grafana Cloud is the obvious fit, and for internet routing problems Catchpoint is the specialist.
IT operations leaders should then put two more questions to every vendor:
Where the alert ends: Ask whether a failure stops at a notification or arrives as a ticket linked to distributed tracing data, since each manual handoff adds engineering hours to an outage
Where the tool can run: Ask whether it deploys on-premises or in a private cloud, since regulated industries such as banking and healthcare often cannot send monitoring data to a vendor's cloud
Motadata's background is network and server monitoring, and synthetic checks came later. That history explains the answers ObserveOps gives: alerts can open ServiceOps tickets, and the platform runs on-premises or in hybrid setups. Once two tools cover the checks you need, these questions usually decide between them.
Connect Every Failed Check to Its Root Cause with Motadata ObserveOps
Synthetic transaction monitoring tools all promise early warning, and for a few public pages a free uptime checker may be all you need. That rarely holds for long. Once revenue journeys and SLAs are on the line, spotting a failure is the easy part; explaining and fixing it is where the money goes, and where observability pays off.
Motadata ObserveOps brings service checks, real user data and application traces into one platform, and you choose where it runs. When a check fails, it can open a ServiceOps ticket straight away. The outage gets an owner, and fewer tools stand between the alert and the fix.
FAQs
What is the difference between synthetic monitoring and real user monitoring?
Synthetic monitoring runs scheduled checks that act like a user, so it finds failures before customers arrive and during quiet hours. Real user monitoring measures what actual visitors experience once traffic flows. Most organizations need both, and Motadata ObserveOps shows the two views in one console for direct comparison.
Is synthetic monitoring software free?
Some synthetic monitoring software has a free tier, and Grafana Cloud's includes 100,000 API and 10,000 browser test executions each month. Self-hosted open source synthetic monitoring projects are also free to license. Their cost lies in the servers they run on and the engineering hours needed to maintain them.
What should a synthetic monitoring tool include?
A synthetic monitoring tool should cover uptime, API and browser journey checks, with private locations for internal applications. It should confirm failures from more than one location and connect each failure to its cause. Finally, check that alerts flow into ticketing and that pricing stays predictable as checks grow.
Is Motadata ObserveOps or Datadog better for synthetic monitoring?
It depends on your environment. Datadog offers wider recorded browser and mobile testing inside its SaaS platform, billed per test run. Motadata ObserveOps suits organizations that want service checks, real user data and traces on-premises or in hybrid deployments, with failures flowing straight into ServiceOps tickets.
How often should synthetic checks run?
Critical uptime and API checks commonly run every one to five minutes, while browser journeys usually run every five to fifteen minutes to balance coverage against cost. Revenue paths with strict SLAs justify a higher frequency. Whatever the interval, confirm a failure from more than one location before anyone is paged.
Author
Poonam Lalani
Content Strategist
Poonam Lalani is a B2B content strategist and writer with a background in computer engineering and experience across enterprise technology domains, including AI, cloud, DevOps, data engineering, and IT operations. She specializes in creating research-driven content that simplifies complex ideas and supports product education, thought leadership, and business growth.