Best APM Tools: 10 Top Options Compared for 2026
Slow applications are hard to diagnose. The delay rarely sits where the symptoms appear. The best APM tool finds that layer fastest, and application performance monitoring traces are how it gets there.
OpenTelemetry graduated from the Cloud Native Computing Foundation on May 21, 2026. So, instrumentation is portable now. So we scored all 10 on two things: what a platform does with your traces, and what it costs to keep them.
In this guide, we compare the best tools for application performance monitoring, including their pros, cons, and key features. By the end you will have a shortlist worth trialing.
What Is an APM Tool?
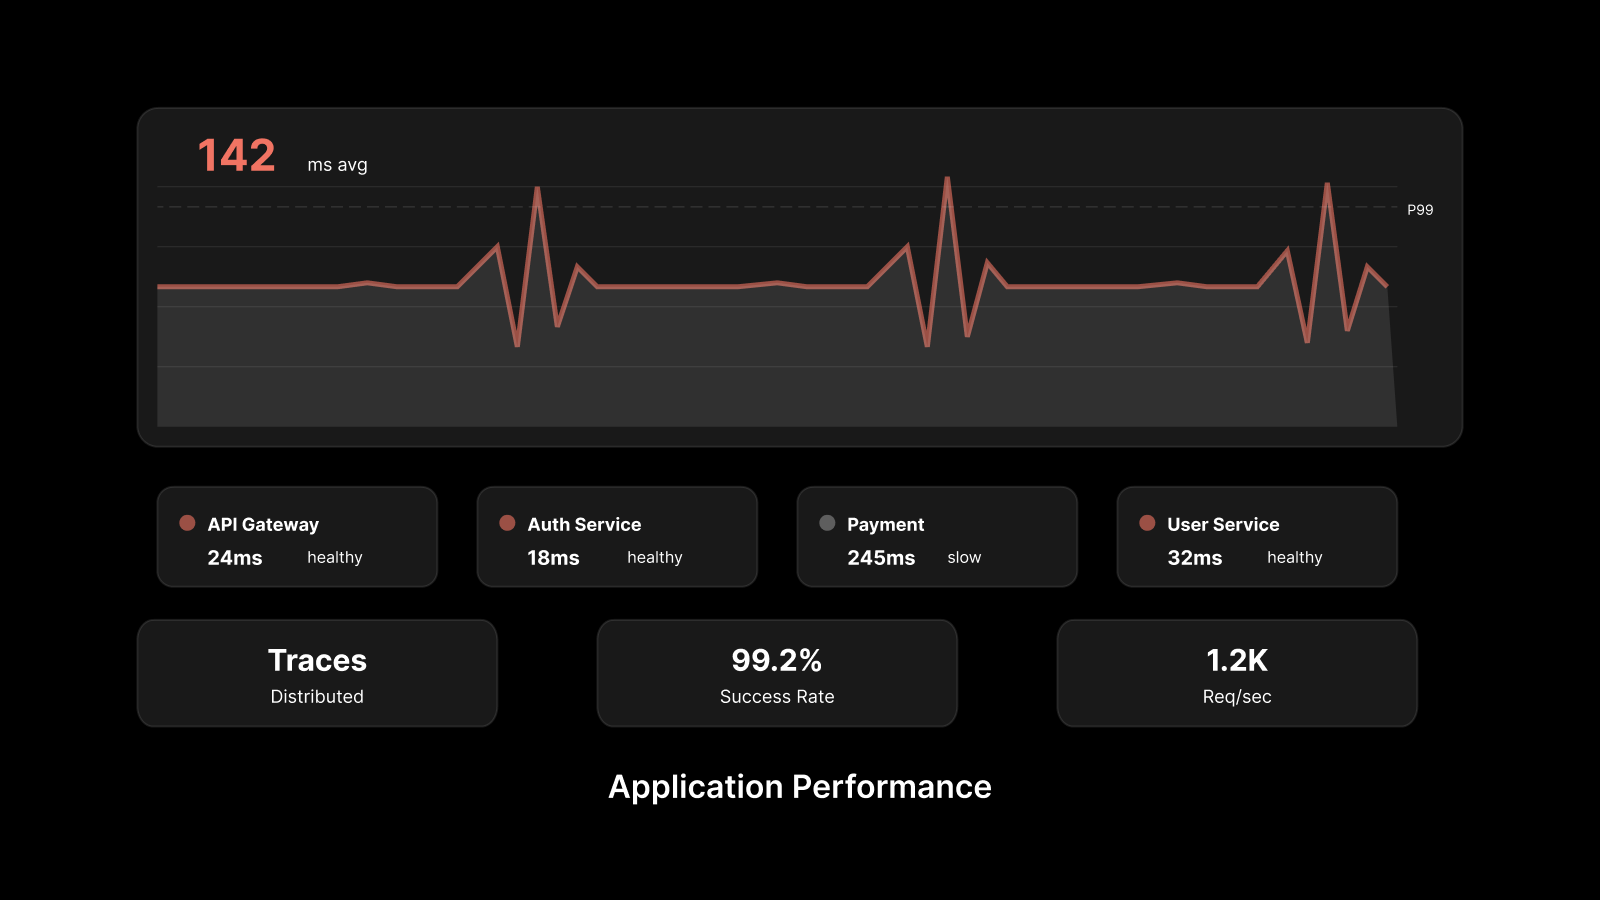
An APM tool tracks how software applications behave in production. It measures response time, error rate, and throughput. It also traces individual requests across the services, databases, and queues they pass through.
The point is the speed of diagnosis. A page slows down, and the tool names the service that added the delay. Often it names the method inside that service too.
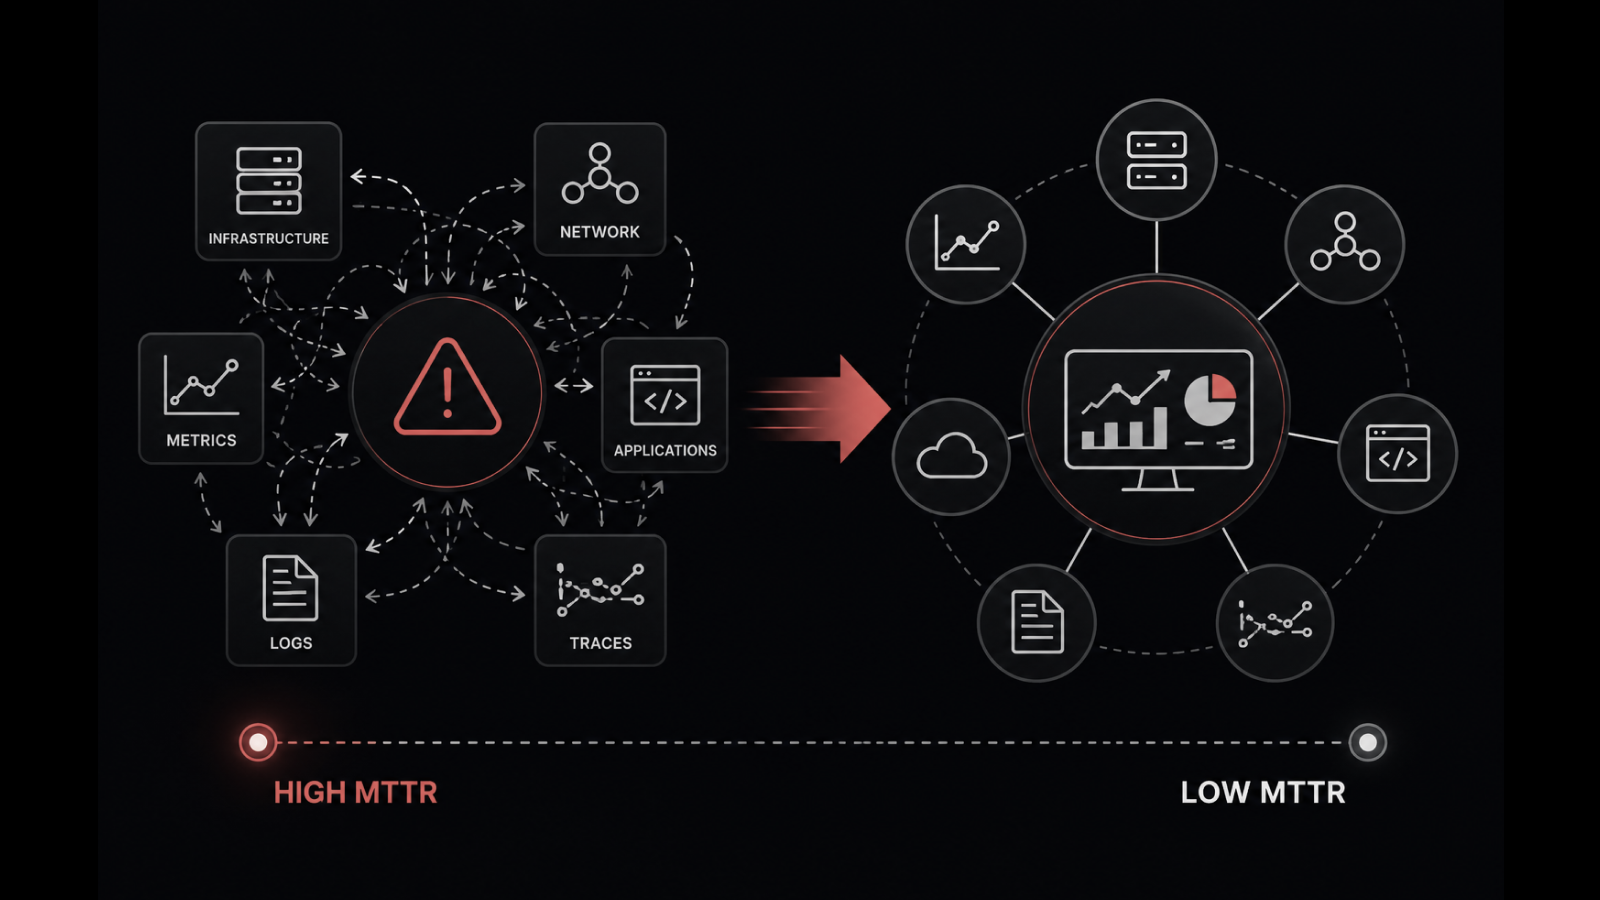
APM and observability are not interchangeable terms, though buyers use them that way. APM watches application behavior. Full-stack observability adds infrastructure, network, and log analysis around it. Most platforms below do both.
How We Picked These APM Tools
We built this list from three inputs. The first was the set of tools that rank and get cited for APM queries. Verified G2 and Gartner Peer Insights reviews came second. Third, and most useful, were the practitioner threads where teams describe what actually broke.
Every tool was scored against the same six criteria:
Instrumentation and OpenTelemetry support: Whether traces stay portable if you leave.
Correlation depth: The distance from a symptom to the evidence that explains it. Most tools lose their advantage here.
Deployment flexibility: SaaS, self-managed, on-premises, or all three.
Alerting and anomaly detection: Does the platform catch problems before your users report them?
Pricing transparency: Can you model next quarter's bill from this quarter's usage? Several vendors here fail that test.
Real coverage: Languages, runtimes, containers, and clouds supported out of the box.
We weighted the criteria we could test over the ones vendors self-report. Ratings below are current at the time of writing. They move with new reviews.
The 10 Best APM Tools Compared
The table below compares all 10 on the four decisions that matter most.
Tool | Best For | Deployment | OpenTelemetry | AI Root Cause | Starting Price |
1. Motadata ObserveOps | Unified observability across apps, infrastructure, and networks | SaaS and on-premises | Native | Yes | Quote-based |
2. Datadog | Cloud-native teams wanting one vendor for everything | SaaS only | Native | Yes (Watchdog) | $31 per host/month |
3. Dynatrace | Automated root cause in large hybrid estates | SaaS, managed, on-premises | Native | Yes (Davis) | About $58 per 8 GiB host/month |
4. New Relic | Developer-led, code-level diagnostics | SaaS only | Native | Yes | Free tier, then $49 per user/month |
5. Splunk AppDynamics | Tying application performance to business transactions | SaaS and on-premises | Partial | Yes (Cognition Engine) | $33 per CPU core/month |
6. Elastic APM | Search-led troubleshooting across logs and traces | Serverless, hosted, self-managed | Native (EDOT) | Yes | Free self-managed tier |
7. Grafana Cloud | Open-standards stacks built on Prometheus | SaaS and self-hosted | Native | Limited | Free tier, then $19/month |
8. SigNoz | OpenTelemetry-native monitoring on a budget | SaaS and self-hosted | Native-first | Limited | Free self-hosted, $49/month cloud |
9. ManageEngine Applications Manager | Mid-market IT teams monitoring apps and infrastructure together | SaaS and on-premises | Partial | Yes | $395/year |
10. Sentry | Code-level error tracking for development teams | SaaS and self-hosted | Native | Limited | Free tier, then $26/month |
Those prices are entry points, not what most teams pay. Nearly every platform here adds separate meters on top of the headline rate. Data ingest, retention, and seats all bill apart.
The 10 Best APM Tools in 2026
The list starts with unified platforms that cover applications alongside the infrastructure under them. It ends with focused tools that do one job well.
1. Motadata ObserveOps
Rating: G2 4.7/5, Gartner Peer Insights 4.6/5
Best for: IT and NOC teams whose incidents cross from the application into the network or the host underneath it, especially across hybrid and on-premises estates.
Pricing: Quote-based, with a free 30-day trial.
Motadata ObserveOps bundles its application performance monitoring tool into a wider observability platform. Agents cover Java, .NET, PHP, Node.js, Python, and Go. Kubernetes gets its own instrumentation.
Most outages are not purely application problems. A trace tells you a service is slow. Then somebody opens a second tool. Was it the host, the database, or a network path? The APM module ships beside network, log, and infrastructure monitoring for that reason.
Here is what one of our customers had to say about ObserveOps.
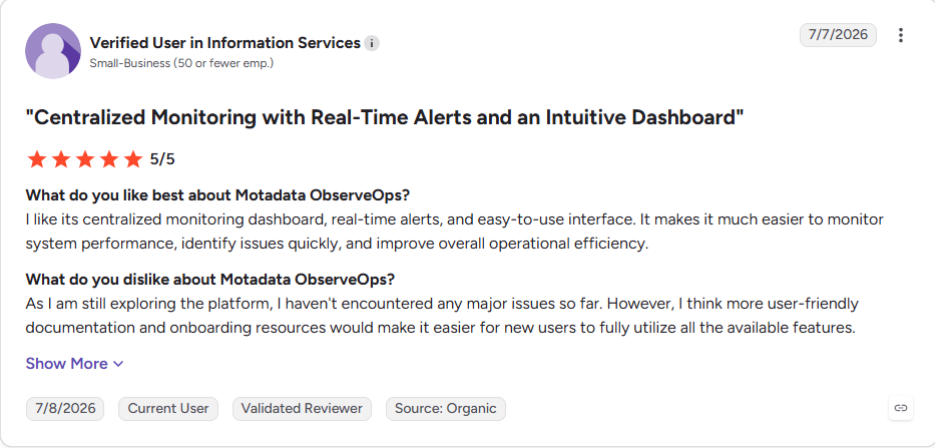
Check out more G2 customer reviews on Motadata ObserveOps.
Pros
- Application, infrastructure, network, and log data sit in one platform. Nobody switches tools mid-incident.
- Six deployment modes, including on-premises, high availability, and disaster recovery. That range suits BFSI, government, and telecom estates with data residency rules.
- Traces stay portable, not tied to a proprietary agent.
Cons
- Pricing is quote-based. Sizing it takes a sales conversation.
- The public review footprint is smaller than the decade-old SaaS platforms carry.
- Front-end instrumentation covers VueJS, Angular, ReactJS, and NextJS. Teams on other frameworks should check fit first.
- A team that needs error tracking for one application is buying too much platform.
Seeing that correlation work on a real transaction is faster than reading about it.
2. Datadog
Rating: G2 4.4/5, Gartner Peer Insights 4.6/5
Best for: Cloud-native shops on AWS, Azure, or GCP consolidating infrastructure, APM, logs, and user monitoring under one vendor.
Pricing: APM from $31 per host per month billed annually, including 150 GB of ingested spans and one million indexed spans.
Datadog is the default answer for a reason. It arrived early and integrated with everything. While rivals were still selling APM on its own, Datadog had already grown into infrastructure, logs, and user monitoring.
Breadth is also what makes the bill hard to predict. We have watched a Datadog bill double after one autoscaling event, with nobody able to name the meter responsible. Model the cost at your projected scale before you commit.
Pros
- The most polished single-pane experience here, refined over more than a decade.
- Time to first trace is short.
- Traces, logs, and infrastructure correlate tightly during an incident.
Cons
- Costs split across host fees, span ingest, indexed spans, and retention tiers. Bills are hard to model.
- APM rarely stands alone. Infrastructure monitoring is a paired product, and logs bill separately.
- SaaS only. Regulated workloads get no self-hosted option.
3. Dynatrace
Rating: G2 4.5/5, Gartner Peer Insights 4.5/5
Best for: Large enterprises where cloud-native services run beside legacy systems, and automated topology mapping earns its premium.
Pricing: Full-stack monitoring at $0.01 per GiB-hour, which works out to roughly $58 a month for an 8 GiB host.
Dynatrace is built around two proprietary pieces, the OneAgent binary and the Davis AI engine. Both reach further than OpenTelemetry alone can. Both also explain why the platform prices the way it does.
I have not seen another agent match that depth on a legacy Java estate. The depth comes from a binary running at kernel level inside your stack. Teams debate that point longer than any other during a Dynatrace evaluation.
Pros
- The strongest automation in the category. Large, fast-changing estates need little manual setup.
- Deterministic root cause analysis that measurably shortens on-call investigation.
- Syscall-level visibility that OpenTelemetry alone cannot reach.
Cons
- Premium pricing puts it out of reach for most small and mid-sized teams.
- The kernel-level OneAgent creates soft lock-in, even when OpenTelemetry runs alongside it.
- A steep learning curve. Consumption licensing takes real effort to model.
4. New Relic
Rating: G2 4.3/5, Gartner Peer Insights 4.6/5
Best for: Developers who live in queries. Code-level diagnostics run deep, and the query language takes an afternoon to learn.
Pricing: A free tier covers 100 GB of monthly ingest and one full-platform user. Beyond that, ingest runs $0.40 per GB, core users cost $49 a month, and full-platform users cost $349.
New Relic is one of the original APM vendors and still a developer favorite. NRQL explains much of that loyalty. It sits close enough to SQL that engineers stop reading the documentation quickly.
Pricing catches teams out. Seats and ingest bill apart, so a team that grows headcount faster than telemetry pays very differently from one that grows the other way. Work out which one you are first.
Pros
- The 100 GB monthly free tier is real. Evaluation and small-team use cost nothing.
- Fast time to value, with low setup friction and developer-friendly workflows.
- One telemetry store, so nobody switches tools mid-incident.
Cons
- Full-platform seats run $349 per user per month. Teams drop to cheaper tiers, and those tiers gate features.
- Seats, ingest, and AI compute form three separate billing meters.
- The breadth of the platform overwhelms new users.
Trying one of these against your own traffic settles more questions than a feature list does.
5. Splunk AppDynamics
Rating: G2 4.3/5, Gartner Peer Insights 4.4/5
Best for: Enterprises answering to a board about revenue impact, and especially existing Cisco or Splunk customers.
Pricing: Premium edition from $33 per CPU core per month billed annually, with Enterprise from $50.
AppDynamics now ships as Splunk AppDynamics under Cisco. Plenty of comparison pages still use the old name, so the rebrand is worth knowing before you shortlist. Cisco completed its $28 billion acquisition of Splunk on March 18, 2024, and the observability portfolio has been folding together ever since.
The framing here is commercial rather than technical. A slow checkout, a claim submission that stalls, a trade that misses its window: each one arrives with a cost attached. Finance and insurance teams respond to that far better than to latency percentiles.
Pros
- The strongest business-transaction lens available.
- Mature support for traditional three-tier applications alongside cloud-native services.
- Deep JVM and .NET diagnostics that legacy Java estates still depend on.
Cons
- Per-CPU-core licensing, layered onto the wider Splunk portfolio, complicates cost modeling.
- Heavier to deploy and operate than teams below enterprise scale need.
- The roadmap feels traditional next to cloud-first platforms.
6. Elastic APM
Rating: G2 4.3/5, Gartner Peer Insights 4.4/5
Best for: Anyone whose troubleshooting instinct is to search rather than click through dashboards, and anyone already on the Elastic Stack.
Pricing: The self-managed Basic tier is free. Elastic Cloud hosted plans start around $99 a month, and serverless bills on usage.
Elastic APM extends Elasticsearch and Kibana into application monitoring. It inherits the strengths of that stack, and the operational weight too.
If your team already lives in Kibana, Elastic APM gets you there fastest. Telemetry normalizes to Elastic Common Schema, so a trace and a firewall log answer the same query syntax. Somebody still has to run the cluster.
Pros
- Full-text search across telemetry that no other tool here matches. Log-heavy investigations benefit most.
- Deployment stretches from fully managed to fully self-hosted.
- A natural extension for teams already running Elastic for search or security.
Cons
- Self-managed deployments put cluster operations, shard tuning, and capacity planning on your team.
- Retention and search costs both scale with data volume.
- The APM interface trails platforms built APM-first.
7. Grafana Cloud
Rating: G2 4.5/5. No dedicated Gartner Peer Insights APM listing.
Best for: Platform engineers with Kubernetes and Prometheus behind them, chasing open standards at a low entry cost.
Pricing: A free tier covers 10,000 metric series, 50 GB of logs, and 50 GB of traces at 14-day retention. Pro starts at $19 a month plus usage.
Grafana Cloud is the managed version of the LGTM stack. Loki handles logs, Grafana handles dashboards, Tempo handles traces, and Mimir handles Prometheus-compatible metrics.
Four components mean four things to learn (and four sets of docs). Correlation is looser than a single-backend platform gives you. Teams accept that because every piece is Apache 2.0. Leaving later costs migration effort rather than a rewrite.
Pros
- The lowest entry cost here, with a fully open-source fallback.
- No proprietary agents anywhere in the pipeline.
- An enormous community and dashboard ecosystem.
Cons
- Three storage backends, no unified data model. Correlation happens at the dashboard layer, not the data layer.
- Self-hosting at scale demands real platform engineering capacity.
- Loki struggles with high-cardinality, log-heavy environments.
8. SigNoz
Rating: No significant G2 or Gartner Peer Insights listing yet.
Best for: Engineering teams self-hosting an OpenTelemetry-native platform and owning the data outright.
Pricing: The self-hosted community edition is free. Cloud starts at $49 a month, which includes $49 of usage.
SigNoz was built OpenTelemetry-first rather than retrofitted, and the setup shows it. An assembled open-source stack makes you build the query layer yourself. SigNoz ships with one already in place.
SigNoz suits teams whose objection to commercial APM is the bill rather than the features. The bill converts into engineering time rather than disappearing. We would not run it without somebody who owns the stack.
Pros
- No vendor lock-in. Instrumentation and backend are both open standards.
- Predictable costs next to per-host and per-seat commercial models.
- One query experience rather than three tools stitched together.
Cons
- Self-hosting takes platform engineering time to scale and maintain.
- A smaller ecosystem and integration catalog than the established platforms.
- AI-driven root cause analysis is thin next to Dynatrace or Datadog.
9. ManageEngine Applications Manager
Rating: G2 4.4/5. No dedicated Gartner Peer Insights APM listing.
Best for: Mid-market IT running applications and infrastructure from one on-premises console.
Pricing: The Professional edition starts at $395 a year for 10 monitors. Enterprise starts at $9,595 a year, and a free edition covers a handful of monitors.
Applications Manager comes at APM from the IT operations side rather than the developer side. It was built to keep a mixed estate running, not to hand developers method-level traces. The feature set follows that priority.
Licensing is the real differentiator. You buy monitors, so the bill moves when you add systems rather than when traffic spikes. For a mid-market team on a fixed budget, that predictability often outweighs the tracing depth it gives up.
Pros
- Monitor-based pricing that finance teams approve without modeling.
- Broad out-of-the-box coverage of enterprise applications and databases.
- A genuine free edition covers small environments.
Cons
- Distributed tracing depth trails what the cloud-native platforms offer.
- The interface feels dated next to newer observability tools.
- OpenTelemetry support is partial, not native. Portability suffers.
10. Sentry
Rating: G2 4.5/5. No dedicated Gartner Peer Insights APM listing.
Best for: Developers asking which deploy broke production rather than which host is saturated.
Pricing: A free developer plan covers 5,000 errors a month. Team plans start at $26 a month.
Sentry does one job better than anything else here. It grew out of error tracking, and distributed tracing arrived later.
That history shapes where it fits. Sentry answers which deploy broke production, a developer's question more than an operator's. Most teams run it beside a platform rather than instead of one.
Pros
- The clearest path from a production error to the commit that caused it.
- Excellent frontend and mobile coverage. Most APM platforms treat both as secondary.
- A free tier and low entry price that small teams start on immediately.
Cons
- It covers neither infrastructure nor log monitoring, so it rarely stands alone.
- Event-based billing across errors, spans, replays, and logs adds up fast at volume.
- Limited value for IT operations teams who need host and network visibility.
Which Type of APM Tool Do You Need?
The 10 tools fall into four groups. Picking the group first makes the shortlist much shorter.
1. Unified Observability Platforms
These are Motadata ObserveOps, Datadog, Dynatrace, and New Relic. A unified observability platform covers more than applications. Infrastructure, logs, and user experience come with it. Choose this group when incidents cross layers, which in our experience covers most of them.
2. Enterprise and Hybrid-Estate APM
These are Splunk AppDynamics and ManageEngine Applications Manager. Both are built for mixed estates where legacy applications sit next to newer services. Licensing and business reporting shape the decision as much as features do.
3. Open-Standards and Open-Source Stacks
These are Grafana Cloud, SigNoz, and Elastic APM. They trade license cost for operational ownership. Choose this group if you have platform engineering capacity. Portability is the payoff.
4. Focused Tools That Complement a Platform
Sentry sits alone in this group. It does one job extremely well, and teams usually pair a focused tool with a platform rather than choosing between them.
What Should You Look for in an APM Tool?
Test these eight criteria during a trial. They are ordered by how often they decide the outcome. We start with the Kubernetes case, because it fails more evaluations than any other criterion.
1. Full-Stack Visibility
Confirm the tool follows a request from the browser to the database. A tool that stops at the service boundary leaves you guessing.
2. Distributed Tracing Depth
Check whether traces reach method level in the languages you actually run. Then ask how much traffic gets sampled away. The trace you need during an incident is often the one that got dropped.
3. Kubernetes and Container Coverage
Test auto-discovery on a real cluster rather than a demo environment. Pods that come and go break tools built for static hosts. That failure only shows up under churn.
4. Real-Time Metrics
Look at collection interval and dashboard refresh rate. A one-minute delay is a long time during an incident. Polling gaps hide short spikes completely.
5. Alerting and Anomaly Detection
Judge whether dynamic baselines cut noise or add to it. Anomaly detection and predictive analysis have to earn their setup time. The test is whether they reduce what reaches your on-call rotation.
6. OpenTelemetry Support
Native ingestion keeps your instrumentation portable. Switching vendors later costs a configuration change. The alternative is re-instrumenting every service you run.
7. Deployment Model
Match SaaS, self-managed, or on-premises against your data residency rules before you shortlist. Several strong platforms are SaaS-only. That rules them out of regulated estates on day one.
8. Pricing Predictability
Model your bill at twice and ten times current telemetry volume, not at today's. Pricing surprises sink more deployments than any missing feature.
What Does an APM Tool Cost?
Feature comparisons rarely decide an APM purchase. The second-year bill does. In our experience the billing meter matters more than the headline rate, because the meter decides whether growth is a choice or a surprise.
Billing Model | Used By | What Makes the Bill Move |
Per host | Datadog, Dynatrace | Autoscaling, so costs peak exactly when traffic does |
Per CPU core | Splunk AppDynamics | Vertical scaling and larger instance types |
Per GB ingested | New Relic, Elastic, SigNoz | Every new service and every verbose deploy |
Per user seat | New Relic | Team growth, plus feature gating below the top tier |
Per event | Sentry | Error spikes, which arrive on your worst days |
Per monitor or quote | ManageEngine, Motadata ObserveOps | Deliberate expansion rather than automatic drift |
Three of those meters move without anyone deciding to spend more (nobody signs off on an autoscaling event). Picture a 40-host cluster that scales to 90 during a Friday sale.
That afternoon bills for 90 hosts. Datadog pricing compounds that way, because span ingest and indexed spans bill on top of the host fee.
Ask every vendor for the full list of billing meters. Get it in writing. Seat models hide a different trap, and New Relic pricing stacks seats, ingest, and AI compute as three meters that move independently.
How Do You Choose the Right APM Tool for Your Team?
Start from your situation rather than a brand name. This table points to a starting point, not a final answer.
Your Situation | Start With | Why |
Running a hybrid estate with on-premises data rules | Motadata ObserveOps | Unified APM, infrastructure, and network data with on-premises deployment |
Fully cloud-native on AWS, Azure, or GCP | Datadog | Broadest integration catalog and mature auto-instrumentation |
A large enterprise estate with legacy and cloud side by side | Dynatrace | Automated topology mapping and deterministic root cause |
A development team that wants code-level depth | New Relic | Deep diagnostics, NRQL, and a usable free tier |
Needing to tie performance to revenue | Splunk AppDynamics | Business transaction monitoring built for the finance conversation |
Already running the Elastic Stack | Elastic APM | Traces and logs searchable in the cluster you already operate |
Platform engineers who want open standards | Grafana Cloud or SigNoz | Portable instrumentation with a self-hosted fallback |
A mid-market IT team on a fixed budget | ManageEngine Applications Manager | Monitor-based licensing that is easy to forecast |
Chasing production errors back to a commit | Sentry | The fastest error-to-release workflow available |
Whichever row fits, shortlist two tools. Run them in parallel against real traffic for two to four weeks. That window catches a deploy and at least one genuine incident. Those two events expose the difference between platforms. If I had to pick a single test, I would time how long each tool takes to get from alert to cause.
Pick the Best APM Tool for Your Business
The best APM tool is the one that matches how your environment actually fails. Cloud-native teams are well served by Datadog or New Relic. Large enterprises with legacy systems in the mix get the most from Dynatrace. Platform teams who want to own their stack should look at SigNoz or Grafana Cloud.
IT and NOC teams usually decide on something else. A tool that sees one layer keeps sending you elsewhere for the answer. We watch that handoff eat minutes on nearly every cross-layer incident.
Motadata ObserveOps closes that gap. In our platform, traces, logs, network data, and IT infrastructure monitoring sit in one place.
FAQs
Which APM tool has the best real-time metrics?
Judge real-time performance on three things: collection interval, ingestion method, and dashboard refresh rate. Motadata ObserveOps polls as fast as one second through its MotaAgent. Dashboards reflect current conditions, not the last cycle.
What is the best APM tool for Kubernetes-based apps?
Kubernetes needs auto-discovery, because pods appear and disappear constantly. Look for OpenTelemetry-native instrumentation and container-aware dependency mapping. ObserveOps ships separate Kubernetes instrumentation. Its Kubernetes monitoring finds workloads instead of relying on static host definitions.
Can one APM tool cover both cloud and on-premises applications?
Yes, though fewer than you would expect. Several leading platforms are SaaS-only. That rules them out where data cannot leave your environment. ObserveOps runs on-premises, in private cloud, or in public cloud from one console.
What is the difference between APM and real user monitoring?
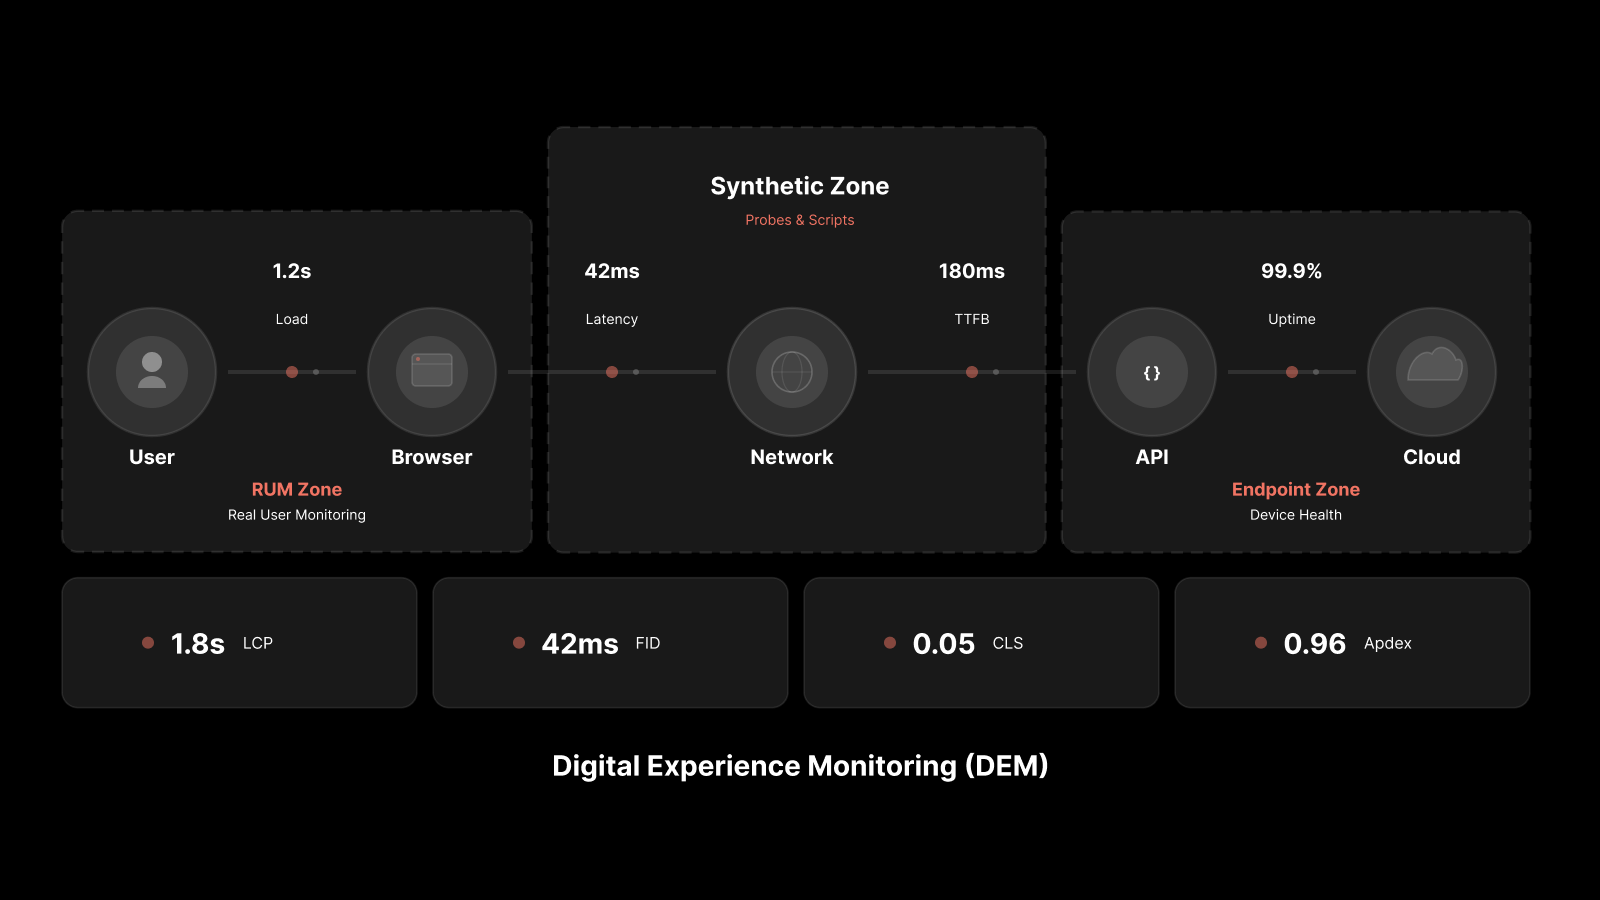
APM measures what happens inside your application: traces, latency, errors, and dependencies. Real user monitoring measures what users experience in the browser: page load, LCP, and Apdex. Most teams need both to explain a slowdown.
Does an APM tool replace infrastructure monitoring?
APM does not replace it. APM explains what happens inside your application. Infrastructure monitoring covers the hosts, containers, and network beneath it. ObserveOps carries both. A slow span traces straight through to the host behind it.
Author
Ramya Shah
Technical Writer
Ramya Shah is a technical content writer with a computer engineering background and roots in automotive journalism. He covers IT Service Management, observability, IT operations, and AI-driven automation. An early adopter of AI-assisted writing workflows, he turns complex IT processes into clear, engaging content optimized for search and answer engines (AEO), lifting content output and organic visibility.