Best Pingdom Alternatives: 10 Website Monitoring Tools Compared
Most teams shopping for Pingdom alternatives have no complaint about the checks. Pingdom does website monitoring from over 100 servers worldwide, and it reports outages well. What sends teams looking is the product built around those checks.
Synthetic monitoring and real user monitoring are sold apart, on separate meters. The entry plan covers 10 uptime checks and one Advanced Check.
Page speed and transaction tests both draw from that single check. Pingdom's public release notes also stop at October 2021.
In this blog, you will see:
Ten alternatives compared: Scored on check coverage, where checks run from, and how the bill scales.
A full review of every tool: What each one covers, what it costs, and the cons worth knowing.
The four types of Pingdom alternative: Naming the part you are replacing cuts the shortlist fastest.
What SolarWinds is doing with Pingdom: Its own migration guide says more than the product page does.
By the end, you will know which two or three deserve a trial against your own URLs.
Why Do Teams Look for a Pingdom Alternative?
Teams leave Pingdom for three main reasons. The two-product split makes the bill hard to size, the checks only see the outside of an application, and SolarWinds has begun moving accounts to a different product. Each one lands on a different kind of team.
1. Two Products, Two Meters, and One Advanced Check
Pingdom is not one subscription. Synthetic Monitoring is metered on uptime checks, Advanced Checks, and SMS alerts. Real User Monitoring is metered on monthly pageviews. You buy them separately.
Entry pricing runs $198 a year for each product, or $396 for both. That buys 10 uptime checks, one Advanced Check, and 100,000 pageviews. The catch sits in that one Advanced Check, because page speed and transaction tests both draw from the same pool.
A team with four checkout flows to watch needs four Advanced Checks before it has timed a single page load. Past that entry tier, Pingdom pricing scales on uptime checks, Advanced Checks, and SMS volume together.
2. External Checks Cannot See Inside the Application
Pingdom measures your site the way a visitor in another city would. That is the whole design. It runs probes from the public internet, so it can tell you a page returned a 500 error in four seconds.
What it cannot tell you is which service produced the error. When a page slows down, the cause is usually a database query, a saturated host, or a downstream API. None of those are visible to an external probe.
We have watched teams keep synthetic monitoring in one tool and infrastructure data in another, then match timestamps by hand at the worst possible moment.
3. SolarWinds Is Moving Pingdom Accounts to a Successor
SolarWinds publishes a support document called Migrate from Pingdom to SolarWinds Observability SaaS.
It is written to Pingdom customers rather than to the market. It describes a wave-based move onto SolarWinds Observability Digital Experience Monitoring.
The document is direct about what that means. It states: "SolarWinds Observability Digital Experience is the next generation of Pingdom, and it's been coming for a long time."
On timing, it says: "at the end of approximately 90 days, you will no longer use Pingdom." Historical data does not travel with the account. RUM snippets have to be replaced on every site, and the move runs once.
None of this makes Pingdom a bad product, and it has not been discontinued. It is still sold today. The pricing page was updated in April 2026, and a free trial is still running.
Plenty of teams renew each year and get what they pay for. The point is narrower. If this line item was due a review anyway, the review is more useful now than after a migration email lands.
What Are the Four Types of Pingdom Alternative?
Pingdom alternatives fall into four groups, and picking your group first is the fastest way to shorten the list. Ask which part of Pingdom you are actually replacing.
Here is how the ten tools sort:
Type | What you are replacing | Tools |
Just the uptime checks | An alert when the page stops responding, nothing more | UptimeRobot, Uptime Kuma |
The transaction and page speed checks, written as code | Multi-step browser flows that live in your repository and run in CI | Checkly, OpenStatus |
The checks plus what surrounds them | Alerts, on-call rotation, status pages, and SLA reporting in one place | Better Stack, Uptime.com |
The checks as one signal in a platform | Availability alongside the metrics, logs, and traces that explain it | Motadata ObserveOps, Site24x7, Datadog, SolarWinds Observability |
The first two groups are cheaper than Pingdom and narrower. The third costs about the same and does more with a failed check.
The fourth is a bigger commitment. It pays off only if you are cutting tools rather than adding one, which is the trade a unified observability platform asks you to make.
How Did We Evaluate These 10 Tools?
We scored every tool below on the same five factors. These are what actually differ between products in this category.
Check coverage: Which protocols and endpoints the tool can test, beyond a plain HTTP request.
Where checks run: Vendor probes, locations you configure, or a server you host yourself.
What happens after a failure: Alert routing, escalation, on-call scheduling, and status pages.
How the bill scales: Whether cost tracks monitors, check runs, pageviews, or hosts.
Diagnostic depth: Whether the tool helps you find the cause once you know something broke.
All pricing is public vendor information checked in September 2026, and vendors often change it without notice.
The 10 Best Pingdom Alternatives Compared
The table below puts all ten side by side. Pingdom sits in the last row as the baseline you are measuring against.
Tool | Best For | Where Checks Run | Pricing Model | Free Option |
Motadata ObserveOps | Availability plus the data that explains it | Collectors you deploy | Subscription quoted to your environment | Free trial |
UptimeRobot | Simple uptime alerting on a budget | Vendor probes | Free tier, then monitor-count plans | Free plan, 50 monitors |
Better Stack | Uptime with on-call and status pages | Vendor probes | Free tier, then blocks of monitors | Free plan, 10 monitors |
Checkly | Browser and API checks written as code | Vendor locations and private locations | Per check run | Free plan, hard-capped |
Uptime Kuma | Self-hosted monitoring with no vendor | Your own server | Free, MIT license | Free, self-hosted |
OpenStatus | Open-source checks managed in Terraform | 28 vendor regions, or self-hosted | Free tier, then per plan | Free plan, 1 monitor |
Site24x7 | Broad monitoring from many locations | Vendor probes in 130+ cities | Per module, tiered | Free plan, up to 50 monitors |
Datadog Synthetic Monitoring | Synthetics inside a wider platform | Vendor locations and private locations | Per test run | Free trial |
Uptime.com | SLA reporting and transaction depth | 100+ vendor probe servers | Per plan, split by check type | 30-day guarantee |
SolarWinds Observability | Staying with the incumbent vendor | Vendor probes | Per check configured, per pageview block | Free trial |
SolarWinds Pingdom (baseline) | External availability and page speed | 100+ vendor servers worldwide | Two products, per check and per pageview | Free trial, no free tier |
The reviews below cover each one in roster order, with pricing and the trade-offs that matter.
Detailed Overview of the 10 Best Pingdom Alternatives
1. Motadata ObserveOps
Best for: Teams that want external checks and the infrastructure data behind them on one subscription.
Type: Commercial, unified observability platform.
Rating: G2 4.6/5, Gartner Peer Insights 4.6/5
ObserveOps runs availability checks against eleven targets, a wider set than most tools here. Certificate expiry, DNS, and port checks come from the same engine as the URL check.
That URL check supports GET or POST, custom headers, query parameters, JSON responses, and string matching on the body, so it can assert on what a page returns rather than only that it returned something.
Those checks run from collectors you place inside your own estate, which cuts both ways. You do not get a vendor probe grid across dozens of cities.
You do get to check the intranet app, the staging endpoint behind the VPN, and the internal API no public probe can reach. Availability then feeds uptime assurance reporting, so an outage arrives as SLA impact rather than a raw alert.
Pros
- Checks reach internal and VPN-only endpoints that public probe networks cannot see.
- SSL certificate and domain expiry monitoring are built in, not sold as extras.
- Availability, metrics, logs, flows, and traces live in one platform, so a slow page and the host behind it appear on one timeline.
- Runs as SaaS, on-premises, in private cloud, or in public cloud.
- One quoted subscription replaces separate meters for synthetic and real user data.
Cons
- There is no vendor probe grid across dozens of cities. Timing a page load from São Paulo means placing a collector there.
- Setup is heavier than a hosted checker, because the platform and its collectors come first and the checks come second.
- Pricing is quoted rather than published, so you cannot size it yourself in five minutes.
- Front-end monitoring covers four JavaScript frameworks. Anything else needs custom instrumentation.
- It is more platform than a team watching five public URLs will ever use.
Pricing: Subscription quoted to your environment. ObserveOps Infinity meters monitoring per log source, real user monitoring per front-end app, APM per instrumented app, and network configuration management per managed device.
A feature list only tells you what a platform can do. Here is what a team running it day to day has to say about Motadata ObserveOps.
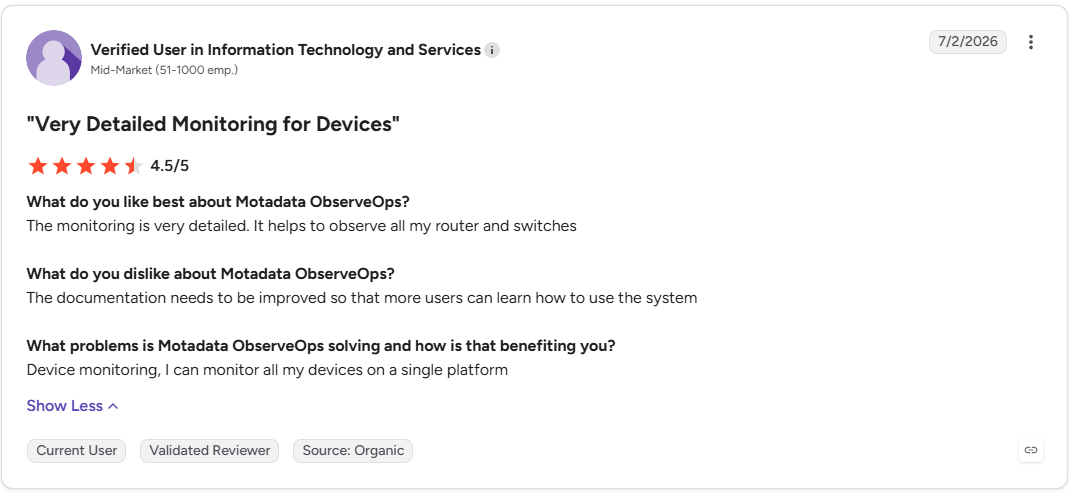
You can read the rest of the ObserveOps reviews on G2.
2. UptimeRobot
Best for: Teams whose whole requirement is an alert when a URL stops responding.
Type: Commercial SaaS with a free tier.
Rating: G2 4.7/5. No dedicated Gartner Peer Insights listing.
UptimeRobot is the tool most teams reach for first when Pingdom's bill stops making sense, and the free plan is why. Fifty monitors covers a small estate outright, and the monitor types reach past HTTP into keyword matching, ports, DNS, and certificate expiry.
Paid plans buy frequency more than features. The free plan checks every five minutes, and each step up the ladder cuts that to 60, then 30, then 15 seconds. Across every tier, UptimeRobot pricing is really a question of how fast you need to know.
Pros
- The free tier is usable rather than a demo, at 50 monitors.
- Setup takes minutes and the interface stays out of the way.
- Paid entry pricing sits below Pingdom's for a similar number of checks.
Cons
- The free plan caps integrations at five and offers only basic status pages.
- There is no real user monitoring, so a Pingdom account using RUM needs a second tool.
- Transaction monitoring is thin next to Pingdom's recorded browser flows.
Pricing: Free for 50 monitors. Solo $9 a month, Team $35 a month, and Scale $65 a month when billed annually, with Enterprise quoted.
3. Better Stack
Best for: Teams where the gap is not detection but the twenty minutes after an alert.
Type: Commercial SaaS with a free tier.
Rating: G2 4.8/5. No dedicated Gartner Peer Insights listing.
Better Stack treats an outage as an incident rather than a notification. Uptime checks run as fast as 30 seconds.
When several fail together, the platform groups them, so an engineer acknowledges the lot with one tap instead of clearing thirty alerts. Around that sit on-call scheduling and escalation, so an alert reaches a named person instead of a shared inbox.
Alerts travel over SMS, email, Slack, Teams, push, and unlimited voice calls. The status page then keeps customers informed without anyone writing an update by hand.
Pros
- Replaces both a monitoring tool and an on-call tool, which usually beats the combined bill.
- Unlimited voice call alerts remove a common per-call charge.
- The free tier covers 10 monitors and a status page for small setups.
Cons
- Monitoring locations are described only as around the world, with no published region count.
- Pricing scales in blocks of 50 monitors at $25 a month, which is coarse for a team adding a handful.
- Free-tier checks run every three minutes, slower than Pingdom's entry plan.
Pricing: Free for 10 monitors and heartbeats with one status page. Extra monitors cost $25 a month per block of 50.
4. Checkly
Best for: Engineering teams that want monitoring defined in code and running in the pipeline.
Type: Commercial SaaS, checks authored in open-source Playwright.
Rating: G2 4.6/5. No dedicated Gartner Peer Insights listing.
Checkly replaces the part of Pingdom that records browser transactions, and it replaces it with JavaScript. Browser checks are Node.js scripts using the open-source Playwright framework.
They run in a real browser to navigate pages, fill forms, and assert that the results are correct. That makes the checks reviewable, version-controlled, and runnable in continuous integration before a release ships.
The trade is that someone has to write and maintain them. That suits a team with JavaScript on hand and nobody else. Individual checks time out at four minutes.
Pros
- Monitoring lives in code review beside the application it tests.
- Playwright is open source and widely known, so the skill transfers.
- The same script can run as a pre-release test and as a production monitor.
Cons
- Checks are code, so a non-engineering team cannot maintain them.
- Billing on check runs makes a high-frequency check less predictable than a flat monitor price.
- The free plan is capped at 1,000 browser runs a month, and paid plans bill overages.
Pricing: Hobby is free with 10 uptime monitors, 1,000 browser check runs, and 10,000 API check runs a month. Starter is $24 a month and Team is $64 a month, with Enterprise quoted.
5. Uptime Kuma
Best for: Teams with a spare server who would rather host monitoring than pay for it.
Type: Open source, MIT license.
Rating: No significant G2 or Gartner Peer Insights listing yet.
Uptime Kuma is the self-hosted answer, and its 91,000 GitHub stars show how many people have taken it. It covers HTTP and HTTPS, keyword and JSON query checks, TCP, ping, DNS records, websockets, push and heartbeat monitors, Docker containers, and even game servers.
Installation runs through Docker Compose, plain Docker, or a manual setup on Linux or Windows with Node.js and PM2. There is no vendor, no subscription, and no usage limit. There is also nobody to call at 2 a.m.
Pros
- Free under the MIT license, with no per-monitor cost at any scale.
- All data stays on infrastructure you control.
- The project is actively maintained with a large community behind it.
Cons
- A single instance checks from one place, so it cannot measure regional performance the way vendor probes do.
- If the host running it goes down, your monitoring goes down with it.
- Patching, backups, and uptime for the monitoring tool become your job.
- No real user monitoring and no recorded browser transactions.
Pricing: Free. Your only cost is the server it runs on and the time to maintain it.
6. OpenStatus
Best for: Teams that want open-source monitoring managed the way they manage infrastructure.
Type: Open source, AGPL-3.0 license, with a hosted option.
Rating: No significant G2 or Gartner Peer Insights listing yet.
OpenStatus calls itself the open-source status page and uptime monitoring platform. Its distinguishing feature is the Terraform provider, which means a monitoring change goes through the same pull request as everything else your team ships.
It can also run on your own infrastructure, which puts it in the same bracket as Uptime Kuma. The practical difference is the hosted service, where checks run from many regions at once instead of from a single box you maintain.
Pros
- Monitoring config is version-controlled and reviewable like any other infrastructure change.
- The hosted plans give multi-region checks without running probes yourself.
- Self-hosting is a genuine escape hatch rather than a token gesture.
Cons
- The free plan allows one monitor at a 10-minute interval, so it is for evaluation only.
- The $30 plan gives six regions per monitor, and all 28 need the $100 tier.
- The project is much smaller than Uptime Kuma, at around 9,000 stars.
- The AGPL-3.0 license needs a legal read before it goes near a commercial product.
Pricing: Free for one monitor. Starter $30 a month, Pro $100 a month, and Scale $500 a month, with extra status pages at $20 a month each.
7. Site24x7
Best for: Teams that want many checking locations and more modules without a custom quote.
Type: Commercial SaaS, part of the ManageEngine portfolio.
Rating: G2 4.6/5, Gartner Peer Insights 4.7/5
Site24x7 covers the widest geography on this list. It checks from more than 130 cities across six continents, with intervals down to 10 seconds on paid plans. For a business whose customers are spread across regions, that spread is the reason to look.
The catalogue reaches well past website monitoring into APM, database monitoring, security scanning, and log management.
That breadth is the reason it shows up on Pingdom shortlists at all, since one account can absorb jobs that would otherwise need three vendors.
Pros
- Location coverage exceeds Pingdom's, at published prices.
- One vendor covers website, infrastructure, application, and log monitoring.
- Entry pricing is low enough to trial without a procurement conversation.
Cons
- Pricing is modular, so the quote climbs quickly once several modules are on.
- The breadth of the interface takes longer to learn than a single-purpose checker.
- Deployment is SaaS only, which rules it out where data has to stay on-premises.
Pricing: Free plan up to 50 monitors. Website monitoring from $9 a month, with other modules priced separately and a 30-day trial on paid plans.
8. Datadog Synthetic Monitoring
Best for: Teams already running Datadog who want synthetic checks in the same account.
Type: Commercial SaaS, one module of a wider platform.
Rating: G2 4.4/5, Gartner Peer Insights 4.6/5
Datadog Synthetic Monitoring works as a Pingdom replacement mainly when Datadog is already in the building. Checks correlate with APM traces, so a failed browser test links straight to the backend request that caused it.
Billing works on test runs rather than monitors, which changes how you think about frequency. A browser test is roughly twenty-four times the unit cost of an API test, so the two get budgeted very differently.
Teams usually end up running API tests often and browser tests only on the flows that earn money.
Pros
- Synthetic results sit next to traces, logs, and infrastructure metrics already in the account.
- API test pricing is inexpensive at moderate volume.
- Private locations bring internal endpoints into scope without a surcharge.
Cons
- Per-run billing makes a high-frequency browser test costly fast, since a one-minute check is over 43,000 runs a month.
- Synthetics is one SKU among many, and the platform bill grows on several axes at once.
- Adopting Datadog only for uptime checks is a large commitment for a small job.
Pricing: API testing from $5 per 10,000 test runs a month, and browser testing from $12 per 1,000 test runs a month, billed annually.
9. Uptime.com
Best for: Teams that need SLA evidence and deep transaction checks at a published price.
Type: Commercial SaaS.
Rating: G2 4.6/5. No dedicated Gartner Peer Insights listing.
Uptime.com is the closest feature-for-feature match to what Pingdom sells, and it runs a probe network of comparable size. A team migrating across would recognize most of the interface within an afternoon.
It also splits its catalogue the way Pingdom does, which is worth knowing before you migrate. Basic Checks cover HTTP and HTTPS, SSL, domain blacklist, malware, WHOIS expiry, SSH, TCP, UDP, ICMP, DNS, ping, NTP, IMAP, POP, and SMTP.
Advanced Checks cover API monitoring, synthetic transactions, page speed, webhooks, heartbeats, and group checks. If you left Pingdom over the Advanced Check ceiling, the same shape of limit waits here at a different rate.
Pros
- Fifteen basic check types cover far more than HTTP alone.
- Long transaction timeouts suit slow multi-step flows that shorter limits cut off.
- SLA reports are designed to be shown to a customer, not just an engineer.
Cons
- The Basic and Advanced Check split repeats the constraint that pushes teams off Pingdom.
- There is a 30-day guarantee rather than a free trial, so evaluation starts with a payment.
- No free tier, unlike most of the tools above it in this list.
Pricing: Website monitoring from $9 a month, or $108 a year with the annual discount. Real user monitoring is priced separately.
10. SolarWinds Observability Digital Experience
Best for: Pingdom customers who would rather take the vendor's upgrade path than change suppliers.
Type: Commercial SaaS, the successor product to Pingdom.
Rating: Gartner Peer Insights 4.1/5. No published G2 score for the SaaS product.
SolarWinds Observability Digital Experience is where SolarWinds is moving Pingdom accounts, and that alone earns it a place on the shortlist.
It covers HTTP and HTTPS availability, TCP and ping checks, synthetic transaction monitoring, and real user monitoring. Separate uptime, transaction, page speed, and RUM screens become one view per site.
Pricing keeps Pingdom's units, uptime checks and pageview blocks, at a lower headline rate, and SolarWinds tells migrating customers their payment plan will not change.
The costs that do land are operational rather than financial. Historical data stays behind, RUM snippets need replacing, probe allow-lists need updating, and the alert sender address changes.
Pros
- The shortest route for a team that likes Pingdom and wants to keep the workflow.
- Longer metric retention than Pingdom offers.
- Uptime, transaction, page speed, and RUM data finally sit in one place.
Cons
- Historical data does not transfer, and the migration runs once with no repeat.
- Every RUM snippet has to be replaced site by site.
- Event data is kept for one month, which is short for post-incident review.
- It rebuilds the same external-only scope, so the diagnostic gap stays where it was.
Pricing: $10 a month per 10 uptime checks or 2 transaction checks, and $10 a month per 100,000 pageviews, on annually billed contracts.
Are the Free Pingdom Alternatives Good Enough?
Free Pingdom alternatives are good enough for a small estate where five minutes of unnoticed downtime costs nothing.
UptimeRobot has the most generous hosted free plan, at 50 monitors on five-minute checks, and Uptime Kuma drops the limits entirely if you host it yourself. Two gaps decide whether that holds for you.
Check interval is the first one. A five-minute check means an outage can run for five minutes before anyone hears about it.
At that interval the arithmetic of five nines uptime stops working, because the whole annual downtime budget is about five minutes. Faster intervals are the main thing paid plans sell.
The second is who carries the risk when monitoring itself fails. A self-hosted checker sits on a server you patch and back up, and nobody is on call for it but you. The hosted free tiers are also narrower than they look.
Better Stack gives 10 monitors, Site24x7 allows up to 50, Checkly caps browser runs at 1,000 a month, and OpenStatus allows one monitor at 10-minute intervals.
What Happens If You Stay With SolarWinds?
Staying with SolarWinds means moving to SolarWinds Observability Digital Experience, because that is the path SolarWinds documents for Pingdom accounts. The migration runs account by account rather than on a published deadline.
According to the migration guide, SolarWinds copies your Pingdom account and gives you 30 to 60 days running both. The original then moves to read-only.
The document is direct about the endpoint: "at the end of approximately 90 days, you will no longer use Pingdom." Billing transfers at the amount you pay today.
Three details are worth planning around. Historical data stays in the old account, so export it yourself if you need it. Every RUM snippet has to be updated before real user data resumes.
Probe IPs change, so allow-lists and firewall rules need revisiting, and alert emails start arriving from a new sender.
How Do You Choose the Right Pingdom Alternative?
Match your situation to a starting point rather than comparing all ten. The table below maps the common reasons teams leave Pingdom to the tool that answers each one.
Situation | Start With | Why |
You only need to know when a page is down | UptimeRobot | Fifty free monitors cover most small estates with no bill at all |
Alerts fire but nobody owns them | Better Stack | On-call scheduling and escalation come with the product, not as a second purchase |
You want no vendor and no subscription | Uptime Kuma | MIT licensed, with unlimited monitors on your own server |
Your team writes tests already | Checkly | Playwright checks live in the repository and run before a release ships |
Monitoring should live in Terraform | OpenStatus | Monitors and status pages are declared as HCL and reviewed like other infrastructure |
Customers are spread across continents | Site24x7 | More than 130 checking cities at published prices |
Datadog is already your platform | Datadog Synthetic Monitoring | Synthetic failures link straight to the traces that explain them |
You owe customers SLA evidence | Uptime.com | SLA reporting and long transaction timeouts built for external commitments |
You want the shortest possible move | SolarWinds Observability | The vendor migrates the account and holds your current price |
You need to know why, not just whether | Motadata ObserveOps | Checks sit beside the metrics, logs, and traces that explain a failure |
One question settles most of the shortlists we see. If your last three incidents were fixed the moment you knew about them, a cheaper checker will do. If they took hours to diagnose after the alert, the alert was never the problem.
When Is Pingdom Still the Right Choice?
Pingdom still fits a specific case, and it is worth saying plainly before you migrate anything. Say you watch a handful of public URLs, need results from many countries, and have no interest in what runs behind those URLs. Pingdom does that job with very little setup.
Public status pages are included on every plan and take about ten seconds to configure. The second check on every incident cuts false alarms.
Alerts can be delayed by up to an hour or resent four times, which suits teams that want fewer interruptions.
The reasons we see teams move are structural rather than technical. The two-meter model gets expensive as the footprint grows. The Advanced Check allocation limits transaction and page speed testing.
The account is on a path toward a different product. If none of those apply to you, staying put is a defensible call.
Replace Pingdom With Motadata ObserveOps
Pingdom answers one question well. Can a visitor reach your site right now? That question matters, and for teams with simple applications it may be the only one they need answered.
Motadata ObserveOps answers the next one. Checks across eleven protocols sit in the same platform as server metrics, logs, network flows, and traces, so a failed check arrives with the context that explains it.
Checks run from collectors you place, which reaches internal endpoints no public probe can see. Uptime then feeds SLO reporting with breach warnings before the window closes.
We would not put it in front of everyone. A team watching five public URLs on a small budget should take UptimeRobot and spend the difference elsewhere. Start a free ObserveOps trial and run it against your real URLs for a week.
FAQs
Is Pingdom being discontinued?
Pingdom has not been discontinued and is still sold today. SolarWinds does publish a migration guide moving accounts to SolarWinds Observability Digital Experience, which it calls the next generation of Pingdom. Migrated accounts stop using Pingdom after roughly 90 days.
Is UptimeRobot better than Pingdom?
UptimeRobot is cheaper and simpler, with 50 free monitors, but it has no real user monitoring and thinner transaction checks. It is better if you only need uptime alerts. It is worse if you rely on Pingdom's page speed or RUM data.
Can you replace Pingdom's real user monitoring?
Yes, though fewer tools cover it. Site24x7, Datadog, SolarWinds Observability, and Motadata real user monitoring all collect front-end data. UptimeRobot, Uptime Kuma, and OpenStatus do not, so those replace only the synthetic half.
How many monitoring locations do you actually need?
Most teams need two or three regions where their customers are. Large location counts help when you sell across continents or debug regional routing. For a single-country audience, check frequency matters far more than the number of probes.
Is Motadata ObserveOps a good Pingdom alternative?
It fits teams that need availability checks and root cause in one platform, with eleven check types and SLO reporting. It is a poor fit if you want a hosted checker running in minutes, or global probe coverage without deploying collectors.
Author
Ramya Shah
Technical Writer
Ramya Shah is a technical content writer with a computer engineering background and roots in automotive journalism. He covers IT Service Management, observability, IT operations, and AI-driven automation. An early adopter of AI-assisted writing workflows, he turns complex IT processes into clear, engaging content optimized for search and answer engines (AEO), lifting content output and organic visibility.