10 Top Website Monitoring Tools for Uptime, Page Speed and Real User Data
Your uptime tool reports the site as available all month. Support reports something else, because customers in one region spent the morning unable to complete a checkout. Both records are accurate, and that is the problem.
An external check confirms the page answered. It cannot tell you that the answer took nine seconds for everyone routed through one CDN edge, or what caused the delay. Most teams meet that limit during an incident, then buy a second tool to cover it.
Website monitoring tools are usually compared on check frequency and probe count, the easiest specifications to line up and the least likely to decide the purchase. Two other questions do: whether an alert reaches a cause or only a person, and where the platform is allowed to run, which is what separates a point tool from broader observability tools. Seven of the ten here are SaaS-only, which decides the shortlist for anyone under data localization rules.
This guide compares ten platforms on coverage, deployment, verified pricing and screenshot-verified ratings, then maps each buying situation to a specific pick. It also names the point at which a free tool is the correct answer, and the three conditions that change it.
Our Top Three Picks at a Glance
Three website monitoring tools cover most buying situations, and the right one depends on what an outage costs your business.
Best for organizations carrying availability commitments: Motadata ObserveOps, which watches the page, the application behind it and the infrastructure under both, on-premises or in the cloud.
Best for small portfolios on no budget: UptimeRobot, whose free plan covers 50 monitors at five-minute intervals without a card.
Best for teams that need the alert to reach someone: Better Stack, which pairs 30-second checks with on-call scheduling and status pages in one subscription.
What Are Website Monitoring Tools?
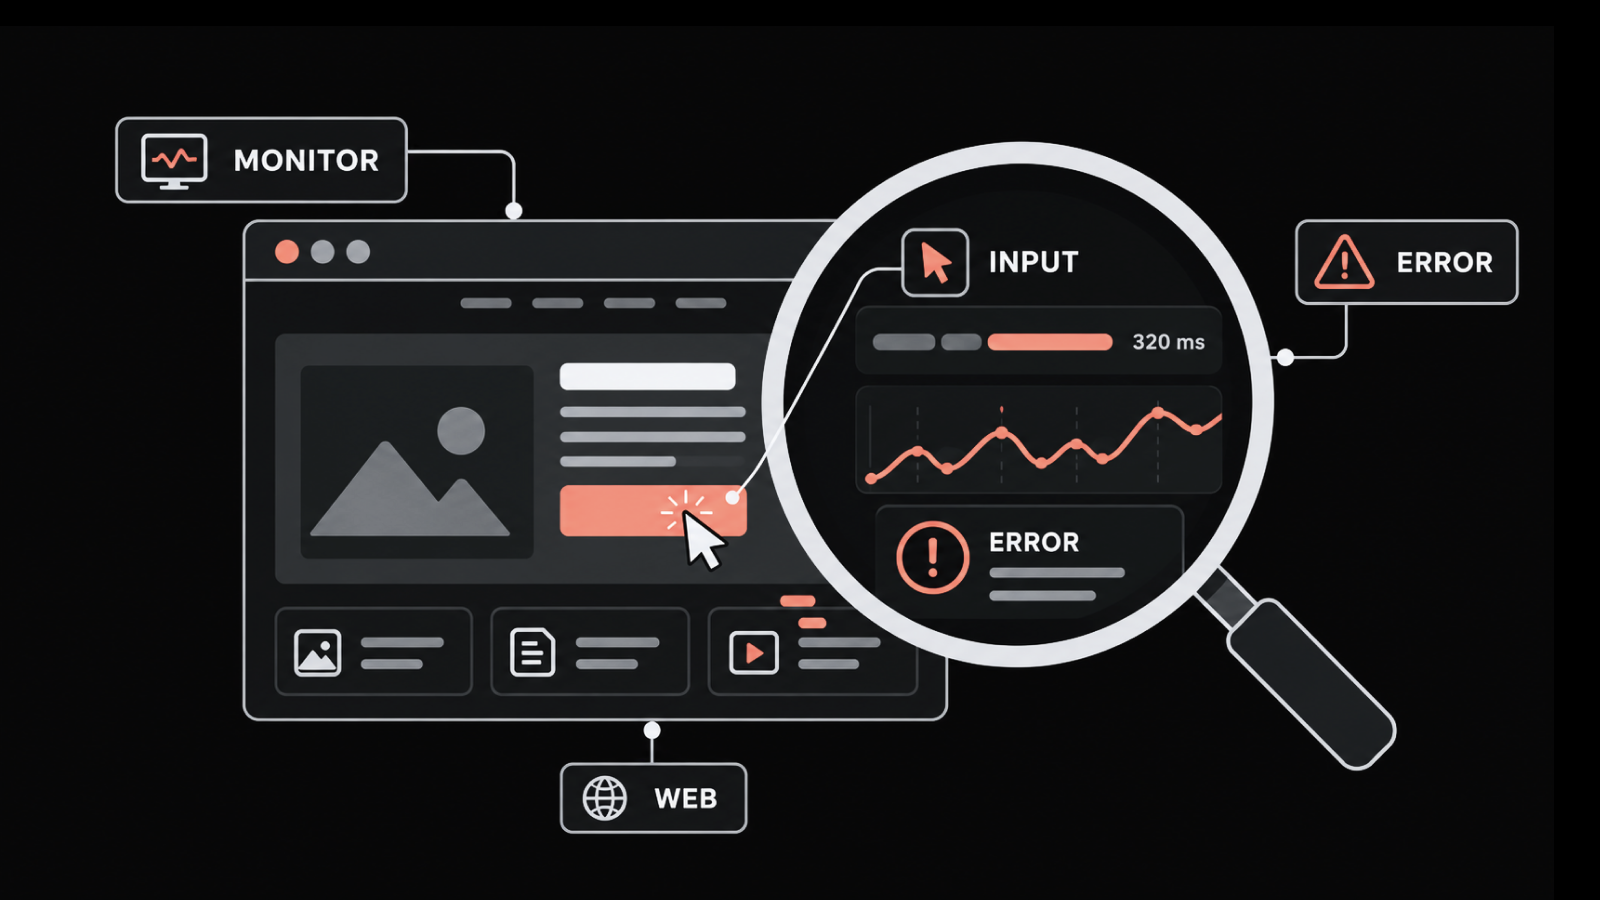
Website monitoring tools check whether your site is reachable, how fast it responds and whether revenue-critical journeys still complete. Website monitoring software falls into four categories that buyers routinely conflate, and each answers a different business question.
Uptime and availability checks: An HTTP monitoring tool requests a URL, IP or port on a schedule and records the response. This is the cheapest form of website monitoring and answers one question well
Synthetic transaction monitoring: A scripted browser walks through login, search and checkout from global locations, catching broken flows on pages that still return a healthy status code. Our guide to synthetic monitoring covers how those scripts are built
Real user monitoring: A JavaScript agent reports what visitors experienced, sliced by browser, device and geography. Google treats a Largest Contentful Paint under 2.5 seconds as good and above 4.0 seconds as poor
Full-stack observability: The external check becomes one signal among traces, logs and infrastructure metrics, correlated so a slow page resolves to the query causing it
Most teams buy the first category, then buy the fourth after an incident nobody could explain. That second purchase is the cost of choosing on price alone. Our comparison of RUM and synthetic approaches covers where each one earns its place.
How We Evaluated These Website Monitoring Tools
We scored every website monitoring service against five factors, each tied to a cost the business absorbs when the tool falls short.
Check depth and coverage: How many separate subscriptions the platform removes from your renewal list
Where the alert ends: Whether it stops at a notification or carries toward a cause, which decides the engineering hours spent per incident
Deployment and data residency: SaaS-only or self-hosted, which settles audit exposure before features matter
Pricing transparency: Whether finance can model the two-year cost from the published page
Diagnostic reach: How much of the investigation the tool completes, which is what shortens time to reduce MTTR
What we did not test: We did not run each platform for a quarter, so long-run probe reliability, false-positive rates under load and support responsiveness at renewal are outside this comparison. We also did not negotiate enterprise contracts, and list rates on consumption-priced platforms differ from what large buyers pay.
Website Monitoring Tools Compared at a Glance
This table compares all ten website monitoring tools on coverage, deployment, free tier and verified pricing.
Tool | Best For | What It Monitors | Deployment | Free Tier | Pricing | G2 Rating |
Motadata ObserveOps | Availability tied to the infrastructure behind it | URL, ping, port, DNS, domain, SSL certificates, real user experience, application traces, servers, network | On-premises, cloud or hybrid | No, 30-day trial | Quote based | 4.7/5 |
UptimeRobot | Free and low-cost uptime checks | HTTP, keyword, ping, port, API, UDP, DNS, SSL, domain expiry | SaaS | Yes, 50 monitors | From $12/month annual | 4.7/5 |
Site24x7 | Broad coverage on a small budget | Uptime, page speed, synthetic transactions, real user monitoring, DNS, SSL, servers | SaaS | Yes, 50 resources | From $9/month annual | 4.6/5 |
Pingdom | Page speed and multi-step transaction checks | Uptime, page speed, transactions, real user monitoring | SaaS | No, 30-day trial | From $16.50/month annual | No reviews |
Better Stack | Uptime with on-call and status pages | Uptime, keyword, TCP/UDP, DNS, SSL, Playwright transactions, heartbeats | SaaS | Yes, 10 monitors | From $29/license/month annual | 4.8/5 |
Checkly | Monitors defined and versioned as code | Uptime, API checks, Playwright browser checks, SSL, DNS, traceroute | SaaS with private locations | Yes, 10 monitors | From $24/month annual | 4.6/5 |
Uptime Kuma | Self-hosted uptime monitoring | HTTP, TCP, ping, DNS, keyword, certificate expiry | Self-hosted only | Free and open source | Free | Not listed |
Datadog | Organizations already paying for Datadog | Synthetic API and browser tests, real user monitoring, plus the full platform | SaaS | Yes, five hosts | From $15/host/month annual | 4.4/5 |
New Relic | Browser performance priced by data volume | Synthetic checks, browser monitoring, Core Web Vitals, plus the full platform | SaaS | Yes, 100 GB/month | Ingest plus user based | 4.4/5 |
Dynatrace | Complex enterprise environments | Synthetic checks, real user monitoring, plus the full platform | SaaS and managed | No | From $1 per 1,000 checks | 4.5/5 |
Top Website Monitoring Tools Reviewed
Each of these ten website monitoring tools is reviewed on what it covers, what it costs and where a different platform would serve you better.
1. Motadata ObserveOps
Best for: Organizations that need the page, the application and the infrastructure under both in one platform
Rating:
G2 - 4.7/5
Gartner Peer Insights - 4.6/5
Capterra - 4.7/5
This is our own platform, so read the considerations below accordingly.
ObserveOps treats the website as one layer of a service. Service checks cover URL, ping, port, DNS, domain expiry and SSL certificate validity, so the four most common causes of an unreachable site are watched alongside the site itself.
What separates it from the uptime tools here is what happens after the alert. Traces break each request into spans across database calls, so a slow page resolves to the query behind it. Deployment runs on-premises, in the cloud or hybrid, with high-availability failover across geographic sites.
Pros
- One platform replaces separate uptime, frontend, application and infrastructure subscriptions
- Alerts carry into dependency maps and correlated telemetry instead of stopping at a notification
- Deployment choice covers organizations whose telemetry cannot leave their jurisdiction
- Automated runbooks attach ping and traceroute diagnostics to new monitors without configuration
Cons
- Pricing is quote based, so budgeting requires a conversation with sales
- Value concentrates where consolidation matters, so a small marketing site portfolio will not use most of it
- Deployment mode is decided at the start, since it is not a setting to change later
Pricing:
Licensing: Quote based, scoped to the environment and deployment mode
Rate card: No published per-device pricing
Trial: 30-day free trial
2. UptimeRobot
Best for: Small portfolios where the only question is availability and the budget is near zero
Rating:
G2 - 4.7/5
Gartner Peer Insights - 4.7/5
Capterra - 4.8/5
UptimeRobot has been the default free website monitor since 2010, and the free plan is why. Fifty monitors at five-minute intervals, covering HTTP, port, ping, keyword, API, UDP, DNS, SSL and domain expiry, costs nothing.
The paid tiers hold a quirk worth knowing. Solo costs more than free and includes ten monitors instead of fifty, because what you buy is the 60-second interval. Diagnosis stops at the check result, since the tool never sees the backend.
Pros
- The most capable free plan among the best free website monitoring tools
- Setup takes minutes and requires no specialist skill
- SMS and voice credits are bought once as a top-up, with no recurring uplift
- SOC 2 compliant with a published data processing addendum
Cons
- No application or infrastructure visibility, so investigation happens elsewhere
- Login seats cost $15 to $19 per person per month on top of the plan
- Five-minute free intervals mean a short outage can resolve before you hear about it
Pricing:
Free: 50 monitors at five-minute intervals, no card required
Solo: $13 per month, or $12 billed annually, for 10 monitors at 60 seconds
Team: $46 per month, or $39 billed annually, for 100 monitors at 30 seconds with three login seats
Scale: $98 per month, or $79 billed annually, for 200 monitors at 15 seconds
Enterprise: Quoted
Guarantee: 14-day money-back on new subscriptions
3. Site24x7
Best for: Teams wanting uptime, page speed, transactions and real user data under one bill
Rating:
G2 - 4.6/5
Gartner Peer Insights - 4.5/5
Capterra - 4.7/5
Site24x7 covers more of the website monitoring surface for the money than anything else here. Uptime checks, page speed, scripted transactions, real user monitoring, DNS, SSL and domain checks arrive in one plan alongside server monitoring.
A naming change matters for procurement. ManageEngine moved its observability line under the OpManager Nexus brand, and Site24x7 now leads with website and digital experience monitoring. Confirm which product a quote covers before signing.
Depth per capability is the trade. Anomaly detection, forecasting and event correlation are reserved for Enterprise.
Pros
- The broadest capability set at this price point on the list
- Free plan covers uptime monitoring for up to 50 resources
- Global probe coverage suits genuinely distributed audiences
- Monitor allocations are published, so plan fit is calculable before buying
Cons
- Anomaly detection, forecasting and event correlation are gated to Enterprise
- SaaS only, with no self-hosted option under the Site24x7 name The Nexus rebrand introduces uncertainty about which product a quote co
- The Nexus rebrand introduces uncertainty about which product a quote covers
Pricing:
Lite: $10 per month, or $9 billed annually, for two servers and five websites
Professional: $49 per month, or $42 billed annually, for five servers, 20 websites and 10 network components
Enterprise: From $625 per month billed annually
Free plan: Uptime monitoring for up to 50 resources
Trial: 30 days
Note: Confirmed on the live pricing page with the OpManager Nexus banner in place
4. Pingdom
Best for: Page speed analysis and multi-step transaction checks on commerce flows
Rating:
Capterra - 4.5/5
Pingdom has run website checks since 2007 from more than 100 global locations, a longer operating record than most of this list combined. Under SolarWinds it splits into two purchases: Synthetic Monitoring for scheduled checks, and Real User Monitoring for visitor-side data.
Transaction monitoring is why teams still choose it. You script login, search and checkout, and Pingdom runs the flow from real browsers, alerting when a step breaks. Infrastructure and log visibility remain separate purchases, covered in our SolarWinds alternatives comparison.
Pros
- Mature transaction scripting with a long operating record behind the probe network
- Page speed reporting is readable by non-specialists, which helps marketing teams
- Unlimited users on synthetic plans avoids per-seat inflation
- Check allocations scale in defined steps up to 30,000 uptime checks
Cons
- No application, log or infrastructure visibility without further SolarWinds products
- Advanced checks are allocated at a far lower ratio than uptime checks
- Real user monitoring is billed separately by pageviews, and there is no free plan
Pricing:
Synthetic Monitoring: From $16.50 per month, or $198 per year, for 10 uptime checks, one advanced check and 50 SMS alerts
Real User Monitoring: From $16.50 per month, or $198 per year, for 100,000 pageviews
Both products together: $396 per year at entry volume
Scaling: Synthetic tiers run to 30,000 uptime checks with 2,500 advanced checks, and pageview tiers run to one billion
Trial: 30 days, covering both products
5. Better Stack
Best for: Teams that want the check, the page and the incident workflow in one subscription
Rating:
G2 - 4.8/5
Gartner Peer Insights - 4.9/5
Capterra - 4.8/5
Better Stack answers a question older uptime tools leave open: who gets woken up, and what happens next. On-call scheduling, escalation, incident timelines and post-mortems are part of the product.
Checks run to 30-second frequency across HTTP, keyword, TCP and UDP ports, DNS, SSL and TLD expiry, with traceroute diagnosis and error screenshots attached to failures.
Pricing is where buyers should slow down. The headline is a per-responder license, and the bill assembles from that license plus monitor packs, status page features and telemetry volume.
Pros
- The strongest incident response workflow of any dedicated tool here
- Unlimited team members at no cost, with charges applying only to responders
- Log management and tracing available on the same platform for consolidation
- A 60-day money-back guarantee, considerably longer than the category norm
Cons
- Modular pricing makes the total bill difficult to forecast before deployment
- Status page features competitors include are priced individually, and white-labeling is expensive per page
- SaaS only, and not HIPAA compliant, which rules it out for some healthcare buyers
Pricing:
Free: 10 monitors and heartbeats plus one status page, for personal projects
Responder license: $34 per month, or $29 billed annually, per license
Additional monitors: $25 per 50 per month, or $21 billed annually
Playwright transactions: $1 per 100 browser minutes
Enterprise: Quoted
Guarantee: 60-day money-back on paid plans
6. Checkly
Best for: Development teams that want monitors versioned alongside the application
Rating:
G2 - 4.6/5
Checkly treats monitoring as code. Checks are written as Playwright scripts in TypeScript, stored in your repository, reviewed like any other change and deployed through the CLI, Terraform or Pulumi.
Uptime monitoring covers HTTPS, TCP, DNS, ICMP, SSL/TLS, gRPC, traceroute and heartbeat checks. The distinctive capability is the browser check, which runs a real Chromium session and validates that the journey completed end to end.
Private locations on the Team plan let checks run inside your own infrastructure, which matters for internal services that never touch the public internet.
Pros
- The clearest fit here for teams already practicing infrastructure as code
- Reusing existing Playwright tests as monitors removes duplicated scripting hours
- Visual regression testing catches layout changes functional checks miss
- SOC 2 Type II certified with multi-factor authentication on all plans
Cons
- Check-run billing means frequency and location count drive the bill unpredictably
- Browser check overages are charged per 1,000 runs and become the dominant line item
- Requires engineering skill to operate, and status pages and root cause analysis are separately priced modules
Pricing:
Hobby: Free, with 10 uptime monitors, 1,000 browser runs and 10,000 API runs per month
Starter: $24 per month billed annually, for 50 monitors, 3,000 browser runs, 25,000 API runs and three users
Team: $64 per month billed annually, for 75 monitors at 30-second frequency, 22 locations and 10 users
Additional monitors: $8 per block of 25
Enterprise: Quoted
Note: Status pages and AI root cause analysis are separately priced modules
7. Uptime Kuma
Best for: Teams that want uptime monitoring on their own hardware with no vendor relationship
Uptime Kuma is the self-hosted answer to UptimeRobot, and it is genuinely capable. HTTP, TCP, ping, DNS, keyword and certificate expiry checks, a clean dashboard and status pages deploy in a container within about ten minutes.
The economy is straightforward. Your expense is the server it runs on plus the maintenance hours, which for organizations that cannot send monitoring data to a third party is often the right trade.
The limitation is structural. A monitor inside your own infrastructure cannot report that your infrastructure is unreachable from outside, so most teams pair it with an external check.
Pros
- No license cost, no per-monitor charge and no ceiling on monitored endpoints
- Complete data control, which settles residency questions before they are raised
- Active community with frequent releases and broad notification support
- Interface quality is comparable to commercial tools
Cons
- Self-hosted monitoring cannot detect an outage that takes down its own host
- No global probe network, so regional performance differences go unseen
- Maintenance, upgrades and backups become your team's responsibility, with no support contract
Pricing:
License: Free and open source
Cost: The infrastructure it runs on and the hours to maintain it
8. Datadog
Best for: Organizations already paying for Datadog that want synthetic checks in the same interface
Rating:
G2 - 4.4/5
Gartner Peer Insights - 4.7/5
Capterra - 4.6/5
Datadog Synthetic Monitoring carries an obvious precondition: it makes sense when Datadog is already on your renewal list. API and browser tests run from managed or private locations, correlating with the traces, logs and metrics already flowing in.
That correlation is the argument. A failing checkout test links to the trace of the failing request, then to the log line and host that produced it. The cost model deserves scrutiny, since Datadog prices per product and every capability switched on multiplies the bill. Our Datadog alternatives guide covers where teams move when that happens.
Pros
- The tightest link between an external check and the telemetry explaining it
- An enormous integration catalog reduces custom instrumentation hours
- Private locations support checks against internal services
- Mature alerting with composite conditions and dependency-aware suppression
Cons
- Per-product pricing means the bill grows each time a capability is enabled
- Overage from custom metrics and indexed spans is the most common customer complaint
- SaaS only, so buying it purely for website monitoring is poor value against dedicated tools
Pricing:
Infrastructure Pro: $15 per host per month billed annually, or $18 on demand
Infrastructure Enterprise: $23 per host per month billed annually
APM: $31 per host per month when paired with an Infrastructure plan, or $36 standalone
Log ingestion: $0.10 per GB
Synthetic monitoring: Priced as a separate product by test run volume
Free tier: Five hosts with one-day metric retention
9. New Relic
Best for: Teams wanting browser performance inside a platform priced by data volume
Rating:
G2 - 4.4/5
Gartner Peer Insights - 4.6/5
Capterra - 4.5/5
New Relic's pricing model is why it appears on website monitoring lists. There are no per-host, per-agent or per-container charges, so you pay for data ingested and for the people needing full platform access.
The free tier is generous and permanent. One hundred gigabytes of monthly ingest, one full platform user, unlimited basic users and 500 synthetic checks, with no card and no expiry.
Browser monitoring reports Core Web Vitals, JavaScript errors and session traces connected to backend tracing. The single free platform seat is the constraint, since production teams generally need more than one person configuring alerts.
Pros
- The most usable permanent free tier among the full-stack platforms
- Ingest-based pricing scales predictably for infrastructure-heavy deployments Unlimited basic users means dashboards are shared without license cost
- Unlimited basic users means dashboards are shared without license cost
- Both user-based and compute-based pricing models are published openly
Cons
- Full platform seats become the dominant cost for larger engineering teams
- Log verbosity can consume the free 100 GB allowance within days on a busy application
- SaaS only, with EU data residency charged as a per-gigabyte add-on
Pricing:
Free: 100 GB monthly ingest, one full platform user, unlimited basic users, 500 synthetic checks
Data ingest: $0.40 per GB beyond 100 GB on original data, or $0.60 per GB on Data Plus
Standard: $10 for the first full platform user and $99 for each additional, capped at five
Pro: $349 per user per month on annual commitment, or $418.80 billed monthly
Core users: $49 per user per month
Additional synthetic checks: $0.005 each
10. Dynatrace
Best for: Large enterprises needing automated root cause analysis across a complex environment
Rating:
G2 - 4.5/5
Gartner Peer Insights - 4.6/5
Capterra - 4.6/5
Dynatrace is built for scale and priced accordingly. Automated dependency mapping discovers what talks to what without manual configuration, and its analysis engine attributes a performance problem to a cause.
For website monitoring, a failing synthetic browser check arrives with a probable cause attached. Multi-step clickpaths, HTTP monitors and real user monitoring feed the same model.
The consumption model is the barrier. Capabilities are billed per unit of usage against an annual commitment, which makes the total hard to model. Our Dynatrace alternatives comparison covers where teams go when the commitment does not fit.
Pros
- The most automated root cause attribution of any platform on this list
- Dependency mapping stays current as services change, with no maintenance hours
- Handles environment complexity that overwhelms simpler tools
- Available as SaaS or managed deployment for organizations needing more control
Cons
- Consumption pricing across several billing units is hard to forecast before deployment
- Annual commitments and support minimums place it out of reach for smaller buyers
- Substantial excess capability if website monitoring is the requirement, and no free tier
Pricing:
Model: Consumption based under the Dynatrace Platform Subscription, drawn against an annual pool
Synthetic browser monitor: $4.50 per 1,000 synthetic actions, billed at $0.0045 per action
Synthetic HTTP monitor: $1.00 per 1,000 synthetic requests, billed at $0.001 per request
Real user monitoring: $2.25 per 1,000 sessions, billed at $0.00225 per session
Real user monitoring with session replay: $4.50 per 1,000 sessions, billed at $0.0045 per session
Data retention: 35 days on synthetic monitors and real user monitoring
Other units: Host monitoring and log volume are billed on separate rate-card units
Trial: Available, with no permanent free tier
Do You Really Need a Dedicated Website Monitoring Tool?
For a large number of organizations the answer is no, and the best free website monitoring tools will cover you completely.
If you run a handful of marketing sites, the only question is whether they are reachable, and nobody is contractually exposed when one is down for six minutes, a free plan is sufficient. UptimeRobot covers 50 monitors, and Uptime Kuma covers unlimited monitors on a server you already own.
Three conditions change that calculation.
When the question becomes why: Once your team spends an afternoon establishing whether a slowdown came from the application, the database, the CDN or the network, an external check has stopped contributing. Understanding what real user monitoring captures is the usual next step
When the failure lives upstream: Sites go down because a certificate expired, a DNS record changed, a domain lapsed or an origin server ran out of memory. Coverage across certificates, DNS, domain expiry and web server monitoring turns an alert into a starting point
When uptime becomes contractual: Once availability appears in a customer agreement with a financial consequence, you need historical data you can defend against a five nines uptime commitment, correction for agreed maintenance windows, and a model of what a breach costs
What Should You Look for in a Website Monitoring Tool?
Six criteria separate a website monitoring tool that pays for itself from one that adds a line to the renewal list.
Check frequency matched to revenue exposure: A five-minute interval averages 2.5 minutes of unknown downtime per incident. Price that against 30-second checks for a checkout flow
Probe locations matched to your audience: Two well-placed locations outperform forty scattered ones. Global coverage only counts where your customers are
Coverage of the four upstream failures: Certificate expiry, DNS resolution, domain expiry and origin server health. A URL-only tool reports all four identically
A defined path from alert to owner: Native on-call scheduling or an integration into your service desk. An alert reaching an unattended inbox has not been delivered
Deployment that satisfies your compliance position: If telemetry cannot leave your jurisdiction, this filters the market before any feature comparison. The business case for website monitoring starts here
Pricing you can model for two years: Per-check, per-seat, per-host and per-gigabyte models behave differently as you grow
What Are Website Monitoring Best Practices?
These five website monitoring best practices reduce both incident cost and monitoring spend.
1. Set Check Intervals by Business Impact
Monitoring every URL at the same frequency overspends on low-value pages and under-protects revenue paths.
Tier one: Checkout, login and payment callbacks at 30 seconds or faster
Tier two: Search, product listings and account management at one to two minutes
Tier three: Marketing, documentation and archive pages at five minutes
2. Monitor the Four Upstream Failures as Assets
Certificate expiry, domain expiry, DNS resolution and origin server health cause outages that look identical from outside.
Separate monitors: Give each failure type its own check and its own alert
Certificate warnings: Fire at 30, 14 and seven days so procurement can act
Ownership: Assign each monitor to a named team with an escalation path
3. Alert on Percentiles Instead of Averages
An average response time hides the tail where your slowest customers abandon.
Set the threshold: Use p99 latency as the value that pages someone
Track the spread: Watch the distance between median and 99th percentile over time
Segment by geography: Regional tails often reveal a CDN or routing fault
4. Run Synthetic and Real User Monitoring Together
Synthetic checks give a consistent baseline, and real user data shows what visitors on unpredictable networks experienced.
Baseline with synthetics: Fixed locations and schedules make regressions detectable
Validate with real users: Compare against actual sessions by device and browser
Investigate divergence: A split between the two readings is usually the most informative signal
5. Treat the Status Page as a Monitored Dependency
Status pages hosted on the same infrastructure as the application go down with it, at the moment customers need them.
Host separately: Keep the status page off the infrastructure it reports on
Verify independently: Check it from outside your network on its own schedule
Test notifications quarterly: Confirm the subscriber path still delivers, and record it against any SLA penalty exposure
How Do You Choose the Right Website Monitoring Tool?
Choosing the right website monitoring tool comes down to two questions that carry more weight than check intervals or probe counts.
Where the alert ends: There is a material difference between a tool that sends a notification, a tool that pages the person on call, and a tool that correlates the failure with the traces, logs and infrastructure telemetry explaining it. Buying for detection and paying separately for diagnosis is the most common way monitoring budgets double.
Where the data can live: Of the ten tools here, seven are SaaS-only. For a bank, insurer, hospital group or public sector body under data localization rules, that removes seven options before features are discussed.
Motadata came at website monitoring from the infrastructure side, starting as network and server monitoring for organizations running their own data centers. That history is why service checks for URL, DNS, domain and certificates arrive alongside server metrics, network flows and application traces.
Lists of the best website monitoring tools 2026 buyers compare rank largely on interval speed, as do rankings of the best website uptime monitoring tools 2026 has produced and comparisons of the best website performance monitoring tools 2026 has surfaced. Map your own situation instead:
Fewer than 50 sites, availability only: UptimeRobot free plan, or Uptime Kuma if data must stay in-house
Uptime, page speed, transactions and real user data on a small budget: Site24x7
Ecommerce with revenue-critical multi-step flows: Pingdom for transaction depth, or Better Stack where on-call matters equally
A development team already running Playwright in CI: Checkly
Already paying for Datadog, New Relic or Dynatrace: Use the synthetic module you own before adding another subscription
Availability, experience and infrastructure correlated, or data residency obligations: Motadata ObserveOps
Connect Website Uptime to the Infrastructure Behind It with Motadata ObserveOps
If your website is a small number of pages, nobody is contractually exposed when one goes down, and your team has never had to establish whether a slowdown came from the application or the network, a free uptime checker is the right tool.
That situation tends not to hold. Motadata ObserveOps was built for the point after it changes, watching the URL alongside DNS, domain expiry and certificate validity, reporting Core Web Vitals from actual sessions, and resolving a slow page to the query behind it. It runs on your infrastructure or in the cloud, whichever your compliance position requires, which is what keeps availability evidence defensible when an agreement is tested.
FAQs
What are the best website monitoring tools for a small business?
For a small business monitoring a handful of sites, UptimeRobot's free plan covers 50 monitors at five-minute intervals at no cost. Site24x7 entry plans start under $10 per month billed annually if you also need page speed data. Move beyond these when diagnosis becomes the bottleneck.
Are free website monitoring tools good enough?
For availability monitoring on non-critical sites, yes. UptimeRobot's free plan and self-hosted Uptime Kuma both handle uptime checks, certificate expiry and notifications competently. They stop being sufficient when an outage carries a contractual cost, or when your team needs to know why a page slowed.
How is Motadata ObserveOps different from UptimeRobot?
It depends on your environment. UptimeRobot is a focused uptime service at a very low price, so for a small portfolio of marketing sites it may be all you need. ObserveOps watches the URL alongside DNS, certificates, application traces and the servers beneath, and runs on-premises where data cannot leave your infrastructure.
What should I check before buying a website monitoring tool?
Confirm that check frequency matches your revenue exposure and that probe locations match where your customers actually are. Check that certificate, DNS and domain expiry are covered, that every alert has a named owner, and that the deployment model suits your compliance position. Then model the price at the scale you expect in two years.
What is the difference between synthetic monitoring and real user monitoring?
Synthetic monitoring runs scripted checks from known locations on a fixed schedule, producing a consistent baseline that makes regressions detectable. Real user monitoring collects data from actual visitor browsers, capturing network and device variability you cannot simulate. Motadata ObserveOps runs both, so a divergence between them becomes a diagnostic signal.
Author
Poonam Lalani
Content Strategist
Poonam Lalani is a B2B content strategist and writer with a background in computer engineering and experience across enterprise technology domains, including AI, cloud, DevOps, data engineering, and IT operations. She specializes in creating research-driven content that simplifies complex ideas and supports product education, thought leadership, and business growth.