Security Observability: Pillars, Use Cases, and How It Works
When an alert lands, does your team already see the full story, or does the work start with pulling scattered data together from one tool after another? For many organizations it's the second one, where the incident itself takes a backseat while analysts hunt across dashboards. The evidence is right there, scattered across platforms that don't share context.
Security observability exists to close that gap. It draws on the data your systems already produce, the logs, metrics, traces, and events, and turns that into a way to keep the environment reliable, available, and secure while it changes. Think of the goal as a move from "we have data but can't use it" to "we can detect, investigate, and respond with context."
Monitoring answers the questions you defined in advance. Our breakdown of observability and monitoring shows how observability lets you ask new ones mid-incident, which is what you need when the threat is one nobody wrote a rule for.
This guide walks through what security observability is, the pillars it stands on, the use cases that make it worth doing, and how to put it in place without drowning your team in noise.
What Is Security Observability?
Security observability is the practice of gathering telemetry from across your systems and connecting it, so you can detect, investigate, and explain behavior that matters to security, including the new or unfamiliar threats that no rule or signature was built to catch. Rather than treating logs, metrics, traces, and events as separate feeds, it reads them as one connected picture, much like full-stack observability takes in a whole environment instead of a single layer.
Observability security asks a harder question than monitoring does. Monitoring asks whether a metric has crossed its threshold. Observability asks a broader question: given everything in view, does this behavior actually make sense?
That difference is what surfaces the quiet signals other tools skip past. A service account suddenly reading files it never opens. Traffic slipping out through a port that normally stays silent. A 3 a.m. login from a country no one on your finance team has ever worked in. None of those trip a fixed threshold. All of them show up when you can correlate signals across the stack.
How Is Security Observability Different From Security Monitoring?
Security monitoring watches for known problems. Security observability gives you enough context to understand unknown ones. Monitoring is the smoke detector. Observability is the ability to walk the building and figure out why there's smoke.
Both belong in a mature program. You want fixed alerts for the failure modes you understand, the kind threshold-based monitoring handles well, and observability for the incidents that don't announce themselves.
Is Security Observability the Same as a SIEM?
No, though the two overlap and often run side by side. A SIEM gathers security logs, checks them against correlation rules, and raises alerts for compliance needs and known threats. Security observability reaches wider. It also brings in performance and infrastructure telemetry, and it's designed for investigation that doesn't start from a fixed rule.
A SIEM is strong at "tell me when X happens." Observability is strong at "help me understand what just happened, even though I didn't predict it." Teams that run both feed observability context into their log management and SIEM layer, and use the SIEM's alerts as a starting point for deeper investigation.
Side by side, the three approaches split like this:
Attribute | Monitoring | Security Observability | SIEM |
Core question | Is it up or over threshold? | Does this behavior make sense? | Do events match a rule? |
Data used | Metrics, uptime checks | Metrics, logs, traces, events | Aggregated security logs |
Detects | Known failures | Known and unknown behavior | Rule and correlation matches |
Best at | Availability, performance | Investigation, root cause | Alerting, compliance reporting |
Weak spot | Blind to novel threats | Needs tuning and storage | Rule upkeep, alert noise |
Why Security Observability Matters Now
Security observability matters now because the environments teams defend have outgrown the tools watching them. Estates are more distributed, signals are more scattered, and the noise is louder than any analyst can read by hand.
The noise problem is measurable. In the 2025 SANS Detection and Response Survey, 73% of organizations named false positives as their single biggest detection challenge, and most run into them often. Real threats hide inside that flood.
Fragmentation makes it worse. A Gartner survey on security vendor consolidation put the figure at 75% of organizations paring down vendors, a jump from 29% two years before, with fragmented and poorly integrated stacks named as the main reason. More tools rarely means more clarity.
Three shifts widened the gap:
Distributed estates: hybrid and multi-cloud sprawl scatters signals across many tools, so no single console sees the whole picture
Attacks that blend in: trusted access and insider misuse don't cross fixed thresholds, so they pass as normal
Alert overload: volume buries the few signals that matter, which is where slow detection and long dwell times begin
Buying another dashboard rarely fixes any of this. Most teams already collect enough data; what they lack is correlation, the ability to line up a login, a config change, and a traffic spike as one story instead of three unrelated blips.
That's the payoff of getting it right: gain visibility across your environments to reduce the mean time needed to detect, alert, and remediate security incidents with security observability, and cut the MTTD that decides how much damage an intruder can do.
What Are the Pillars of Security Observability?
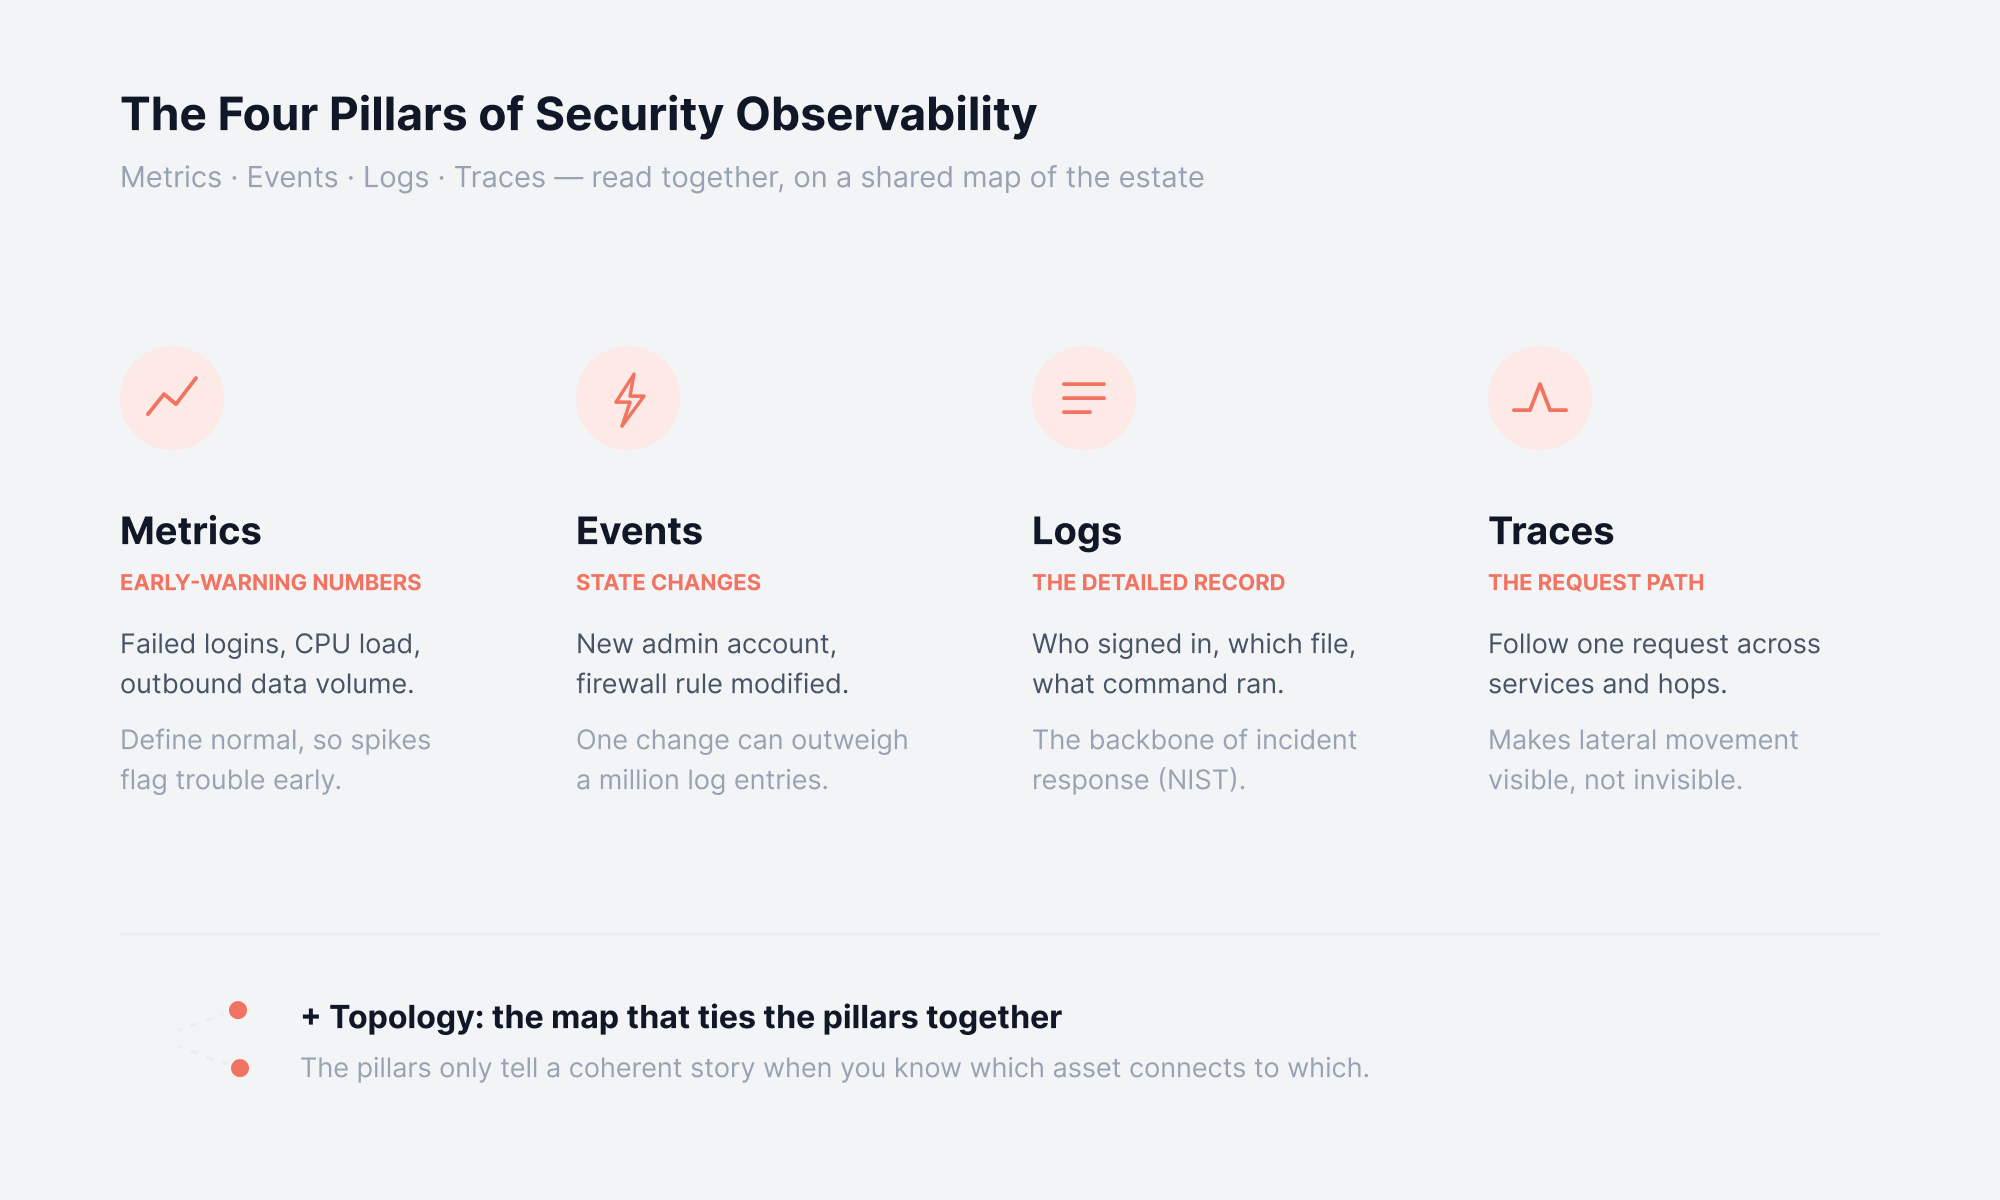
Four pillars hold up security observability: metrics, events, logs, and traces, a set often shortened to MELT. Each one answers a different question, and the value shows up when you read them together.
1. Metrics: The Early-Warning Numbers
Metrics are quantitative readings over time, like failed login counts, CPU load, or outbound data volume. They define what normal looks like, so a sudden spike in authentication failures flags trouble before anyone reads a log line.
2. Events: High-Signal State Changes
Events are meaningful changes: a new admin account, a modified firewall rule, a policy update. One unexpected privilege change can matter more than a million routine entries, which is why event correlation sits at the center of detection.
3. Logs: The Detailed Record
Logs record the specifics: who signed in, which file was opened, what command ran. Log monitoring takes that raw record and makes it searchable and traceable, and NIST's log management guidance still points to thorough logging as the backbone of incident response.
4. Traces: The Path a Request Takes
Traces follow a single request across services, showing where it went somewhere it shouldn't. This is what makes lateral movement visible instead of invisible, which matters most in distributed systems where an incident rarely stays in one place.
5. One more layer
Topology, the map of how systems depend on each other, ties the four together. The pillars only tell a coherent story when you know which asset connects to which.
How Does Security Observability Work?
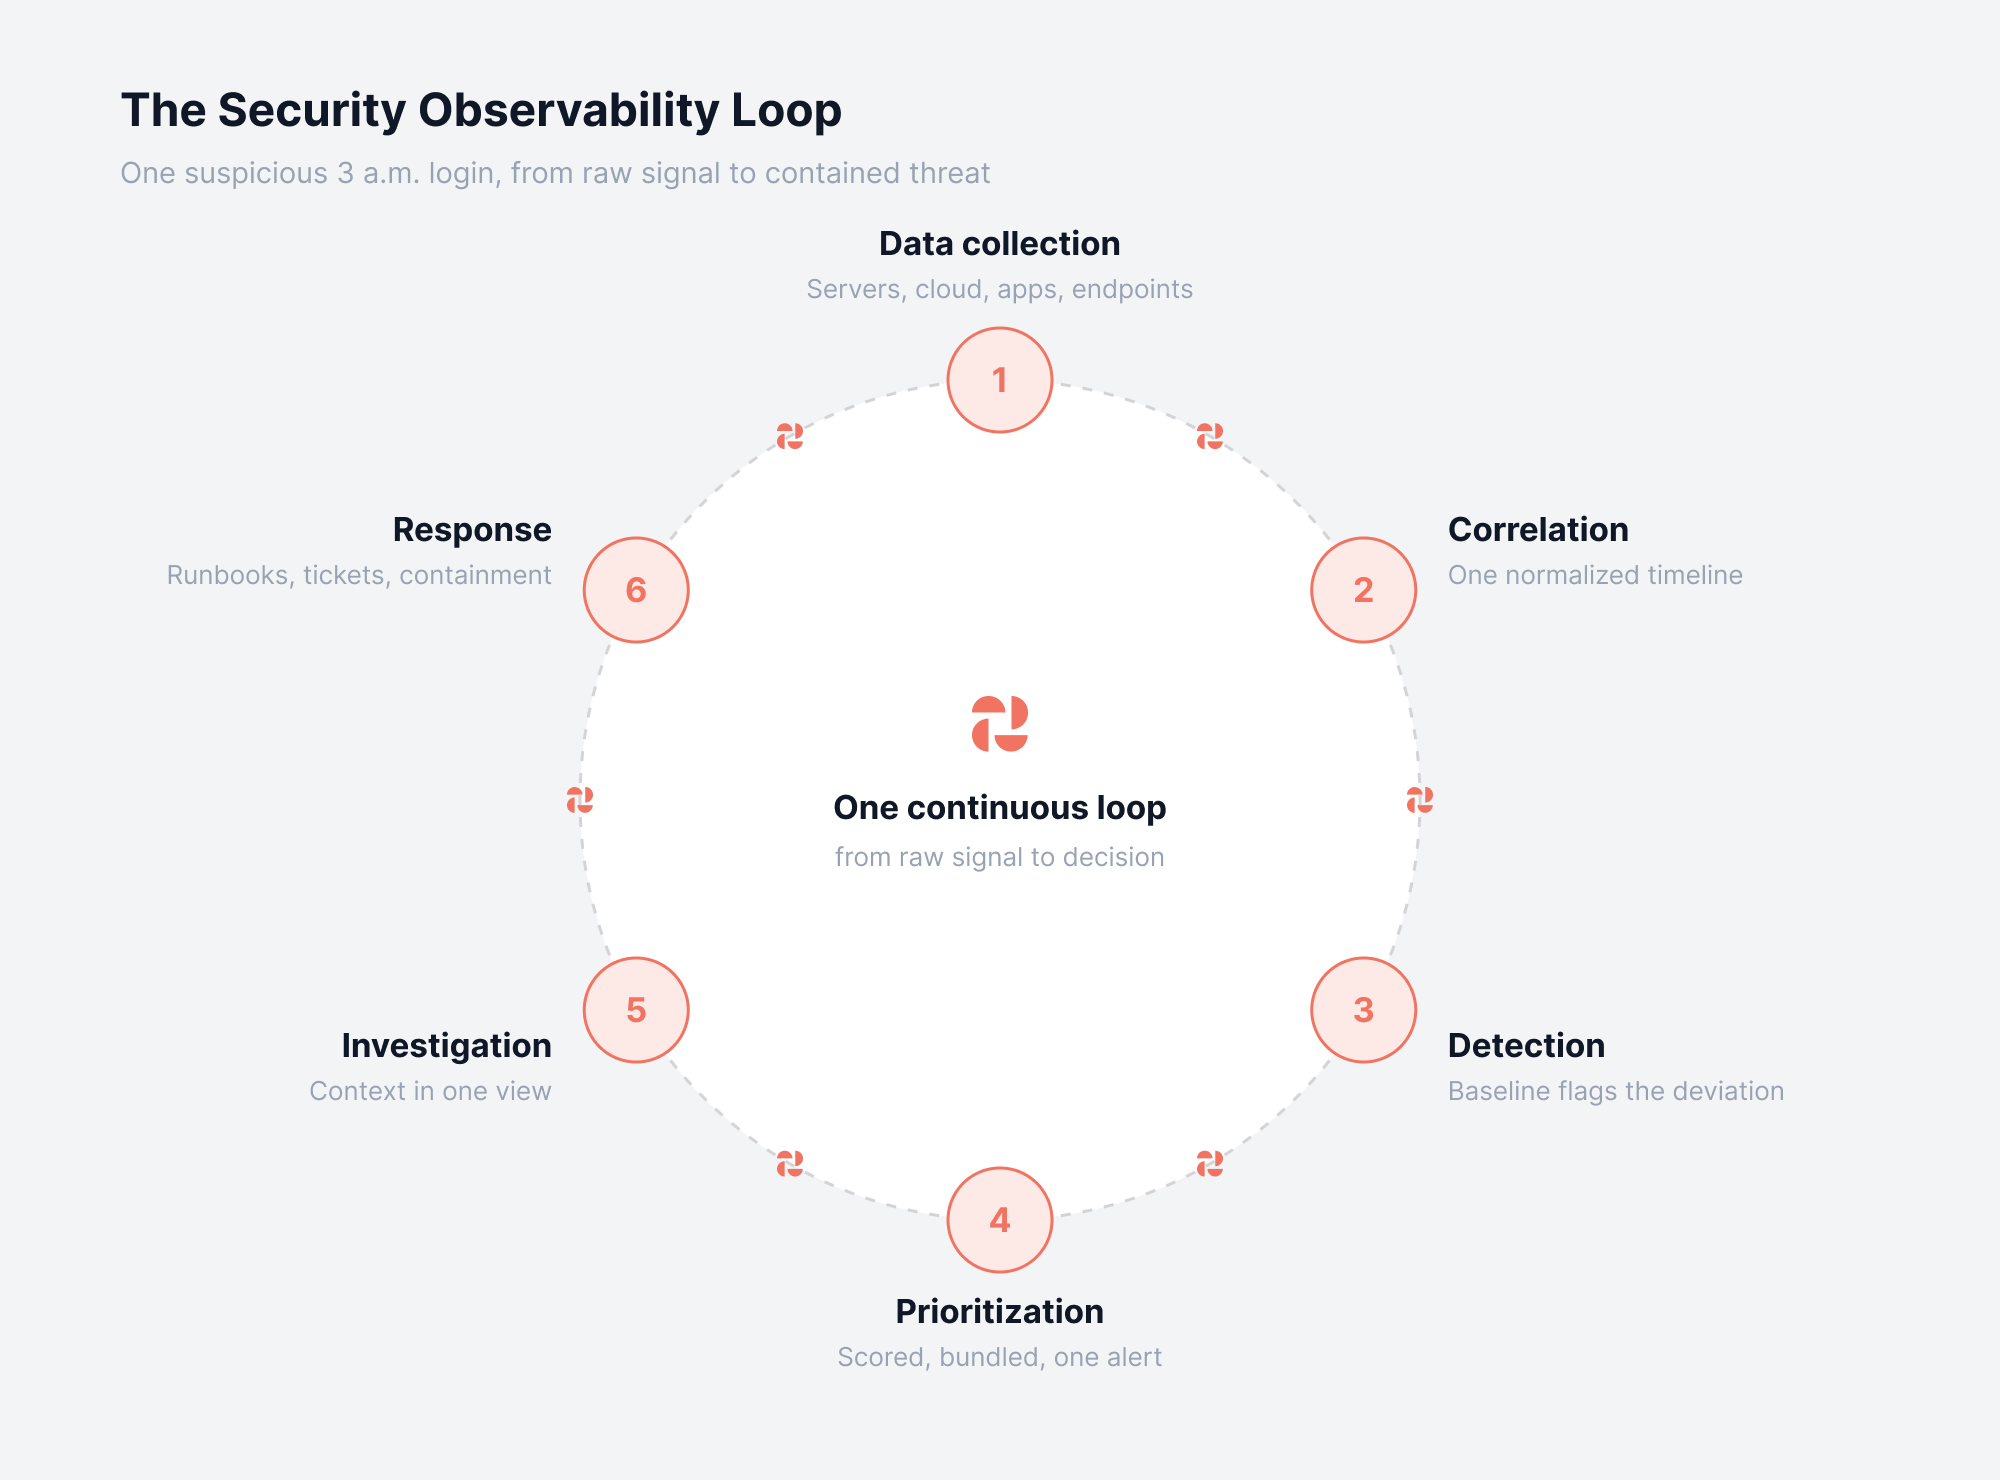
Security observability works by pulling data from across your systems, connecting the related pieces, and flagging what doesn't fit. Think of it as one continuous loop that takes raw signals and turns them into a decision. Here is what happens at each step, followed through a single suspicious login.
1. Data collection:
The platform pulls telemetry from every part of the estate that matters, across servers, network devices, cloud services, applications, and endpoints. For our example, that means capturing the 3 a.m. login, the files the account opens next, and the network traffic that follows.
2. Correlation:
Every source shows up in its own format, so the platform normalizes them and threads the related signals into a single timeline. The login, the file access, and the traffic now line up against one account at one moment, rather than scattered across three separate tools.
3. Detection:
Machine learning has already learned what normal looks like for that account, so it recognizes that a 3 a.m. login reading finance files is a departure from the baseline. So it raises the deviation, even with no fixed rule written for that case.
4. Prioritization:
From there, the platform scores that flag by risk and bundles it with related signals. An analyst ends up with one alert that means something, instead of a hundred low-value ones fighting for attention.
5. Investigation:
The analyst opens the alert and finds the surrounding logs, the request path, and the affected systems already in view, which makes root cause analysis a matter of minutes instead of hours.
6. Response:
Based on what the investigation shows, the team contains the threat, by revoking the session, opening a ticket, or running a remediation runbook, depending on the tools in place. The faster this step lands, the less an attacker can do.
The value is in the loop. Any single signal looks harmless on its own; connecting them is what turns scattered data into an early warning.
Security Observability Use Cases
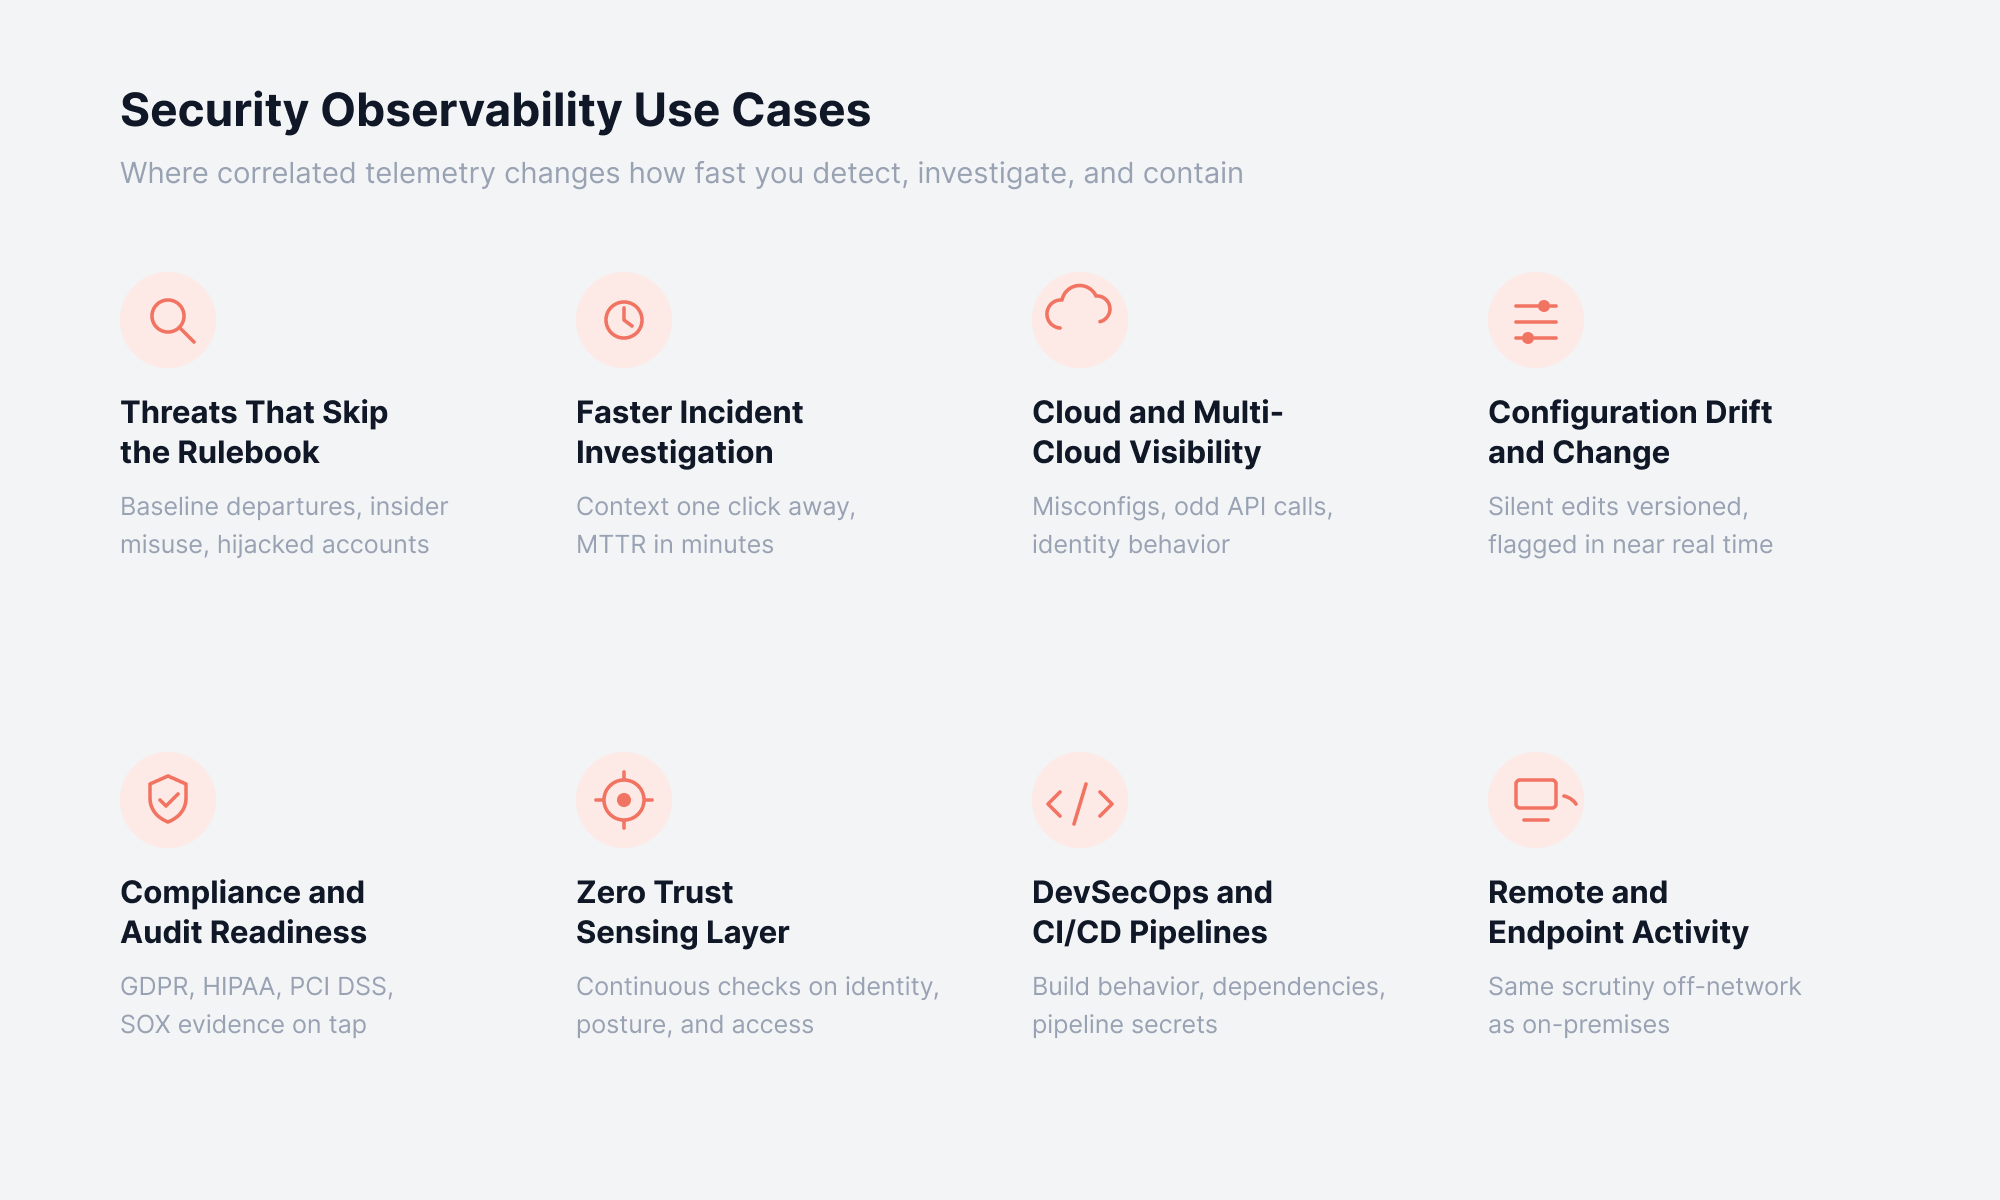
Security observability proves its value in specific situations. These are the ones where it changes how fast you detect, investigate, and contain a threat.
1. Detecting Threats That Skip the Rulebook
Signature-based tools catch what they've seen before. Security observability catches behavior that's simply wrong for the context, which is where modern threats live.
Why it matters: insider misuse, hijacked accounts, and advanced persistent threats seldom line up with a signature anyone has written
What it looks for: departures from the baseline, whether that's an odd access pattern, activity at strange hours, or east-west traffic that has no business existing
How it helps: anomaly detection brings the outlier to the surface, and correlation connects it to the signals around it
Concrete scenario: a backup service account starts reading finance shares at 2 a.m. On its own, that's one quiet log entry. Correlated with a new outbound connection and a spike in read volume, it becomes an obvious insider threat or account compromise worth waking someone for.
2. Investigating Incidents and Cutting MTTR
When something gets through, the clock starts. Security observability shortens the investigation from hours to minutes by keeping context one click away.
Why it matters: most of a breach lifecycle is dwell time, the stretch before anyone understands what's happening
What it provides: surrounding logs, request traces, and dependency maps that show scope and path fast
How it helps: teams looking to reduce MTTR get answers in one view instead of exporting from four systems
Concrete scenario: an alert fires on a database server. Instead of pulling logs from three tools, the analyst opens the trace, sees the exact query path, and confirms the blast radius in minutes.
3. Cloud and Multi-Cloud Visibility
Cloud estates change by the minute, and misconfiguration is one of the most common ways in. Cloud security observability gives you eyes on infrastructure that spins up and tears down constantly.
Why it matters: ephemeral workloads and shared responsibility create gaps traditional tools miss
What it covers: misconfigurations, unusual API calls, unexpected storage access, and identity behavior across accounts
How it helps: the role of cloud observability in security is to keep one consistent view as workloads move
Concrete scenario: a storage bucket flips to public at 4 p.m. Observability catches the config change and the first unfamiliar download in the same view, before the data walks out the door.
4. Catching Configuration Drift and Unauthorized Change
A quiet config change is one of the most under-watched security events there is. One changed firewall rule, or a device config quietly edited, can leave a door open for months.
Why it matters: change is the moment risk slips in, and a change nobody authorized is often the first trace of a compromise
What it does: captures device and system configurations, versions them, and flags deviations in near real time
How it helps: paired with network security monitoring, drift detection turns a silent change into an alert that shows exactly what changed, old version beside new.
5. Compliance and Audit Readiness
Regulators want proof, and proof is a byproduct of good observability. With continuous telemetry and audit trails in place, audit season stops being a scramble and becomes a straightforward export.
Why it matters: frameworks such as GDPR, HIPAA, PCI DSS, and SOX all expect a clear account of who did what, and when
What it provides: an audit log covering access records and change history, along with reports mapped to each control requirement
How it helps: you demonstrate control coverage with data you were already collecting
Concrete scenario: an auditor asks for every access to a patient records system last quarter. What used to take a week of log-pulling becomes a filtered report you export in an afternoon.
6. Supporting a Zero Trust Model
Zero trust rests on continuous verification, and you can't verify what you can't observe. Security observability is the sensing layer under a zero trust architecture.
Why it matters: "never trust, always verify" holds up only when every action stays visible
What it enables: continuous checks on identity, device posture, and access behavior in place of a single gate check at the door
How it helps: live signals let policy react to what's happening in the moment rather than relying on whatever was true at login
7. Securing DevSecOps and CI/CD Pipelines
Shifting security left means watching the pipeline, not just production. Bringing observability into the build and deploy stages surfaces trouble before it ever reaches production.
Why it matters: a flaw caught inside the CI/CD pipeline costs far less to fix than one found after release
What it watches: how builds behave, what changes in dependencies, and who reaches for pipeline secrets
How it helps: developers get security signals inside the workflow they already use
8. Extending Visibility to Remote and Endpoint Activity
Distributed work multiplied the endpoints and thinned the perimeter. Security observability keeps remote devices and sessions in view instead of off the map.
Why it matters: unmanaged devices and home networks stretch the attack surface wider
What it covers: endpoint activity, how sessions behave, and connections coming in from outside the corporate network
How it helps: an anomaly on a remote device gets the same scrutiny as one on-premises
Benefits of Security Observability
Put together, those use cases add up to outcomes that matter at the leadership level:
Earlier detection: Anomalies get caught before they escalate, which trims dwell time and the costs that pile up alongside it
Faster investigation: Context in one view cuts MTTR, so incidents close in hours instead of days
Fewer blind spots: Broad telemetry closes the gaps attackers rely on in hybrid estates
Less noise: Correlation means fewer, higher-quality alerts, which eases alert fatigue and analyst burnout
Audit-ready evidence: Compliance reporting comes from data you already hold, cutting audit prep
Lower breach cost: Faster containment limits the financial and reputational damage of an incident
Challenges of Adopting Security Observability
Security observability is powerful, and it isn't free. Five trade-offs show up on almost every rollout.
1. Data Volume and Cost
Collecting telemetry from everywhere means storing it, and that cost rises with every new source you add.
The problem: a mid-sized environment can generate terabytes of logs a week, and keeping all of it instantly searchable gets expensive fast
What to do: store high-value data like login and configuration records where you can search it quickly, and move low-value data to cheaper storage
2. Tuning Takes Time
Anomaly detection only works once it has learned what normal looks like, and that learning period takes weeks.
The problem: early on, the system flags too many harmless events while it settles, and a flood of false alarms trains people to ignore it
What to do: plan for the learning window, and keep refining the rules as your environment changes rather than treating setup as one-and-done
3. A Shortage of Skilled People
Reading correlated telemetry and drawing the right conclusion is a specialized skill, and it's hard to hire for.
The problem: smaller teams often have plenty of data but not enough hours to interpret it, which is exactly where a slow, quiet compromise hides
What to do: choose a platform that does the correlation and root-cause work for you, so analysts start from answers instead of raw feeds
4. Blind Spots in Your Dependencies
Some of your biggest exposure comes from software you didn't build, buried deep in the components your applications rely on.
The problem: Log4Shell was a flaw inside a common logging library, present in thousands of applications and invisible to teams watching only the surface
What to do: collect telemetry from inside your applications and their components, not just the network perimeter
5. It Works Alongside Prevention, Not Instead of It
Security observability makes threats visible and speeds up your response, which is a different job from blocking the attack in the first place.
The reality: it complements your firewalls, endpoint protection, and access controls rather than replacing them
Watch for: any vendor that sells it as a single tool covering every security need is overstating what it does
Best Practices for Building Security Observability
You don't need everything on day one. What you need is a sensible order, and a few habits that keep the program useful after launch.
1. Start With Your Highest-Value Systems
Instrument the assets that would hurt most if breached, such as identity providers, finance databases, and domain controllers, before trying to cover everything. Depth on your 20 most critical systems beats shallow coverage everywhere.
A phased start also buys time. You prove value where it counts, learn your environment's patterns, and expand without blowing the budget in the first month.
2. Unify Collection Before You Analyze
Correlation is impossible when metrics live in one tool, logs in another, and flows in a third. Bring the four pillars into one platform first, so a single event can be seen from every angle.
Teams that skip this step end up correlating by hand, tab by tab, during the exact moment they can least afford the delay. The unification is the work that makes everything after it faster.
3. Baseline Before You Alert
Anomaly detection needs a few weeks of clean data to learn what normal looks like for each asset. Turn it on too early and false positives bury the team.
Plan for that learning window, and resist alerting on everything from day one. Outliers only mean something once the baseline behind them is solid.
3. Prioritize Alerts Ruthlessly
A hundred raw anomalies a day trains people to ignore all of them. Score and group alerts so only the handful with real signal reach a human, and route the rest to dashboards for review.
One well-correlated alert that ties a login, a config change, and a data pull together is worth more than fifty standalone warnings. Quality of signal beats quantity every time.
4. Automate the Responses That Don't Need Judgment
Session checks, ticket creation, and diagnostic runbooks can run without waking anyone. Reserve human attention for the calls that need context and experience.
The goal is to shrink the time between "something's wrong" and "something's being done," especially at 3 a.m. when staffing is thin.
5. Wire Observability Into Incident Response
Telemetry only helps if it's part of how the team works an incident. Link detections to your response runbooks and ticketing, so an analyst moves from alert to context to action along one path.
A dashboard nobody opens mid-incident is decoration. The value is in the workflow, not the screen.
6. Review Baselines and Coverage on a Schedule
Environments drift, new services appear, and last quarter's normal quietly stops being normal. Revisit baselines, retune noisy rules, and hunt for new blind spots every quarter, before the next breach finds the gap for you.
Treat it as routine maintenance, the same way you treat patching. The program you set up once and forget is the one that fails you.
What are the Four Stages of Security Observability Maturity
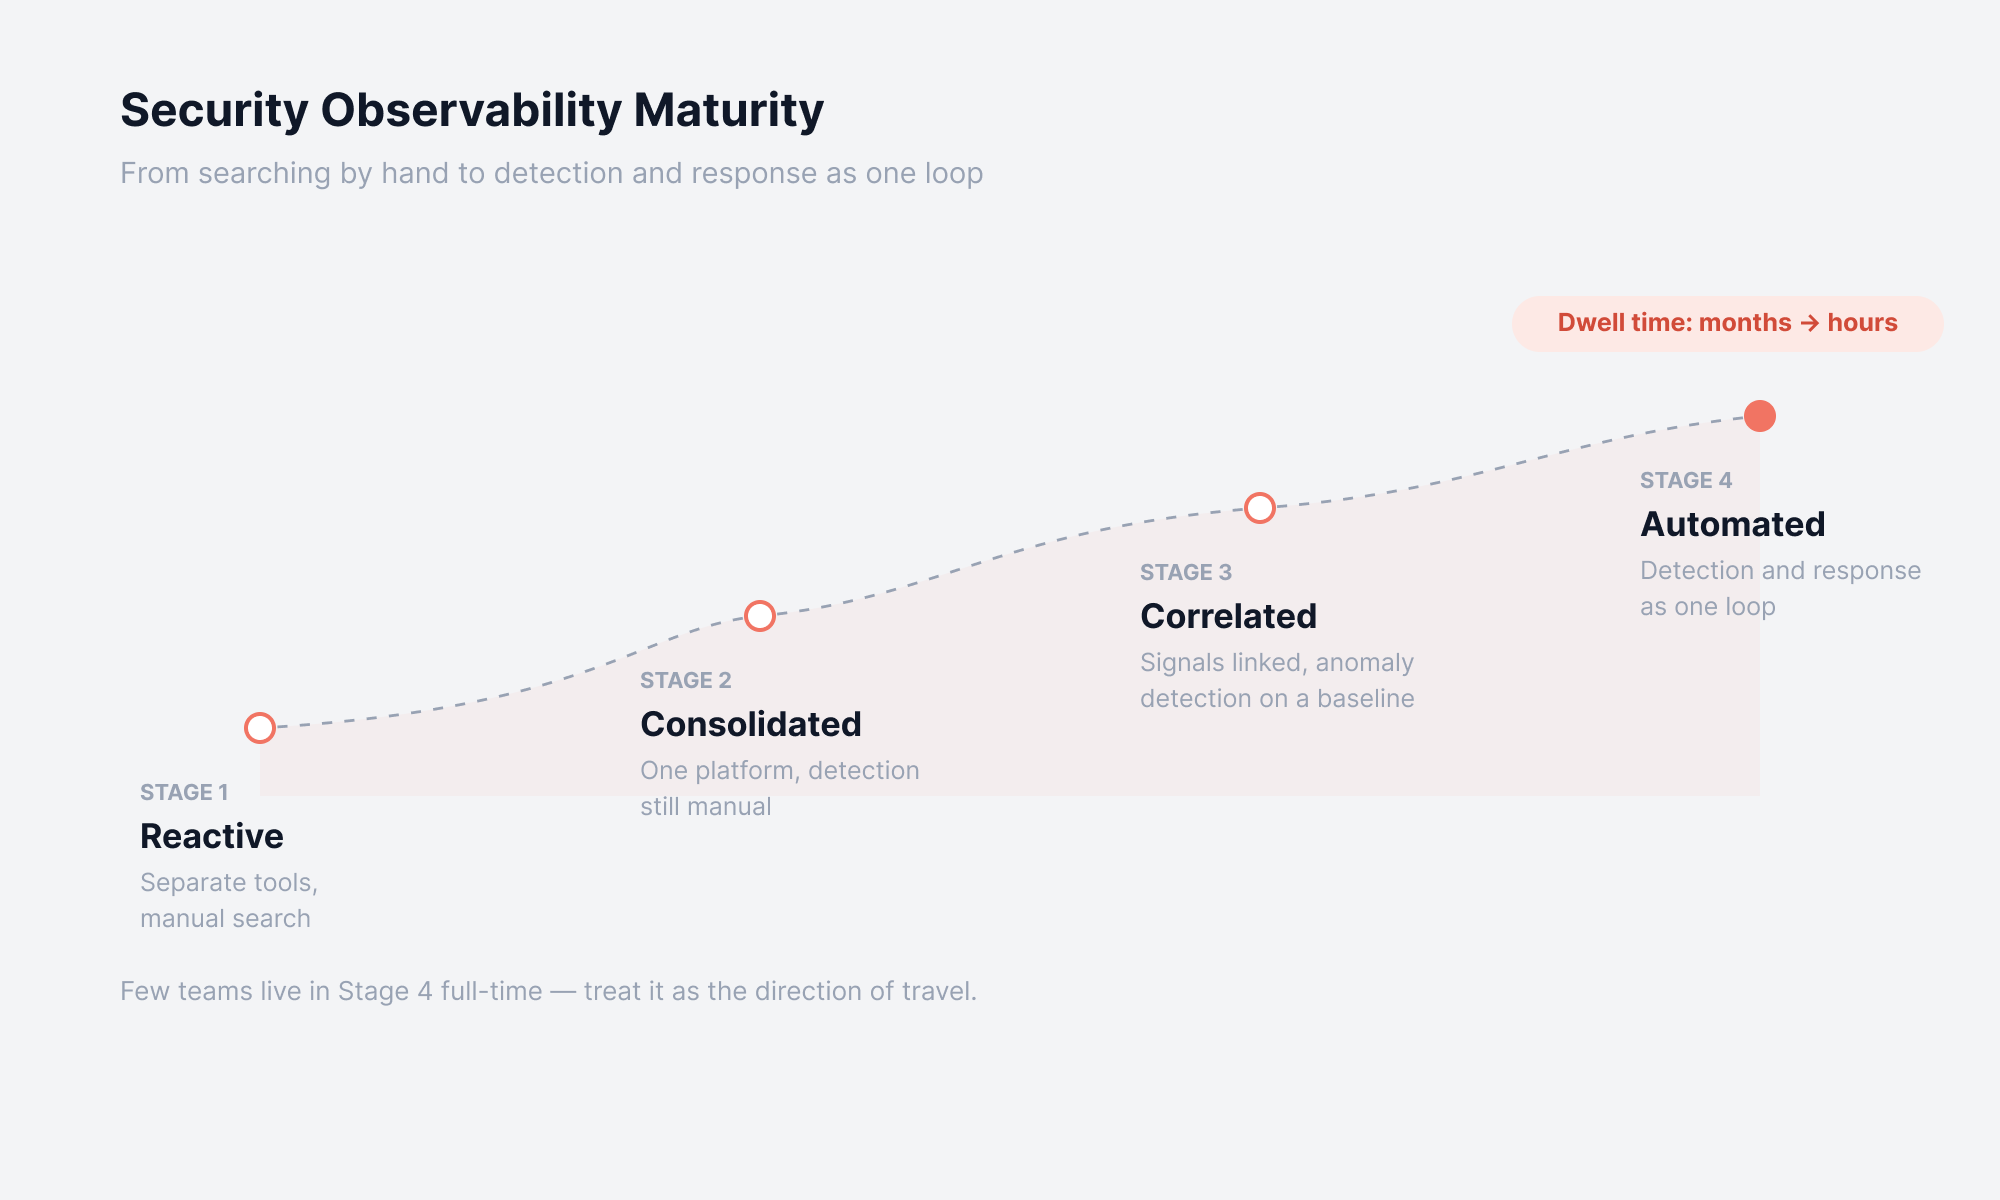
Security observability maturity tends to develop in four stages. Knowing which one describes your team helps you pick the right next move, and avoid paying for capabilities you aren't ready to use.
Stage 1: Reactive
Tools run separately, and finding anything means searching each one by hand. Most incidents surface after the damage is done, or when someone outside the team points them out. Detection depends on who happens to be looking and how much time they have.
Moving up means getting all that telemetry into one place.
Stage 2: Consolidated
Metrics, logs, and traces now land in a single platform, so searches are faster and context is easier to find. Analysts stop jumping between consoles to piece an event together. Detection is still mostly manual, but the constant tool-switching is gone.
Moving up means connecting those signals automatically instead of by hand.
Stage 3: Correlated
The platform now links related signals across the four pillars, and anomaly detection is running against a learned baseline. Alerts arrive scored and grouped, so analysts focus on the few that matter. The team starts catching behavior that no fixed rule was written for.
Moving up means automating the routine parts of the response.
Stage 4: Automated
Detection and response work as one loop. Routine containment and ticketing happen on their own, while people handle the judgment calls that need context. At this stage, the time a threat stays hidden drops from months to hours.
Few teams live in Stage 4 full-time, and that's fine. Treat it as the direction to keep moving toward, and measure progress by how quickly your team detects and contains what gets in.
Build Your Security Observability Foundation With Motadata ObserveOps
Green dashboards don't equal a secure environment. The gap between the two comes down to correlation, and that's what a unified platform is built to deliver.
Motadata ObserveOps brings unified observability across metrics, logs, flows, traces, and topology into one view, so the signals that expose a threat stop living in separate tools. Its DFIT deep learning framework correlates a login, a config change, and a traffic spike into a single event, Log Explorer drops you into the entries around a suspicious moment, and its configuration management flags drift against standards like CIS, GDPR, HIPAA, and SOX with network compliance checks built in. When something needs action, alerts can trigger runbooks and open tickets in Motadata ServiceOps, closing the loop from detect to respond.
ObserveOps is the visibility and correlation layer your prevention and endpoint tools build on, the part that turns months of dwell time into hours.
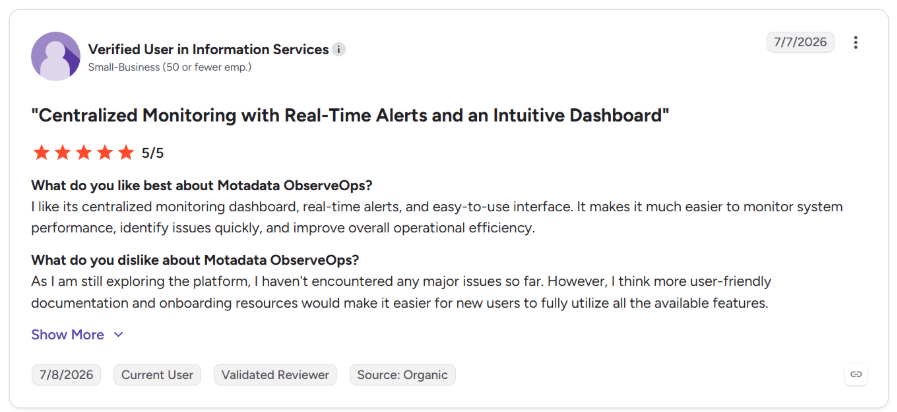
Here's what customers say about Motadata ObserveOps on G2.
Start with your highest-value systems, unify the signals, and let correlation surface what matters. Security observability is how teams stop finding out about their incidents from someone else.
FAQs
What is observability in security?
Observability in security is the ability to understand what's happening inside your systems by collecting and correlating telemetry, so you can detect and investigate threats, including ones no rule predicted. It goes beyond monitoring, which only checks known conditions against fixed thresholds. Platforms built for this, such as Motadata ObserveOps, bring metrics, logs, traces, and events into one view so the correlation is possible in the first place.
What are the 4 pillars of observability?
The four pillars are metrics, events, logs, and traces, sometimes shortened to MELT. Metrics quantify behavior, events mark meaningful state changes, logs record detail, and traces follow a request across systems. Many models list three pillars (metrics, logs, traces) and treat events as the fourth.
What are the 4 types of security?
A common grouping is network security, application security, information or data security, and operational security. Some frameworks swap in endpoint or cloud security depending on the environment. Security observability supports all of them by supplying the visibility each one depends on.
What are the 5 P's of security?
One widely used version is People, Process, Policy, Products, and Proof. People and process cover the human and procedural side, policy sets the rules, products are the tools, and proof is the evidence that controls are working. Variants exist, and observability maps most cleanly to Proof, since logs and audit trails are how you demonstrate control.
Is security observability the same as a SIEM?
No. A SIEM aggregates security logs and matches them against rules for alerting and compliance. Security observability is broader, pulling in performance and infrastructure telemetry for open-ended investigation of both known and unknown behavior. Many teams run both, and a unified platform like Motadata ObserveOps can feed correlated context into the SIEM rather than replacing it.
Author
Poonam Lalani
Content Strategist
Poonam Lalani is a B2B content strategist and writer with a background in computer engineering and experience across enterprise technology domains, including AI, cloud, DevOps, data engineering, and IT operations. She specializes in creating research-driven content that simplifies complex ideas and supports product education, thought leadership, and business growth.