What is a CRC Error and How to Find the Faulty Link Before It Slows the Business
Why does a switch port look healthy on every dashboard while people on that floor keep reporting dropped calls and slow file transfers? Often the cause is CRC errors, a port counter that most dashboards do not show by default. Each CRC error means a unit of data arrived damaged and the switch discarded it.
Put simply, a CRC error tells you the receiving device noticed the data changed somewhere in transit. On networks, that change usually traces back to hardware: a worn cable, perhaps, or a dirty fiber connector or an optical module near the end of its life. The damage adds up quietly, because the network resends the lost data and the only visible symptom is an application that feels slow.
Finding CRC errors early pays off quickly, because the fix is usually a new cable or a low-cost part, and network observability makes them easy to find. This blog explains what a CRC error is and where it comes from. It also covers the business cost, the fix, and how to spot a failing link before anyone raises a ticket.
What is a CRC Error?
A CRC error is what gets reported when a data integrity check fails. The receiver works out the cyclic redundancy check value for a block of data on its own, and that value disagrees with the one the sender attached. Because a mismatch proves the data was altered on its journey, the device throws it away or flags it as corrupt.
You will run into the term in quite different settings, since this same check guards data across many parts of IT infrastructure:
Networking: Data that fails the check when it reaches a network switch, router or server
Storage: Disk reads where the data on the drive no longer matches its stored check value
Files and archives: Compressed files that fail verification when they are opened
This article focuses on the networking meaning, where CRC errors quietly affect application performance and user productivity. Storage and file versions are covered briefly near the end.
What Does CRC Stand For?
CRC is short for cyclic redundancy check, the error-detecting method W. Wesley Peterson published in 1961. The word "redundancy" points to the short extra value computed from the data and sent with it. "Cyclic" names the class of mathematical code behind the calculation.
The CRC meaning, then, comes down to a compact fingerprint of the data that the receiver can verify on arrival. When that verification fails, you have the CRC error meaning in full, since the fingerprint taken at the far end no longer matches the original.
How Does a Cyclic Redundancy Check Work?
A cyclic redundancy check works in two halves. The sender runs the data through a fixed mathematical formula and ships the result with it; the receiver then repeats that calculation and compares its answer. If anything changed in transit, the results differ.
The process follows four steps:
Agree on a formula: Both ends use the same CRC standard, and Ethernet networks use a 32-bit version called CRC-32
Calculate at the sender: The sender runs the data through the formula and produces a short check value
Attach and send: The check value is placed in the last field of each Ethernet frame, called the Frame Check Sequence (FCS)
Recheck at the receiver: The receiver recalculates the value, passes the frame if it matches and counts a CRC error if it does not
Switches and network cards run this check on every frame without slowing traffic. The 32-bit version used on Ethernet catches every single-bit error and every short burst of damaged bits, so a CRC error is a reliable sign that something on the link is corrupting data.
What are the Common Types of CRC?
The common types of CRC differ mainly in the length of the check value, and a longer value catches more kinds of damage. Each is suited to different equipment:
CRC type | Check value length | Where it is typically used |
CRC-8 | 8 bits | Small sensor and industrial messages |
CRC-16 | 16 bits | Industrial protocols such as Modbus and building automation networks |
CRC-32 | 32 bits | Ethernet, Wi-Fi, ZIP archives and many storage formats |
CRC-32C | 32 bits | Storage protocols such as iSCSI and modern file systems |
Because the error is always detected at the receiving end of a link, that port is where any investigation starts. The comparison below sets a clean link beside a damaged one to show what the receiving switch checks and why it drops the frame.
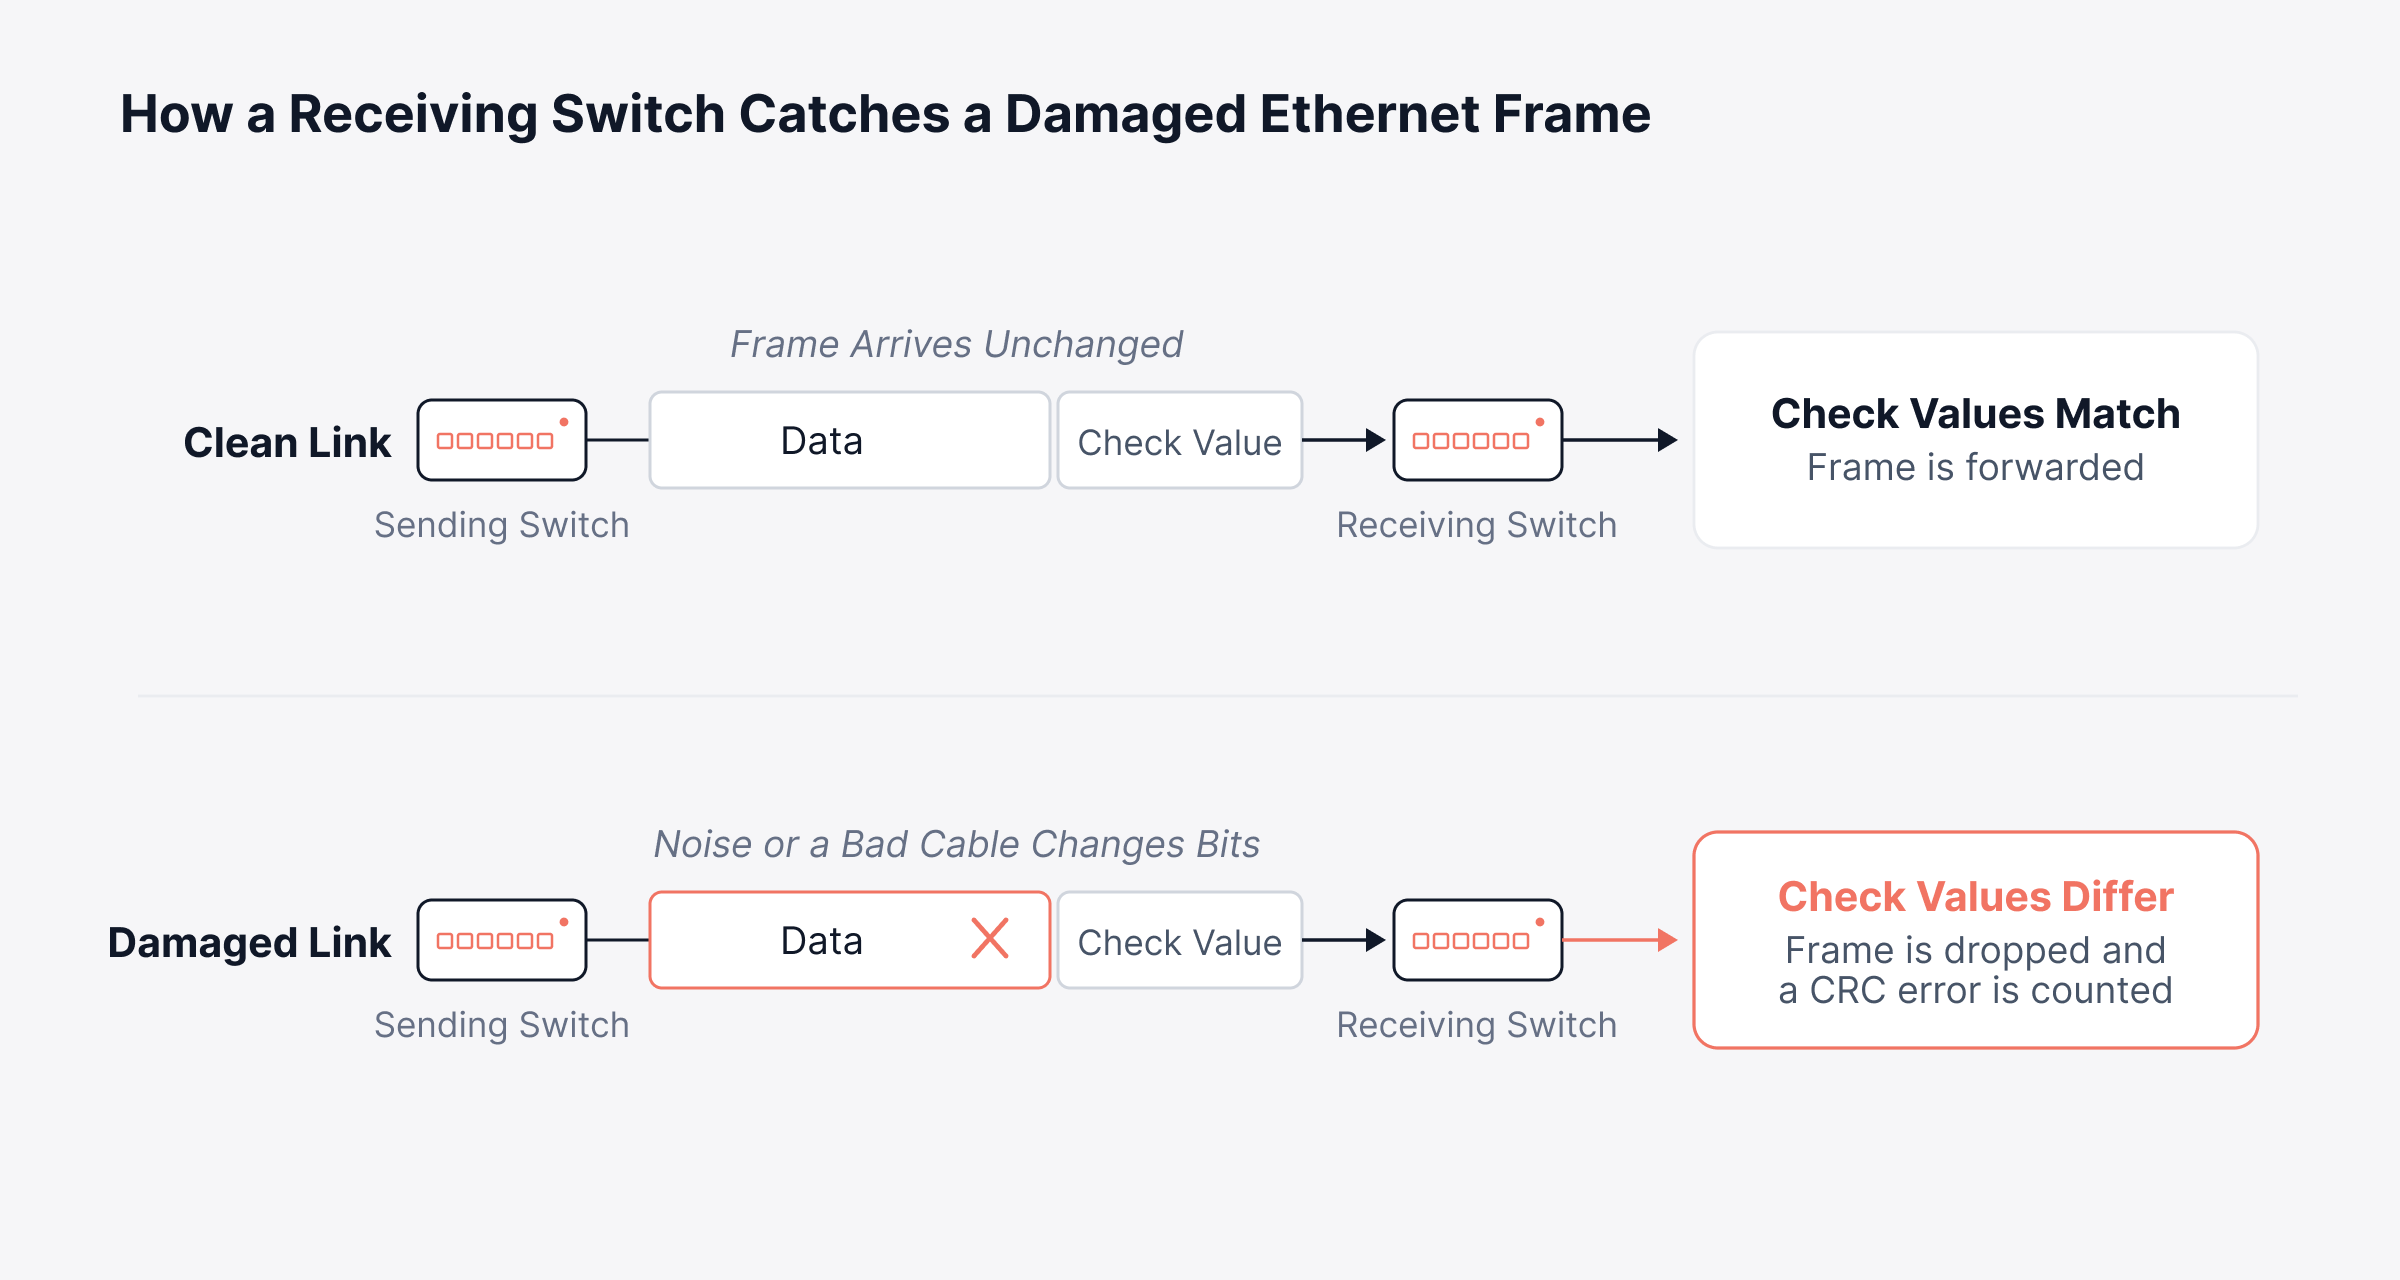
The next question is practical: how does a CRC error show up on a business network, and where is it logged?
What is a CRC Error in Networking?
A CRC error in networking is logged when an Ethernet frame, which is the unit of data carried across a local network, reaches a port with a check value the port cannot reproduce. That frame is discarded at the data link layer, Layer 2 of the OSI model, and the port's CRC error counter goes up by one.
In short, the answer to what is CRC error in networking terms is a discarded frame plus one more tick on the error counter. The check cannot repair the frame, so recovery depends on the protocol carrying the data: TCP resends it after a short delay, while live voice and video streams simply lose it.
Where Do CRC Errors Show Up on a Switch Interface?
CRC errors on switch interface ports are recorded in each port's error counters, and the names vary by vendor. The table below maps the counters engineers and observability tools report most often:
Counter name | Where it appears | What it means |
CRC or FCS errors | Switch and router interfaces | Frames that failed the check on arrival |
Input errors | Switch and router interfaces | All incoming errors combined, including CRC errors |
Runts and giants | Switch and router interfaces | Frames that are too short or too long, often from a settings mismatch |
Output errors | Switch and router interfaces | Damaged frames a switch passed along before the check finished |
RX errors or received errors | Linux and Windows servers | Incoming errors counted by the server's network card |
FCS and input error counters over SNMP | Observability platforms | The same counters, collected remotely from every device |
A single reading means little, because counters keep adding up from the last restart or reset. The rate of increase is the number worth watching.
How Are CRC and FCS Errors Different from Input Errors?
CRC errors, also shown as FCS errors on many switches, only count frames that failed their check value. Input errors cover a lot more: every fault the port logged on incoming traffic. That's why the two counters often rise together and end up being read as one number.
They aren't quite the same signal. Many switches fold runts, giants and overruns into the input error total as well, and those can come from heavy traffic or a badly behaved sender with nothing wrong in the cabling. Here's how each counter is sourced, and what it usually means when it climbs.
Counter | What it counts | Standard SNMP object | What a rising count usually means |
Input errors | Every error recorded on frames the port receives | ifInErrors (IF-MIB) | A physical fault or another frame problem, so check which component is rising |
CRC or FCS errors | Frames whose check value did not match on arrival | dot3StatsFCSErrors (EtherLike-MIB) | A cabling, optic, port or duplex problem on this specific link |
So if you only watch the total, a cable that's slowly failing can get lost among load-related errors. It can also go the other way, with someone sent out to check a link that turns out to be fine. If you collect counters over SNMP, pull the FCS counter out by itself and alert on how quickly it climbs, next to the other network performance metrics you already follow.
Why Do Cut-Through Switches Make CRC Errors Harder to Trace?
Cut-through switches make CRC errors harder to trace. They begin forwarding a frame before its check value arrives, which lets a damaged frame cross several switches until one finally drops it. Store-and-forward switches wait for the whole frame and drop damaged frames immediately.
Cut-through switching is common in low-latency data center networks, where one bad optic can raise error counters on several switches at once. The practical risks are easy to state:
Wrong diagnosis: The port where errors first appear may be several switches away from the faulty link
Wasted spend: Parts get replaced on healthy links while the actual fault keeps corrupting traffic
To find the true source, look for the port that shows incoming errors while the port feeding it shows no outgoing errors. That rule saves hours of guesswork.
What are the Signs of CRC Errors?
The signs of CRC errors usually appear first as vague performance complaints, long before anyone checks a port counter. Users notice the symptoms, but the cause stays hidden in the switch port's counters:
Slow applications: File transfers, backups and cloud apps take longer as lost data is resent, adding latency
Choppy calls and video: Voice and video streams lose data, causing clipped audio, frozen video and jitter
Intermittent timeouts: Point-of-sale terminals, VPN sessions and database connections drop and reconnect
Rising error counters: CRC and input error counts climb steadily on one port or one link
Link flaps: A port repeatedly goes down and comes back up as a cable or optic gets worse
Few of these symptoms point at the network by themselves. That is why it helps to know the usual causes when matching a complaint to its fix.
What Causes CRC Errors?
CRC errors most often come from a damaged or failing part in the physical link between two devices, whether that is a cable, an optical module, a switch port or a network card. Mismatched settings between the two ends of a link cause a smaller share. You will find both kinds of fault across all sorts of network infrastructure, in branch offices and data centers alike.
1. Damaged or Low-Grade Copper Cabling
Everyday wear takes a toll on copper. A cable may be crushed under furniture or bent too sharply, poorly terminated, or run beyond the 100-meter limit that standard Ethernet allows. A cable rated for a lower speed than the port it connects to also produces errors once traffic increases.
2. Dirty Fiber Connectors and Aging Transceivers
With fiber, even one speck of dust on a connector can be enough to corrupt frames. Transceivers age as well. These small plug-in modules turn electrical signals into light, and their output weakens gradually, well before the link actually goes down.
3. Speed, Duplex and Frame Size Mismatches
With a duplex mismatch, the two ends of a link disagree about whether traffic can flow both ways at once. Typically one side negotiates its settings automatically while an administrator has fixed the other. One end then records CRC errors, and the other records collisions.
A frame size mismatch, where one device sends larger frames than the other accepts, also inflates error counters. Correcting the configuration resolves either problem without touching the hardware.
4. Electromagnetic Interference Near Cabling
Electrical noise is another culprit. Unshielded copper laid near motors, power lines, lighting fixtures or heavy machinery can absorb enough of it to flip bits. Interference errors usually track the equipment's schedule, climbing during working shifts and easing off afterward.
Example: A distribution warehouse sees scanner timeouts and a slow inventory system only during shift hours. The uplink cable runs past a forklift charging bay, and CRC errors on that port climb whenever the chargers are active. Rerouting the cable, or moving the link to fiber, ends the errors and the complaints together.
5. Faulty Switch Ports, Network Cards and Patch Panels
Any component in the path can be the source: a worn switch port, a failing server network card or a loose jack in a patch panel. Faults deeper inside a switch are rarer and tend to produce errors across several ports at once.
Most of these faults are cheap to fix. What makes them expensive is how long they go unnoticed.
How Do CRC Errors Affect Network Performance and Business Operations?
CRC errors affect network performance because every damaged frame has to be sent again. Long before a link fails, that resending adds delay, eats into throughput and degrades voice and video. Most business applications run over TCP, which treats each loss as congestion and backs off its sending rate, so even a modest error rate can make applications feel sluggish.
For the business, the impact spreads well beyond the network team:
Lost productivity: Employees wait on slow applications and repeat failed tasks, and those minutes add up to measurable productivity losses across a site
Customer-facing disruption: Checkout terminals, contact center calls and online transactions slow down or fail when their traffic crosses the affected link
Misdirected effort: Tickets go to application or server owners first, so engineers spend hours investigating software that is working correctly
Longer resolution times: Every hour spent guessing raises MTTR and puts service level commitments at risk
Unplanned outages: A degrading cable or optic can progress from errors to a full link failure
Outages are where the costs climb fastest. Uptime Institute's 2026 outage analysis found that 57% of respondents put the cost of their latest major outage above $100,000. The same research notes that outages linked to fiber and connectivity problems are becoming more common.
Packet loss often has a hidden CRC component, too. The frames vanish at the port itself, so bandwidth graphs never register them as congestion. For IT leaders, the question is whether current tools flag these early warnings or leave users to report them.
How Do You Detect CRC Errors on a Network?
You detect CRC errors by reading error counters on switches, routers and servers and then watching whether the numbers keep climbing. Working through it in a set order shortens the investigation, and it slots neatly into any broader network troubleshooting process.
Confirm CRC Errors Are Still Increasing
Note or reset the current count, then check again after a period of normal traffic. A handful of errors against billions of frames is background noise, while a steady climb during business hours points to an active fault.
Trace CRC Errors Back to the Faulty Link
Tracing CRC errors to their source means checking both ends of each link and following the errors upstream. The method works in four steps:
Start at the affected port: Pick the interface where CRC errors are rising fastest
Check the neighbor: Use CDP or LLDP, the discovery protocols switches use to identify neighbors, to find the device at the other end and compare its speed and duplex settings
Follow outgoing errors upstream: If the neighbor port shows output errors, move to that device and repeat
Stop at the origin: The faulty link is the first one where a port shows incoming errors but the device feeding it shows no outgoing errors
Finding the link tends to be the slow part; the repair that follows is usually quick.
How Do You Fix a CRC Error?
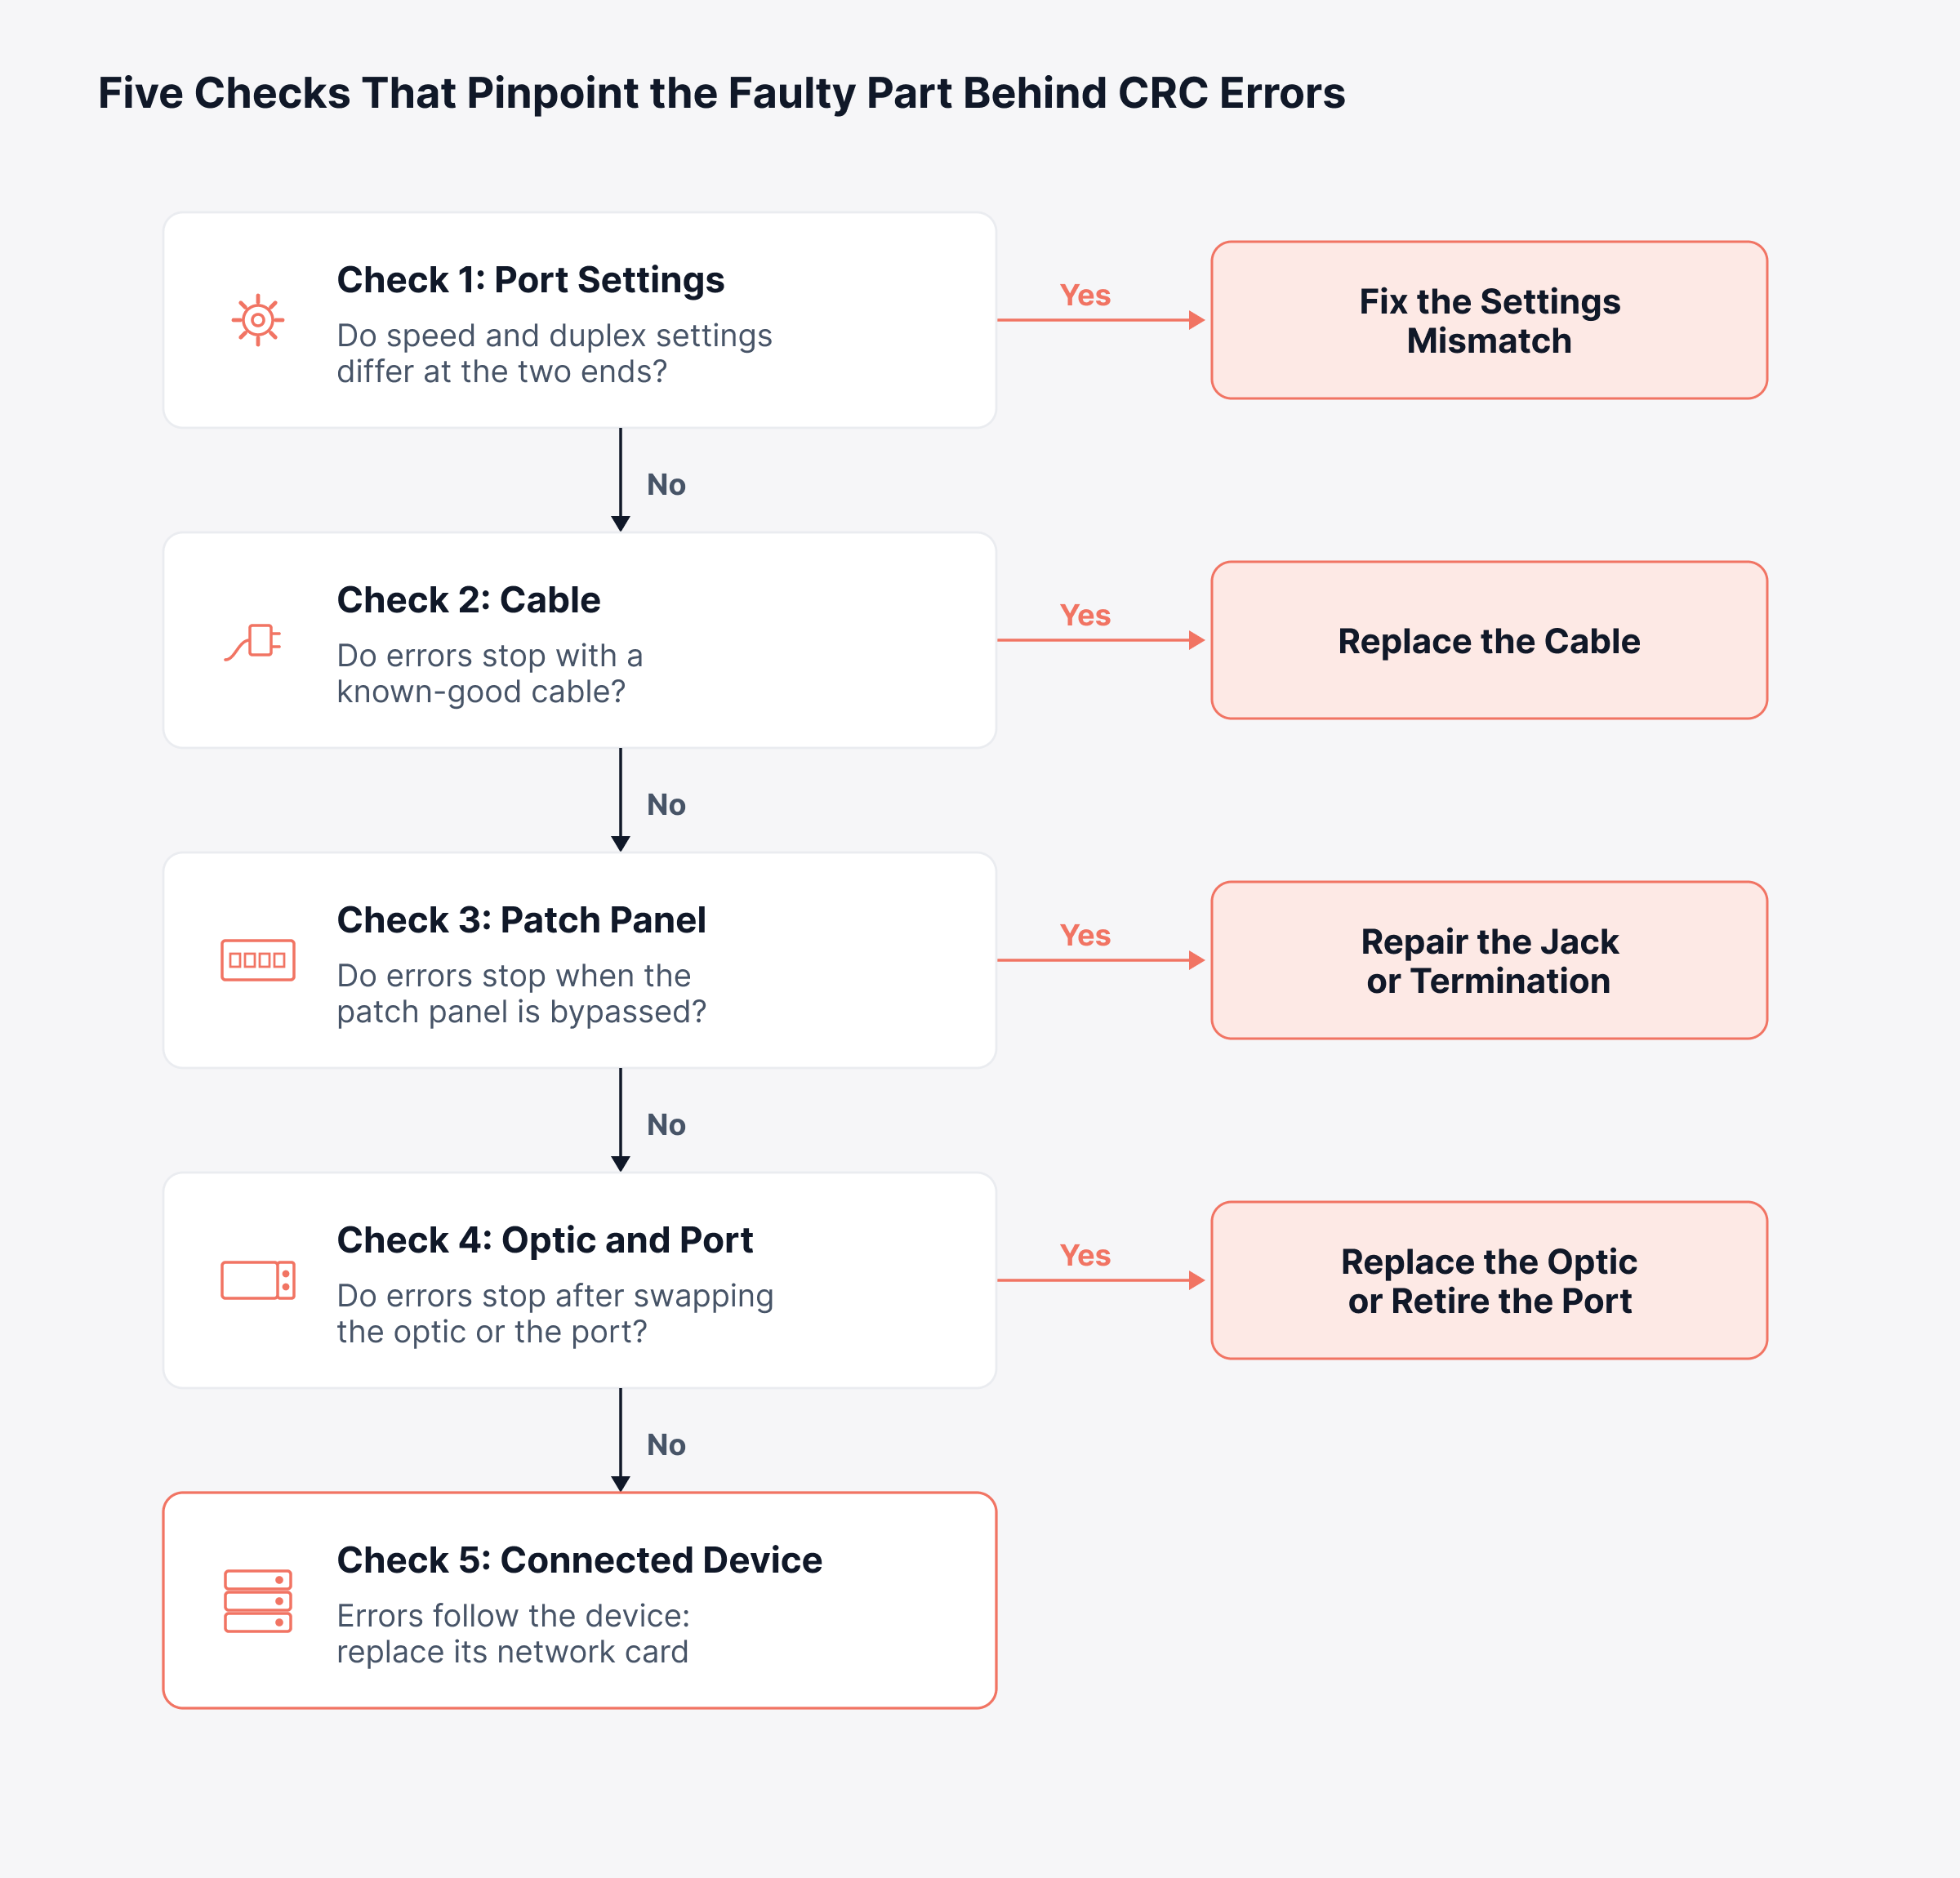
How to fix CRC error problems comes down to one principle: correct or replace the physical part that corrupts frames and change only one thing per test, so the result isolates a single cause. The six steps below run from the least disruptive to the most:
Reseat and clean: Reseat both cable ends and transceivers, and clean fiber connectors with a proper cleaning tool
Check speed and duplex: Confirm both ends match, ideally with automatic negotiation enabled on both sides
Swap the cable: Replace the patch cable with a known-good one and watch the counter
Bypass the patch panel: Connect the device directly to rule out a bad jack or termination
Move ports and swap optics: Move the link to another switch port, then replace transceivers one at a time
Replace the endpoint hardware: If the errors follow the device, replace its network card or port
Reset the counters after every change, then give the port at least a full business day before checking it again. The fix is confirmed when the counter stays flat under normal load, and that before-and-after record becomes the evidence for your root cause analysis.
Example: A retail branch reports that its point-of-sale terminals time out several times a day. The access switch shows CRC errors climbing on one port, and when the terminal and its cable are moved to a spare port, the errors move with them. Replacing a patch cable that had been crushed by a counter drawer ends the timeouts without any application change.
Each check either clears the errors or leaves them in place, and that result tells you which part to replace. Working through the checks below in order avoids buying hardware the link never needed.
Fixing one link solves today's problem, and preventing the next one is where the larger savings come from.
How Can You Prevent CRC Errors?
You prevent CRC errors by combining good physical-layer practices with continuous visibility into every link, so aging parts are replaced before they disrupt users. The practices that make the biggest difference are simple:
Certify cabling at installation: Test new cable runs against their rated speed so weak cables never go into service
Clean before connecting: Make fiber connector cleaning a standard step in every change
Standardize port settings: Apply consistent speed and duplex configurations across devices to rule out mismatches
Route cabling away from noise sources: Keep copper runs clear of motors, power lines and heavy equipment, or use fiber in those areas
Replace parts on evidence: Use error trends and optic signal readings to plan replacements during maintenance windows
That last practice only works if error data is already being collected, which is the role of network observability.
How Does Network Observability Catch CRC Errors Early?
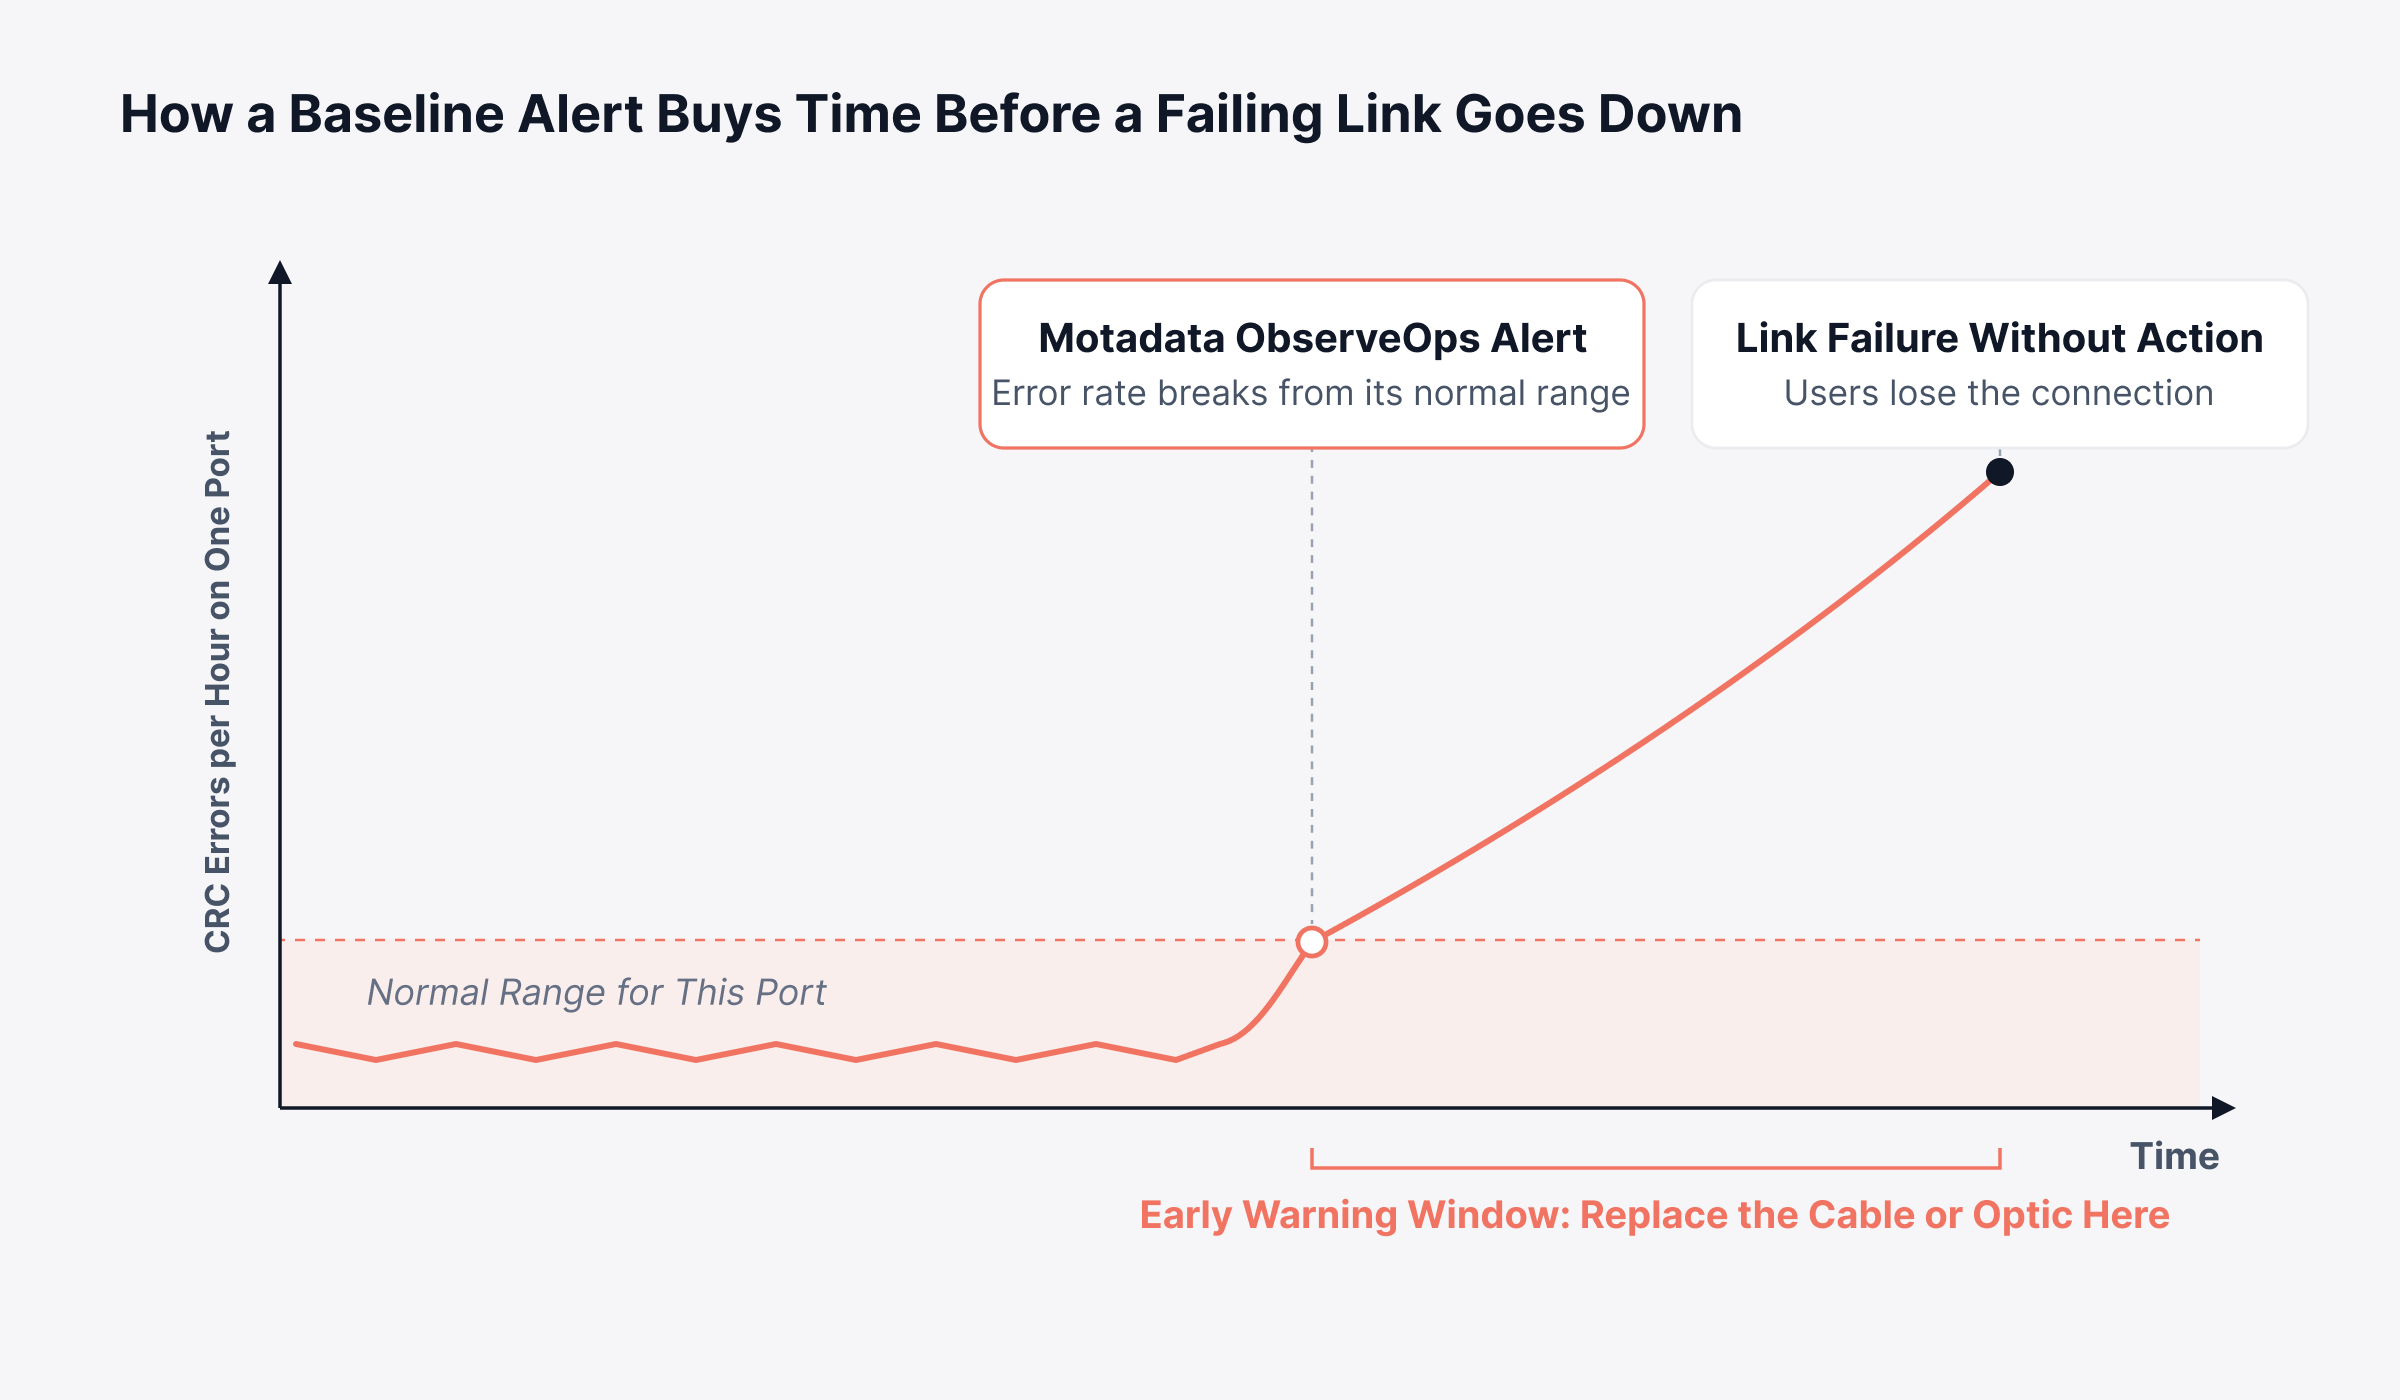
Network observability catches CRC errors early by collecting error counters from every device continuously, turning them into error rates, and alerting when a rate breaks from its normal pattern. Manual checks usually begin only after someone complains, and checking thousands of ports one command at a time is impractical.
An observability platform that handles CRC errors well covers these capabilities:
Error rates per interface: Counters collected over SNMP, the standard protocol for reading device metrics, and charted over time for each port
Baselines and anomaly detection: Anomaly detection compares each port with its own history and flags unusual increases, so ports with a small, steady error count do not trigger alerts
Link state events: SNMP traps, the messages devices send when their status changes, show a port that keeps dropping and reconnecting
Topology context: A network topology view shows which device is at the other end of the failing link
Correlation with symptoms: Showing port errors next to application response times reveals which port is slowing which application
Automated follow-up: A threshold breach automatically opens a ticket or runs a diagnostic script, with the evidence attached
Motadata ObserveOps brings these pieces into one platform. It tracks interface error rates, discards, utilization and status changes across multi-vendor switches and routers, applies fixed thresholds or AI/ML dynamic baselines, and correlates related alerts so one failing link produces one clear alert.
Alerts can trigger runbooks or create tickets in ServiceOps, ServiceNow or Jira.
Per-interface CRC/FCS counter: ObserveOps now gives each network interface its own CRC/FCS error counter, kept apart from the general inbound error signal. You can use that counter in Alert Policies on multi-vendor networks monitored over SNMP, which means a cable, transceiver or link that’s starting to fail gets noticed early.
The main benefit of observability here is time: the alert arrives while the fix is still a planned part replacement. The trend below marks the gap between the first alert and a link failure, the period in which a manual process usually has no visibility.
People often mix up CRC with the checksum, a lighter integrity check that runs on the very same networks.
What is the Difference Between CRC and Checksum?
The difference between CRC and checksum comes down to strength. A checksum simply adds data values together, whereas a CRC relies on polynomial division and detects many more error patterns, particularly the short bursts of damaged bits that faulty cables and electrical noise produce. This CRC vs checksum comparison shows where each one fits:
Aspect | Checksum | CRC |
Method | Simple sum of data values | Polynomial division, a more rigorous calculation |
Error coverage | Can miss errors that cancel each other out | Catches all single-bit errors and short bursts |
Typical use | Internet and transport protocols such as IP, TCP and UDP | Ethernet and Wi-Fi frames, storage devices, compressed archives |
Both methods detect errors, and neither corrects them. Networks use both at once: the CRC checks each frame on every link it crosses, and the TCP checksum checks the data again when it reaches its destination.
Where Else Do CRC Errors Appear Outside the Network?
CRC errors outside the network usually come from storage devices and compressed files, where the same check protects stored data. Three error messages come up most often:
Data error (cyclic redundancy check): The Windows message when a drive returns data that fails its check, often a sign of failing media, so copy important files off before running repair tools
UDMA CRC error count: A drive health attribute that counts transfer errors between a SATA drive and its controller, most often traced to a loose or poor-quality SATA cable
7zip CRC error: The archive or a file inside it was corrupted during download or storage, and downloading it again usually resolves it
Whatever the setting, each message says the same thing: data changed after its check value was calculated. Fixing it means tracking down what caused the change.
Turn CRC Errors Into Early Warnings with Motadata ObserveOps
Few signals arrive earlier than a CRC error on a switch interface when a cable, optic or port starts to fail. Users tend to feel the slowdown well before anyone on the network side notices it. Treat these errors as a business signal, and vague complaints become specific fixes that cost very little.
Observability has a limit worth stating plainly: it identifies the failing link and when the trend started, and a technician still has to clean the connector or swap the cable. Motadata ObserveOps handles everything before that step, tracking interface errors across switches and routers, alerting on unusual rises and routing the evidence to whoever owns the fix.
FAQs
How do I fix a CRC error on a network port?
Start by checking that speed and duplex settings match on both ends, then reseat and clean the connectors. If errors continue, swap the cable, bypass the patch panel, move to another port and replace optics one at a time until the counter stays flat.
What is the most common cause of CRC errors?
The most common cause is a damaged or failing physical component, usually a cable, a dirty fiber connector or an aging transceiver. Duplex mismatches and electrical interference are the next most frequent causes, and both are easy to rule out early in an investigation.
How many CRC errors are too many on a switch interface?
The rate matters more than the total, since counters keep adding up from the last restart. A few errors against billions of frames is normal, while a count that keeps rising during business hours signals a fault, which is why platforms such as Motadata ObserveOps compare each port with its own baseline.
Can CRC errors cause data loss?
On a network, the damaged frame is dropped and TCP resends the data, so file transfers stay intact but slow down while voice and video lose the affected frames. On storage devices, a CRC error can mean unreadable data, so back up affected files quickly.
How can I monitor CRC errors across all my switches?
Use an observability platform that collects interface error counters over SNMP, trends them per port and alerts on unusual increases. Motadata ObserveOps does this across multi-vendor switches and routers and adds topology context, so each alert points to both ends of the failing link.
Author
Poonam Lalani
Content Strategist
Poonam Lalani is a B2B content strategist and writer with a background in computer engineering and experience across enterprise technology domains, including AI, cloud, DevOps, data engineering, and IT operations. She specializes in creating research-driven content that simplifies complex ideas and supports product education, thought leadership, and business growth.