How to Find and Fix Packet Loss Before It Reaches Your Users
Why do the same complaints about call quality and slow file transfers keep coming back after the network has been checked and declared healthy? Packet loss is usually the answer, and it survives investigation because it degrades the services people use without taking anything offline.
That combination makes it expensive. Equipment gets rebooted, cables get replaced, and tickets go to the internet service provider, often with nobody knowing which segment of the path is discarding traffic. The cost accumulates as repeat incidents, users who stop bothering to report problems, and engineering hours spent twice on one fault.
Resolving it takes a sequence, and that sequence is the backbone of structured network troubleshooting. In this blog, you will see:
How much loss a business network can tolerate: Targets by traffic type
How to test without being misled: Commands that catch intermittent faults
Where the loss is actually happening: Reading a hop-by-hop trace correctly
What to fix at each layer: Cause mapped to remedy, then proof it held
What is Packet Loss and Why does It Happen?
Packet loss happens when data packets sent across a network never arrive at their destination. Anyone searching for the packet loss meaning will find a definition close to that one, and our glossary entry on packet loss covers the mechanics behind it.
The definition is the easy part. Working out where the packets went is harder, partly because some loss is normal: a device receiving more traffic than it can forward drops packets on purpose to make senders ease off. Packet loss becomes a fault only when the drops are frequent enough to degrade a service, which is what makes it one of the hidden causes of poor performance that availability reporting never catches.
Three conditions produce nearly all of the packet loss seen on business networks:
Saturation: A link, queue, or device buffer fills up and traffic is discarded to relieve pressure
Physical faults: Damaged cabling, failing optics, dirty fiber connectors, or electrical interference corrupt frames in transit
Configuration and policy: Duplex mismatches, MTU problems, access control rules, or overloaded security appliances silently discard traffic
Each of these leaves a different signature. Saturation appears during predictable busy periods, while physical faults show up as error counters climbing on one interface. Configuration problems affect one traffic type or one path while everything else runs cleanly.
How Much Packet Loss is Acceptable on a Business Network?
Acceptable packet loss depends on what the traffic carries, so no single percentage works as a universal target. Real-time traffic has no chance to recover a lost packet, while bulk file transfers can simply ask for it again. The same 1% loss rate can be invisible on a backup job and unacceptable on a conference call.
The targets below are the ones network engineers design to, and they are worth writing into an internal standard.
Traffic type | Target loss | What happens beyond it |
Voice over IP | Under 1%, ideally under 0.5% | Clipped syllables, distorted audio, callers speaking over each other |
Video conferencing | Under 0.5% | Frozen frames, pixelation, audio drifting away from picture |
Interactive apps and virtual desktops | Under 0.5% | Lag on keystrokes and screen redraws, session disconnects |
TCP bulk transfer and backup | Under 0.1% on long-distance links | Throughput collapses well before the link is full |
General office browsing | Under 1% | Slow page loads, occasional failed requests |
The TCP row surprises people most. On a long-distance link, losing a tenth of a percent of packets can cut achievable throughput by more than half, because TCP reads every lost packet as a congestion signal and slows itself down. This is why a circuit that looks barely used can still deliver poor file transfer speeds.
These targets matter to anyone approving a budget or signing a service agreement. A contact center losing 1% of voice packets generates complaints and callbacks long before anyone raises an incident, and a backup window that overruns because of loss on a long-distance link becomes a recovery risk the board eventually hears about.
Three reference points settle the questions that come up most often:
What is a good packet loss percentage: Zero sustained loss inside your own network, under 0.5% for anything interactive, and above 1% treated as a fault
How much packet loss is normal: An internal LAN should show a packet loss rate of zero, while a long internet path drops the occasional single packet with no effect on service
Is a 1% packet loss bad: Acceptable on a file download, damaging on a customer phone call
So what does high packet loss mean in practice? Anything sustained above 1%, and on an internal segment anything at all, because a healthy LAN should show none. That also settles how to fix high packet loss: locate it first, because the remedy depends entirely on which segment is at fault.
Brief spikes during a traffic burst are ordinary. Loss that repeats at the same time every day, or persists for minutes at a stretch, is a fault. Alongside loss, watch jitter, because the two travel together and jitter often rises first.
How do You Check for Packet Loss?
You check for packet loss by sending a known number of packets to a target, counting how many come back, then repeating the test from different points along the path. Knowing how to check packet loss comes down to duration more than tooling, because the same command tells you very little in ten seconds and a great deal in ten minutes.
A fault that appears twice an hour will not show up in a ten-packet test. So when you test for packet loss, keep the test running long enough to catch the fault at least once.
Run a Sustained Ping With Enough Packets to Matter
A packet loss test built on ping gives you a first reading in seconds, as long as you send enough packets for the percentage to mean anything.
Windows: ping -n 200 8.8.8.8 sends 200 requests and reports the loss percentage in the summary
Windows, continuous: ping -t 8.8.8.8 runs until stopped, which is what you want when the fault is intermittent
Linux or macOS: ping -c 200 8.8.8.8 gives the same sample with a summary line
Linux, faster sampling: ping -i 0.2 -c 500 8.8.8.8 sends five packets a second for a denser picture
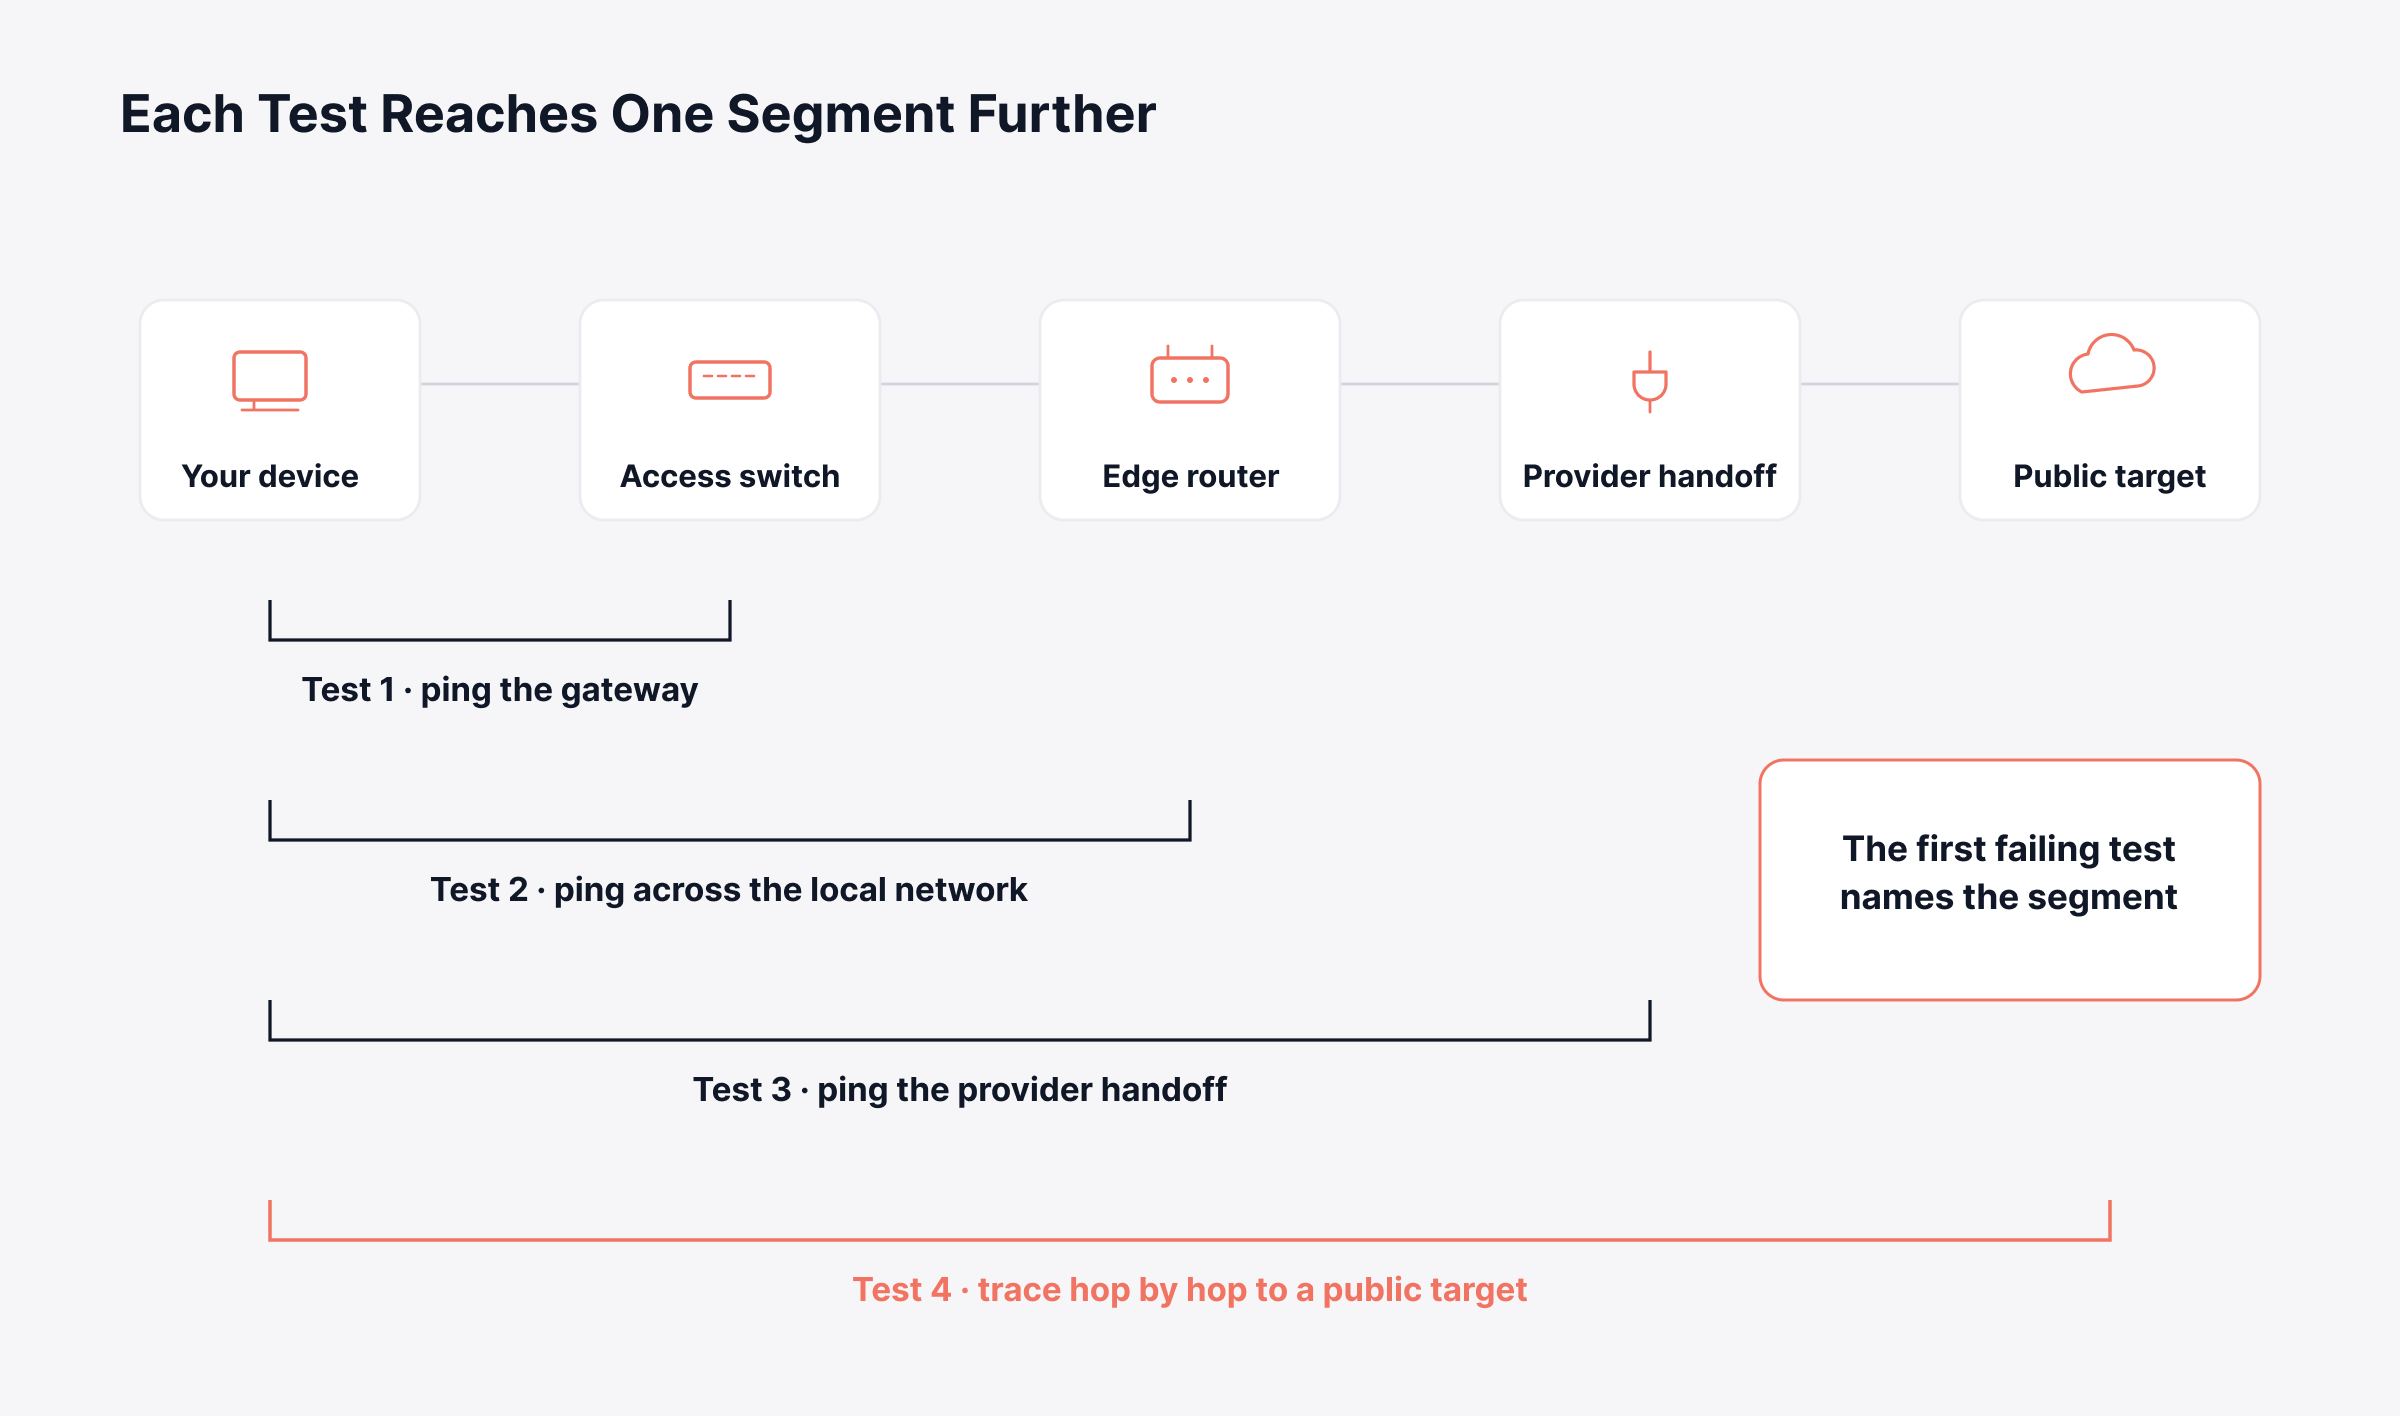
Run the same test to three targets: the default gateway, a device on the far side of the WAN, and a public address. Loss that appears only on the public address points outward. Loss that appears on the gateway points at the local segment.
Trace the Path Hop by Hop
End-to-end tests tell you loss exists. Path tools tell you where.
Windows: pathping 8.8.8.8 sends a burst of probes to every hop and reports per-hop loss, though it takes several minutes to complete
Linux or macOS: mtr --report --report-cycles 200 8.8.8.8 combines traceroute and ping into a continuously updating per-hop loss table
Test With Traffic That Matches the Application
Ping uses ICMP, the lightweight control protocol devices use for test and error messages, and network devices treat it differently from production traffic. For a test that behaves like the application, iperf3 in UDP mode reports loss and jitter for a controlled stream, and running it at a rate close to the application's real bandwidth will expose queue behavior that a ping test never touches.
Read the Error Counters on Your Network Devices
Device counters are the most reliable evidence available, because they record every discarded packet while a ping test only samples. Through SNMP polling, interface counters expose input errors, output discards, CRC errors that mark corrupted frames, and buffer failures per port. A switch reporting rising CRC errors on one port has told you the answer before any ping test runs.
A test run from one place tells you how much loss there is, and nothing about where it happens. Running the same test to progressively more distant targets fixes that, because the fault has to sit between the last test that came back clean and the first one that failed.
Why does Ping Show Packet Loss When the Network is Healthy?
Ping shows packet loss on healthy networks because routers and firewalls treat ICMP as the lowest-priority traffic on the device. Answering a ping is handled by the device's control plane, the part of the device that runs routing and management work, so many platforms rate-limit or discard ICMP requests once a threshold is crossed.
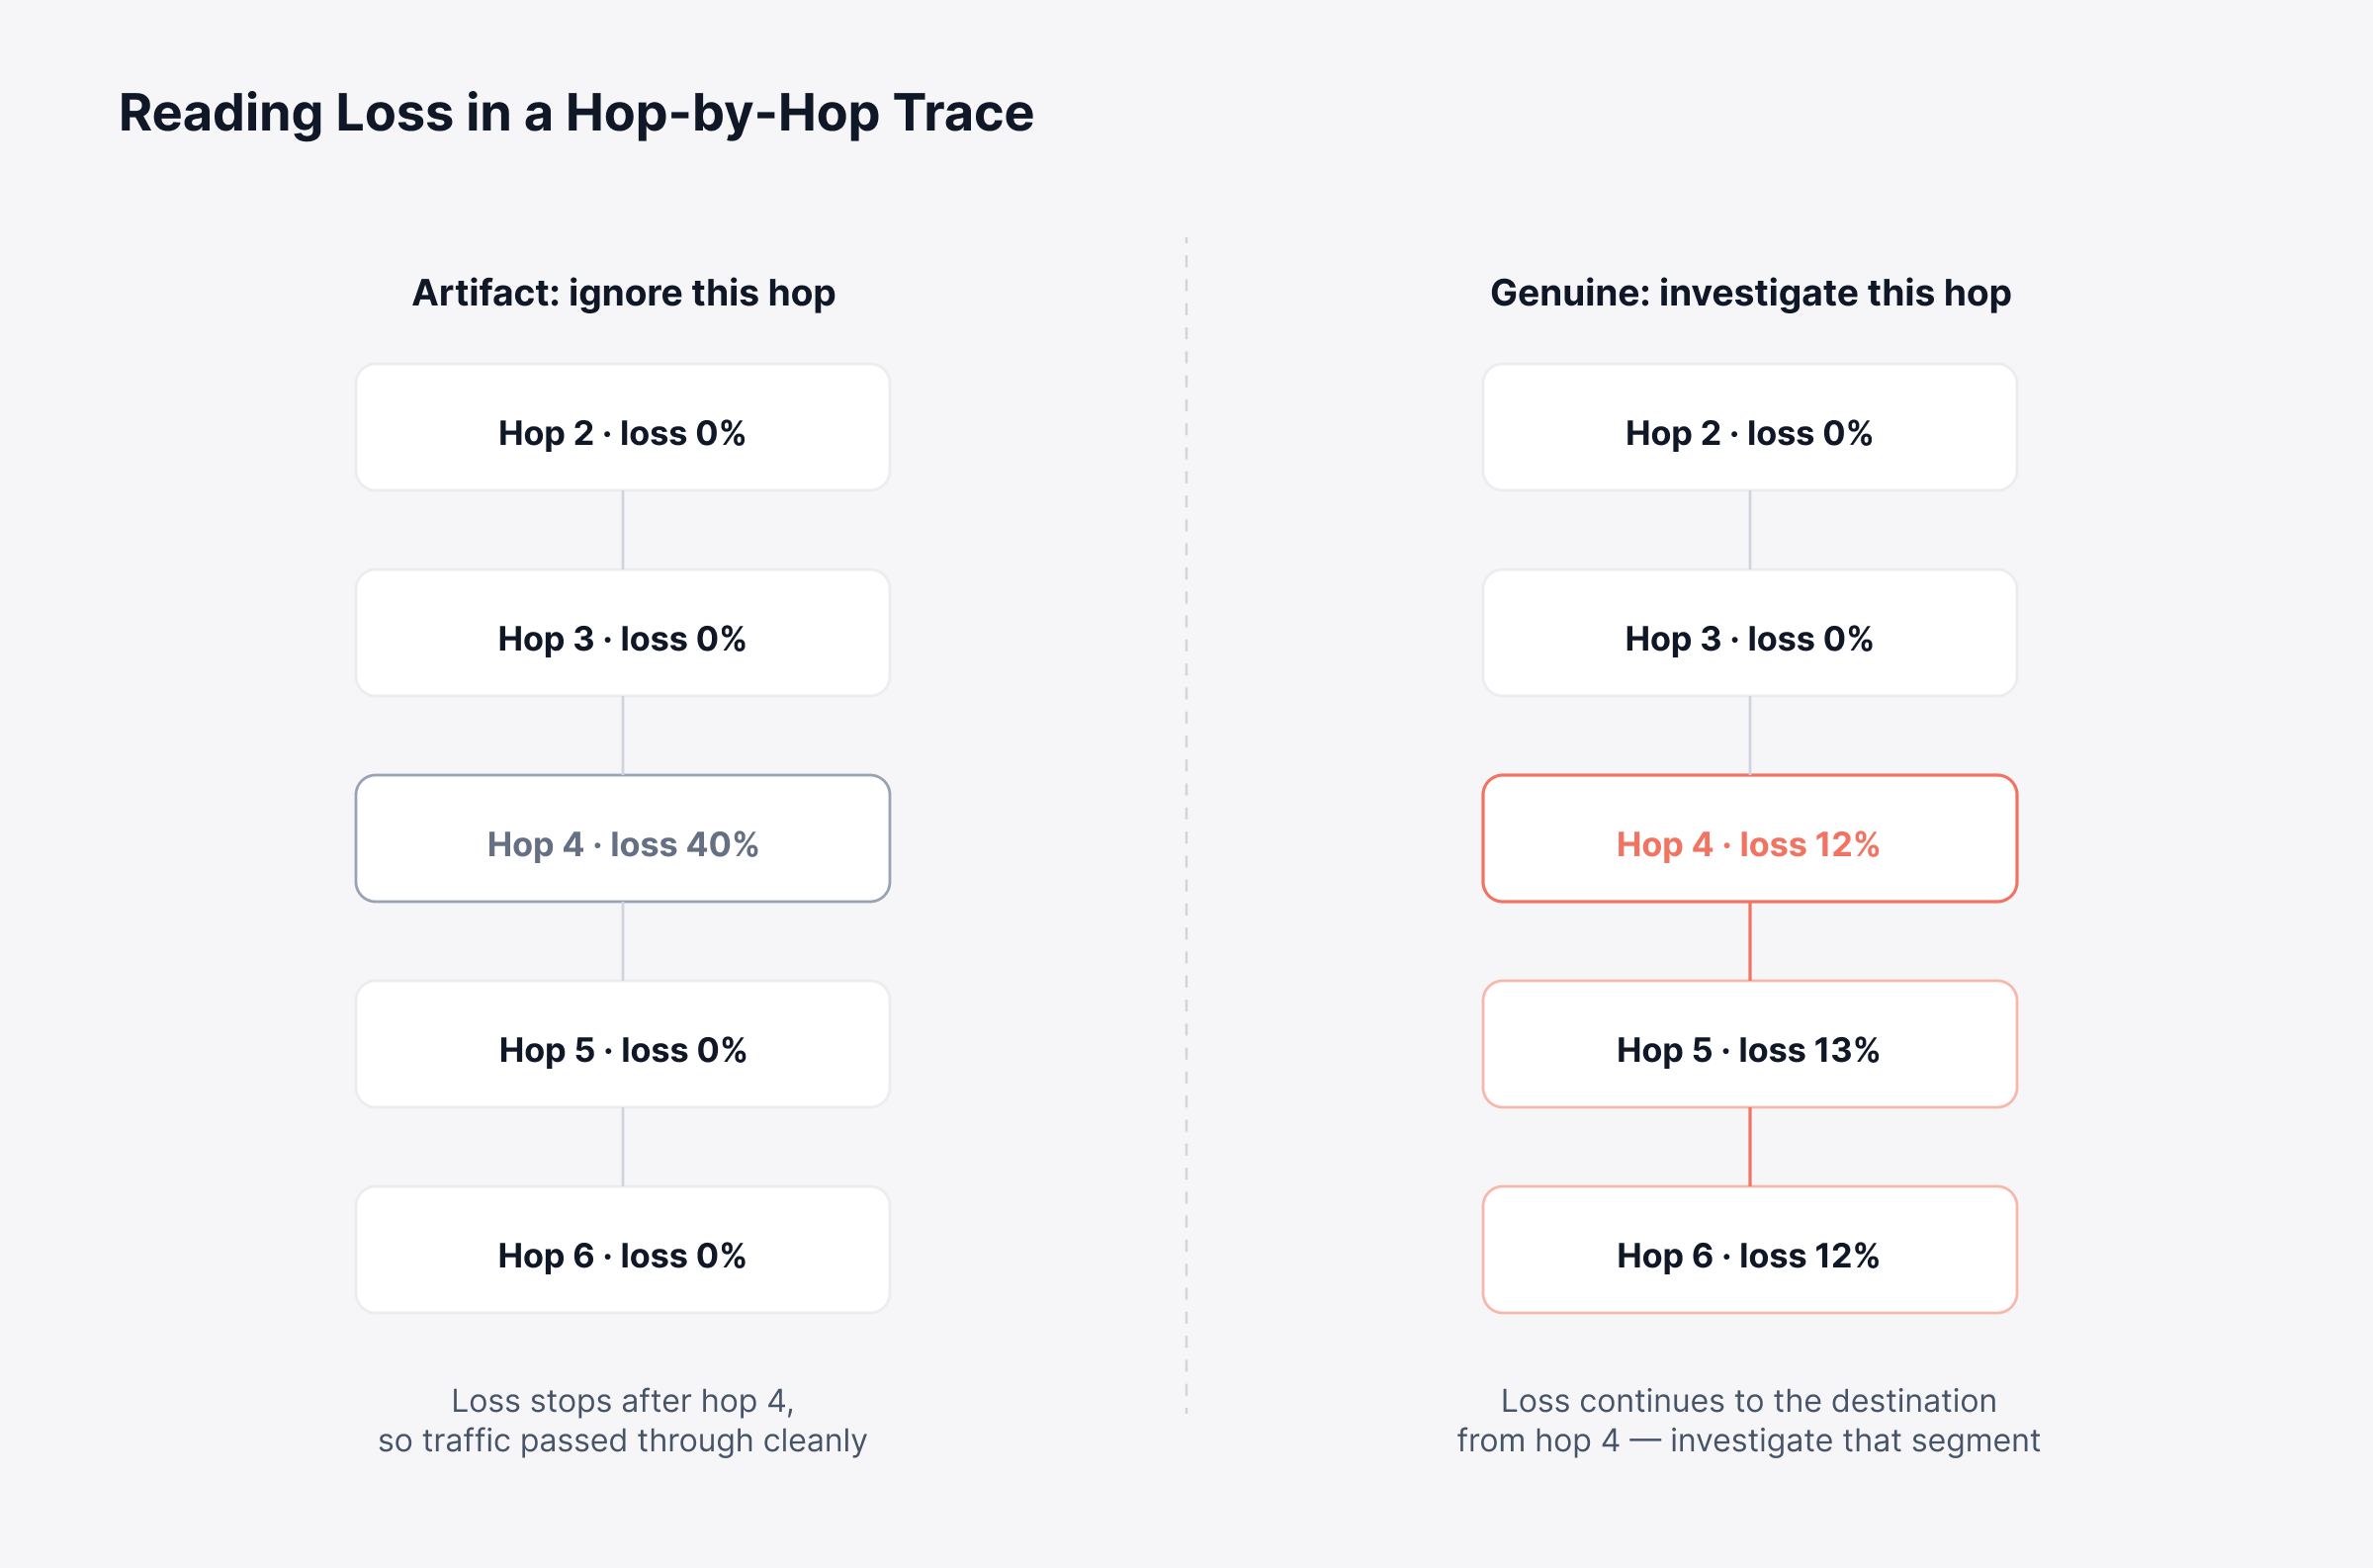
In that case the router declined to answer the ping, and no packet was actually lost. This one behavior causes most of the false alarms in packet loss troubleshooting: an engineer runs a trace, sees 40% loss at hop four, and raises a carrier ticket against a router that is forwarding production traffic perfectly.
Two rules separate a genuine fault from an artifact:
Loss at an intermediate hop that disappears at later hops is an artifact: If hop four reports 40% loss and hops five through ten report zero, traffic is passing through hop four cleanly and only its replies were throttled
Loss that begins at one hop and continues through every hop after it is genuine: The first hop where loss appears and persists to the destination is the segment to investigate
The same logic explains a common complaint: packet loss but low ping times on the same connection. Loss and network latency come from different mechanisms. A congested queue raises delay before it drops anything, while a failing cable or a firewall rule drops packets without adding any delay at all.
Reading a hop-by-hop trace correctly saves the hours normally spent escalating a hop that was never at fault. The diagram below separates the two patterns so the deciding hop is obvious at a glance.
What Causes Packet Loss at Each Layer of the Network?
Packet loss has a different cause at each layer of the network, and knowing which layer you are dealing with tells you which counter to check next. The causes of packet loss below start at the cabling and work upward, which is also the order to troubleshoot in, because the lowest layers are the fastest to rule out. Each row pairs a cause with the symptom it produces and the evidence that confirms it.
Layer | Cause | Typical symptom | What confirms it |
Physical | Damaged cable, failing SFP transceiver, dirty fiber, electrical interference | Loss on one port at all hours, unrelated to load | Rising CRC and frame errors on that interface |
Physical | Duplex mismatch between switch and device | Loss that worsens sharply as traffic rises | Late collisions on one side, FCS errors on the other |
Wireless | Co-channel interference, weak signal, too many clients per access point | Loss affecting wireless users only, worse in dense areas | Retry rate and channel utilization on the access point |
Data link | Switch buffer exhaustion during microbursts | Brief loss during traffic spikes, invisible in five-minute averages | Output discards climbing while utilization looks moderate |
Network | Link saturation and queue overflow | Loss at the same busy hours each day | Interface utilization near capacity with output drops |
Network | MTU mismatch or blocked path discovery | Large transfers fail while ping and small requests succeed | Success with small packets, failure with large ones |
Network | Asymmetric routing, where replies take a different path back, or an unstable route | Intermittent loss with no load correlation | Route changes in device logs, varying traceroute paths |
Security | Firewall or inspection appliance at capacity | Loss rising with session count while bandwidth stays flat | CPU and session table usage on the appliance |
Device | Control plane overload on a router or switch | Management traffic suffering while forwarding continues | Device CPU sustained high, control plane policing counters |
Carrier | Congestion or a fault inside the provider network | Loss beginning at the provider hop and continuing onward | Consistent per-hop loss from the handoff outward |
Two of these deserve extra attention. The first is microburst-driven buffer exhaustion, where traffic spikes for milliseconds at a time and most polling misses it entirely, because polling averages over five-minute windows. A port can sit at 30% average utilization and still overflow its buffer several times a minute.
Output discard counters are the only place this shows up, which is why network congestion diagnosis has to read discards alongside bandwidth.
Scenario: A distribution center finds its warehouse scanners dropping sessions for a few seconds each afternoon. The link graph shows utilization near 30% all day, so capacity looks adequate and the investigation moves to the application vendor. The discard counters on the access switch hold the real answer, and the fix turns out to be a queueing change that needs no new hardware.
The second is MTU mismatch, which produces the distinctive pattern of small packets succeeding while large ones vanish. A VPN tunnel or overlay adds header overhead that pushes full-size packets past the path limit, and if path discovery messages are blocked by a firewall, the sender never learns to send smaller packets. Ping works, web pages load, and file transfers stall.
How do You Fix Packet Loss Once You Know the Cause?
You fix packet loss by acting on the cause the evidence identified, because every generic remedy works on one cause and does nothing for the rest. Advice on how to reduce packet loss is only useful once the cause is known, and the same applies to any instruction on how to stop packet loss for good.
Three commonly merged questions are three separate jobs:
How to get rid of packet loss on a faulty port: A physical replacement, resolved in minutes
How to lower packet loss on a saturated link: A capacity or prioritization decision with a budget attached
How to improve packet loss figures on a crowded wireless floor: A radio design change across several access points
Rebooting a router clears a control plane problem and has no effect on a damaged cable. The fixes below are grouped by the layer the diagnosis pointed to.
Fix Physical Layer Faults First
Physical problems are the least expensive to resolve and the most commonly overlooked.
Replace the patch cable and change the switch port: Two minutes of work that eliminates the most common single-port fault
Reseat or replace optics and clean fiber connectors: Contamination on a fiber endface produces steady error rates that look like a circuit problem
Check for interference on copper runs: Cables routed alongside power lines, fluorescent fixtures, or motors pick up noise that corrupts frames
Hard-set or auto-negotiate both ends together: A duplex mismatch, where the two ends disagree on whether they can send and receive at once, is resolved by configuring both sides as a pair
Restart the affected device once, then stop: Power cycling clears a stuck buffer or an overloaded control plane, and repeating it at every incident leaves the underlying cause in place
Relieve Congestion Where Traffic Exceeds Capacity
When the cause is saturation, you either reduce what is competing for the link or protect what matters most on it.
Apply QoS policies that classify and prioritize: Give voice and interactive traffic a priority queue so bulk transfers absorb the loss instead
Identify the top talkers before adding bandwidth: Flow data names the hosts and applications filling the link, and the answer is usually backups, replication, or software distribution, all of which can be rescheduled at no cost
Shape traffic at the WAN edge: Shaping to just below the contracted rate means queuing happens on your equipment, where you decide what waits
Increase buffers or capacity where bursts are structural: Where the traffic pattern is legitimate, more headroom is the only remaining answer
None of these decisions can be made without flow data, since flow data is what names the conversations filling the link. Our guide to NetFlow traffic monitoring covers how it is collected and read.
Correct Configuration and Path Problems
Configuration faults produce loss with no hardware symptom anywhere, which is how they survive several rounds of cable swaps and device replacements.
Align MTU across the path and permit path discovery: Allow the relevant ICMP messages through firewalls so senders can adjust automatically
Reduce the tunnel MTU where overhead is unavoidable: Lowering the interface MTU inside VPN tunnels resolves the large-packet failure pattern
Review access control rules and inspection policies: Silent discards by a security appliance produce loss with no interface errors anywhere
Stabilize routing before chasing hardware: Flapping routes and asymmetric paths create intermittent loss that no cable replacement will fix
Keep device firmware and network drivers current: Known forwarding and adapter faults are corrected in vendor releases, and old code turns a solved problem back into an open investigation
Address Wireless Loss at the Radio Layer
Wireless loss is a radio problem in almost every case. Moving the affected user to a cable confirms the diagnosis and changes nothing about the radio environment, so three other changes do the actual work:
Reduce transmit power: Shrinking cell overlap cuts the interference clients cause each other
Move to less crowded channels: Co-channel neighbors compete for the same airtime
Add access points in dense areas: Client counts per access point matter more than signal strength, since a strong signal shared by too many clients still produces retries
Escalate to the Provider With Evidence
When the loss begins at the carrier handoff and continues to every hop beyond it, the fix belongs to your ISP. Providers close tickets faster on evidence than on description, so send four things:
Continuous test output: Several hours of sampling, covering at least one period when the loss occurred
The specific hop where loss begins: Showing that every hop after it reports the same figure
The circuit identifier: So the ticket reaches the team that owns the link
The times the loss occurred: Dated, so the provider can check them against their own records
Send less than this and the loss discarded inside the carrier network gets attributed straight back to your equipment.
Scenario: A regional office sees voice quality degrade every morning, and every internal test up to the WAN handoff comes back clean. With no per-hop evidence, the provider ticket stalls for a week while each side points at the other's equipment. A continuous trace showing loss starting at the provider hop and persisting to every hop after it moves that ticket to a circuit investigation on the first call.
How do You Fix Packet Loss on a PC or Single Endpoint?
You fix packet loss on a PC by treating the adapter and its cable as the suspect, because a fault that affects one machine while everything else on the same switch runs cleanly is local by definition. The steps for how to fix packet loss on PC endpoints are narrower than network-wide work, since the path itself has already proved healthy.
This is also where 100% packet loss usually appears, and that figure almost always points to a broken link or a blocked path.
Work through seven checks on the endpoint, in this order:
Swap the ethernet cable and change the port: The single most productive step, and the answer to most cases of packet loss on a wired ethernet connection
Update or roll back the network adapter driver: Driver faults produce loss that follows the machine when it moves to another port
Check adapter speed and duplex settings: A manually forced setting from a previous troubleshooting session is a frequent cause
Disable power saving on the adapter: Energy-efficient ethernet and selective suspend interrupt traffic on idle connections
Check what else the machine is sending: Backup agents, cloud file sync, and software updates saturate a small uplink and produce loss that resembles a network fault
Test with security agents and the VPN client paused: Endpoint inspection software discards traffic in ways that look identical to a network fault
Reset the network stack and retest: Clears corrupted configuration state before you conclude the hardware has failed
A reading of 100% loss to one destination while other destinations respond normally points at a routing or firewall block. A physical fault would take out every destination at once, including the default gateway.
Upload packet loss deserves a check of its own, since a saturated uplink discards outbound traffic while downloads continue to look healthy. Test both directions before you conclude the connection is clean.
How do You Stop Packet Loss From Coming Back?
You stop packet loss recurring by watching the path continuously, so a fault becomes visible while it is still small. Manual tests sample a few minutes out of a day, which is how intermittent loss survives several rounds of investigation.
Almost all advice on how to prevent packet loss comes back to that one habit. Continuous packet loss monitoring turns a fault nobody could reproduce into a pattern with times attached to it.
Four practices keep the problem from returning:
Baseline loss per path and alert on deviation: A fixed threshold misses a link that normally runs at zero and starts running at 0.3%, so compare against what normal looks like for each path
Poll interface error and discard counters alongside utilization: Discards reveal the microburst problem that bandwidth graphs hide entirely
Run synthetic tests along the paths that carry critical services: Continuous probes between sites detect loss before a user does, including on paths with no traffic at that moment
Track configuration changes against loss events: A duplex or MTU change made during a maintenance window is far easier to identify when both timelines are lined up together
The four work as a cycle, and the last one matters most: a baseline that nobody resets after a fix quietly turns back into a fixed threshold. The business case for continuous observability is the gap between two outcomes. A fault you find by measuring becomes a scheduled change, and the same fault found by a user becomes an incident with a queue of complaints behind it.
Motadata ObserveOps is built for this pattern of work:
Per-device and per-interface collection: Latency, packet loss, and bandwidth utilization gathered continuously, alongside error and discard counters
Hop-by-hop path analysis through NetRoute: The failing segment is identified without anyone running a manual trace
Flow ingest across NetFlow, sFlow, jFlow, and IPFIX: The conversations behind a saturated link are named
Dynamic baselines per path: A rise from zero to 0.3% loss raises an alert while the change is still small
Change records alongside loss events: Configuration and compliance data lines up device changes with the incidents that followed
That same console covers switch port monitoring down to individual interfaces.
Choosing what to watch is its own decision, and our breakdown of network performance metrics covers which indicators belong on the dashboard alongside loss.
Locate Packet Loss in Minutes Instead of Hours with Motadata ObserveOps
Packet loss stays unresolved when the investigation produces a percentage and no location. A ping test tells you something is wrong somewhere on the path, and the hours after it go on guessing which segment is responsible. The method in this guide replaces the guessing with a sequence: measure, narrow to a segment, read the counters that confirm the cause, then apply the fix that cause requires.
It is worth being clear about the limits of any observability platform. No tool will repair a damaged fiber run or fix congestion inside a carrier network, and the fix for a physical fault will always be physical. What Motadata ObserveOps does is bring that sequence into one console, so investigations close with an answer, the same segment stops producing repeat incidents, and provider conversations open with dated evidence.
FAQs
How much packet loss is acceptable on a business network?
Anything above 1% should be treated as a fault worth investigating, and interactive traffic needs tighter limits than that. Voice and video quality begins degrading below 1%, so 0.5% is the practical ceiling for real-time services. Sustained loss on an internal network should be zero.
Why do I see packet loss in a traceroute but the connection works fine?
Routers give ICMP replies the lowest priority and rate-limit them when busy, so an intermediate hop can report heavy loss while forwarding production traffic without any issue. The test is whether loss continues at every hop after that point. If later hops report no loss, the reading at that hop is an artifact.
Can my internet service provider be the cause of packet loss?
Yes, and carrier-side congestion is a common cause of loss that no internal change will resolve. Run a continuous hop-by-hop test and identify the first hop where loss begins and persists to the destination. Platforms such as Motadata ObserveOps run that path analysis continuously, so the evidence is already dated and ready when you raise the carrier ticket.
Why am I getting packet loss on a wired ethernet connection?
Wired loss on a single machine usually traces to the patch cable, the switch port, the adapter driver, or a duplex mismatch between the two ends. Swap the cable and port first, then check the adapter settings and driver. Endpoint security agents and VPN clients discard traffic in ways that resemble a hardware fault.
What is the best way to monitor packet loss continuously?
Continuous monitoring works best when it combines per-interface polling of error and discard counters with synthetic probes along the paths carrying critical services. Motadata ObserveOps collects both and applies dynamic baselines per path, so a small rise above normal raises an alert while it is still inexpensive to correct. Manual ping tests only sample a few minutes at a time.
Author
Poonam Lalani
Content Strategist
Poonam Lalani is a B2B content strategist and writer with a background in computer engineering and experience across enterprise technology domains, including AI, cloud, DevOps, data engineering, and IT operations. She specializes in creating research-driven content that simplifies complex ideas and supports product education, thought leadership, and business growth.