All Features
Network Observability
Network Interface Monitoring
Obtain the most accurate and detailed insights and identify the abnormal activities into the network interfaces.
Network Interface Monitoring can help you obtain healthy performance and nullify slow network traffic. Motadata ObserveOps helps you with comprehensive interface bandwidth analysis and performance monitoring.
Motadata ObserveOps offers one comprehensive end-to-end solution to resolve network performance issues, monitors interfaces proactively, and gets real-time insight reports of traffic and interface parameters.
Network Interface Monitoring with Motadata ObserveOps
Motadata provides a single screen to monitor each and every interface. It also comes with a handful of capabilities, as mentioned below.
Identify, diagnose, and troubleshoot network interface performance issues
Track traffic utilization, error rates, and discard packets with the support of interface monitoring
Monitor crucial interface-related linkup and link down SNMP traps
Find the root cause of any performance issues due to the high error rate into respective interfaces.
Identify interface performance by analysing the traffic data across the relevant network devices.
Monitoring Switch Interfaces
In Motadata ObserveOps, after you have discovered any networking device, you can provision those specific interfaces based on the use cases. You can also tag them depending on the requirement to monitor respective interfaces whether it is an inbound or outbound interface.
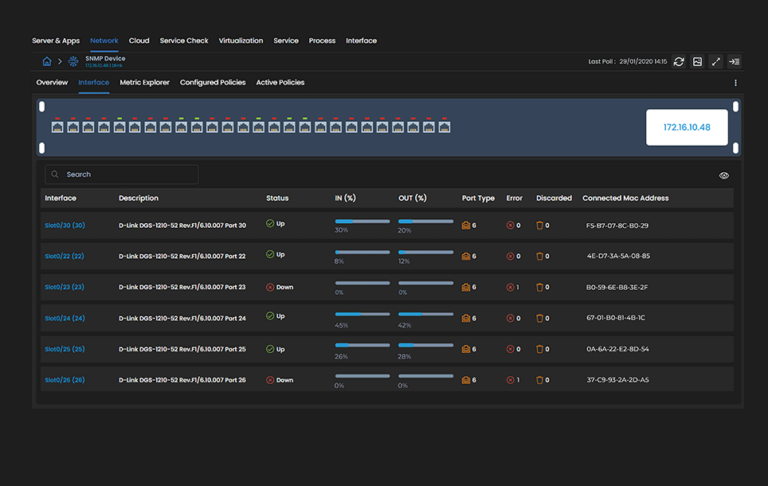
At the same time, you will be able to monitor Vlan and SPM details to have holistic network visibility. You can also track STP details to prevent network issues.
Interface Utilization Trends with Network Flow
With the unusual traffic, organizations often go through traffic issues. Sometimes, the heavy traffic makes the network slow.
Motadata ObserveOps monitors the network flow data coming from NetFlow, sFlow, JFlow, etc. This leads to identifying the usage of traffic consumed by applications, users, and protocols. With Flow monitoring and packet capturing, Motadata can discover, diagnose and resolve network performance issues.
Network flow assists you in identifying top talkers in the network, knowing which applications have a higher consumption, which specific application is communicating on a specific port, how network traffic travels through a particular interface, and more.
Businesses that rely on crucial cloud-based services must prioritize traffic allocations. Motadata ObserveOps helps obtain interface utilization and improves the quality of service.
Monitoring Key Interface Metrics
Motadata ObserveOps lets you monitor various interface metrics such as error rate, discard rate, packet loss, interface utilization etc.
List of Important KPI for Network Interface Monitoring:
Sr. No. | KPI | Description |
|---|---|---|
1. | interface.packets | Number of packets on the interface |
2. | interface.error.packets | Number of error packets on the interface |
3. | interface.sent.octets | Number of octets sent on the interface |
4. | interface.discard.packets | Number of discarded packets on the interface |
5. | interface.bit.type | Bit type of the interface |
6. | ip.route.interface.index | The index of the network interface associated with the IP route |
7. | interface.speed.bytes.per.sec | Speed of data transfer in bytes per second |
8. | interface.traffic.utilization.percent | Percentage of interface bandwidth being used |
9. | interface.traffic.bytes.per.sec | Total traffic on the interface in bytes per second |
10. | interface.out.traffic.utilization.percent | Percentage of outbound traffic bandwidth used |
11. | interface.in.traffic.utilization.percent | Percentage of inbound traffic bandwidth used |
Interface Dashboard & Reports
Motadata ObserveOps offers detailed interface widgets of various metrics such as Discard rate, Interface utilization, interface traffic, error rates, etc. The widgets are helpful for monitoring the performance of interfaces for a particular period.
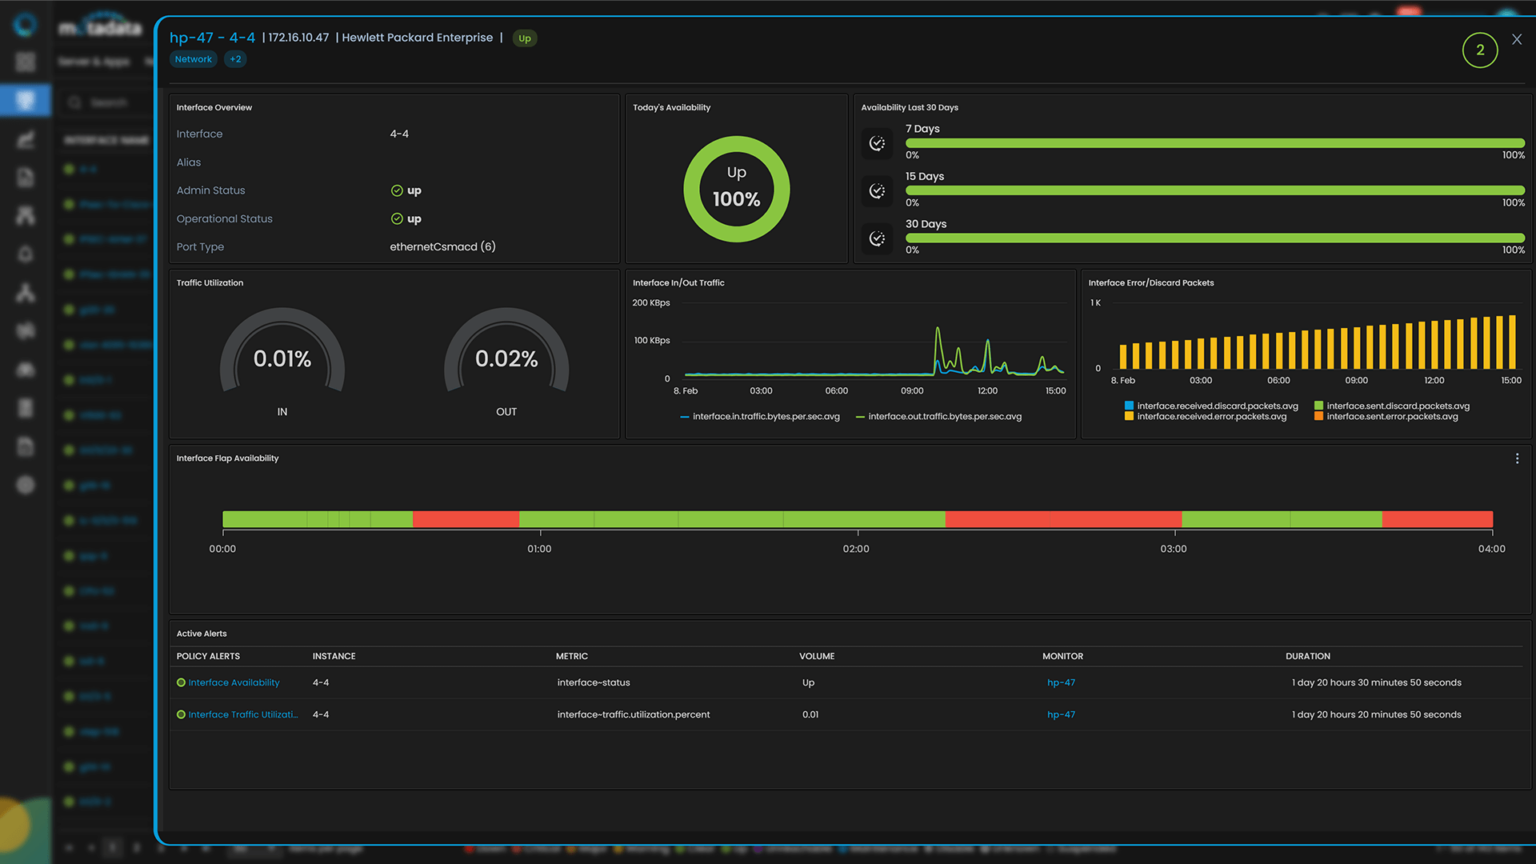
The widgets can also be generated as reports, which can be helpful for audit or presentation purposes. In addition, Motadata ObserveOps offers pre-built, default, out-of-the-box reports for such monitoring metrics, which can be helpful for capacity planning and decision-making.
ObserveOps powered by Motadata is one unified monitoring solution created with cutting-edge technologies like Artificial Intelligence and Machine Learning. It makes the network smart by monitoring all the network interfaces.
Ready to implement Network Interface Monitoring?
Discover how Motadata ObserveOps can help you monitor your infrastructure in real-time and respond to issues instantly.