What is Application Availability Monitoring? Metrics, SLAs and Tools
Application availability monitoring checks whether people can reach and use an app. That's a stricter test than checking if its server is switched on. It runs scheduled tests against pages, APIs and services.
Then it turns the results into a percentage you can track against a target. The hard part is deciding what counts as down. Microsoft's availability test docs note that about 80% of failed checks pass on a retry.
A good setup catches real outages within minutes and ignores brief network blips. It also works best alongside application performance monitoring, which shows why an app slowed down or failed.
In this blog, you will:
Learn what application availability monitoring covers and how the main types of checks work.
Get the metrics, formulas and downtime math behind availability targets and SLAs.
Pick up best practices and a checklist for choosing availability monitoring tools.
What Is Application Availability Monitoring?
Application availability monitoring is the regular testing of an app. Each test checks that the app responds correctly to the people and systems that use it. The result is usually shown as the percentage of time the app was available in a set period, such as a month.
The word correctly matters in that definition, because a server can answer every ping while its login page returns an error. A load balancer can also return a 200 OK status for a page that tells users the service is unavailable. We count both cases as downtime, because a user can't finish their task in either one.
Availability and performance monitoring ask two different questions about the same app. Availability asks whether the app works at all, and performance asks how well it works when it does.
The two overlap a little, since most tools count a response slower than the set timeout as a failed check.
How Does Application Availability Monitoring Work?
Application availability monitoring works by sending test requests to an app on a schedule. Each response is then checked against rules you define. If a check fails enough times in a row, the tool marks the app as down and raises an alert.
Most teams combine several types of checks, since each one sees a different part of the problem:
Check Type | What It Confirms | What It Can Miss |
Ping (ICMP) | The host is reachable on the network | Whether the application on that host is running |
Port check | A service is listening on its TCP or UDP port | Whether the service sends back valid responses |
HTTP or URL check | A page returns the expected status code and content | Steps that happen after the first page loads |
API check | An endpoint accepts a request and returns the right fields | Problems in the user interface |
Synthetic transaction | A scripted user journey, such as login and checkout, completes | Issues that only real traffic patterns trigger |
Real user monitoring (RUM) | Page loads and errors seen by real visitors | Outages during quiet hours with no visitors |
Health endpoint | The app's own report on its database, cache and other dependencies | Failures the app doesn't know how to detect |
Ping and port checks are cheap and fast, but they only confirm that the host and the service are reachable.
Content and API checks confirm that the app returns the right answer. Synthetic monitoring tests a planned user path before real traffic arrives. RUM records what real visitors went through.
Most teams don't treat RUM vs synthetic monitoring as an either-or choice. Synthetic tests cover quiet hours with no visitors, and RUM catches issues that only real traffic triggers.
Where a check runs from matters as much as what it tests. A check inside your data center can pass while users outside can't resolve your domain. An outside check, in turn, can't see an internal app at all. For that reason, we run checks from both sides of the firewall.
Take a fictional online store whose checkout app runs on its own app servers, a product database and a third-party payment API.
For that store, we'd poll the login page every minute from inside the network and from at least one outside location. We'll come back to the same store in the examples below.
Which Application Availability Metrics Should You Track?
The core application availability metrics are availability percentage, downtime, mean time to repair (MTTR) and mean time between failures (MTBF). A few supporting metrics help explain why availability dropped.
Not every metric needs an alert, so the table below marks the ones we'd alert on and the ones we'd watch on a dashboard:
Metric | What It Measures | Alert or Watch |
Availability percentage | The share of checks or minutes in which the app worked, which is the number most SLAs are written against | Alert when the error budget is being spent faster than the period allows |
Downtime | The total minutes the app was unavailable during a period | Watch, and report it to business teams, who read minutes more easily than percentages |
MTTR | The average time from a failure to full recovery | Watch the monthly trend to see how quickly your team restores service |
MTBF | The average time between one failure and the next | Watch the monthly trend to see how often things break |
Error rate | The share of requests that fail with server errors | Alert on a sustained rise above your normal baseline, since it often comes before a full outage |
Response time by phase | DNS lookup, connection and time to first byte, each measured on its own | Watch, and use it to find the slow layer during an incident |
Check success by location | The pass rate from each place you test | Alert when several locations fail together, because a single failing location usually means a network or DNS issue |
SSL certificate expiry | The days left before a certificate runs out | Alert with enough lead time to renew, such as 30 days, because browsers block expired sites |
Availability targets are usually written as nines, and each extra nine cuts the allowed downtime by a factor of ten. The figures below use an average month of about 43,830 minutes and a 365.25-day year:
Availability Target | Downtime per Month | Downtime per Year |
99% | 7 hours 18 minutes | 3 days 15 hours |
99.5% | 3 hours 39 minutes | 1 day 20 hours |
99.9% | 43.8 minutes | 8 hours 46 minutes |
99.95% | 21.9 minutes | 4 hours 23 minutes |
99.99% | 4.4 minutes | 52.6 minutes |
99.999% | 26 seconds | 5 minutes 16 seconds |
The last row is the five nines uptime target, which allows about 26 seconds of downtime a month. Very few business apps need it. Reaching it takes redundancy at every layer, from power and network links to databases.
How to Calculate Application Availability
The basic formula is availability = uptime ÷ (uptime + downtime) × 100. Say an app runs through a 30-day month, which is 43,200 minutes, and it's down for 30 of them. Its availability is 43,170 ÷ 43,200 × 100, which comes to 99.93%.
You can also work it out from reliability numbers with MTBF ÷ (MTBF + MTTR) × 100. An app that fails every 720 hours on average and takes one hour to recover lands at 720 ÷ 721 × 100, which is 99.86%.
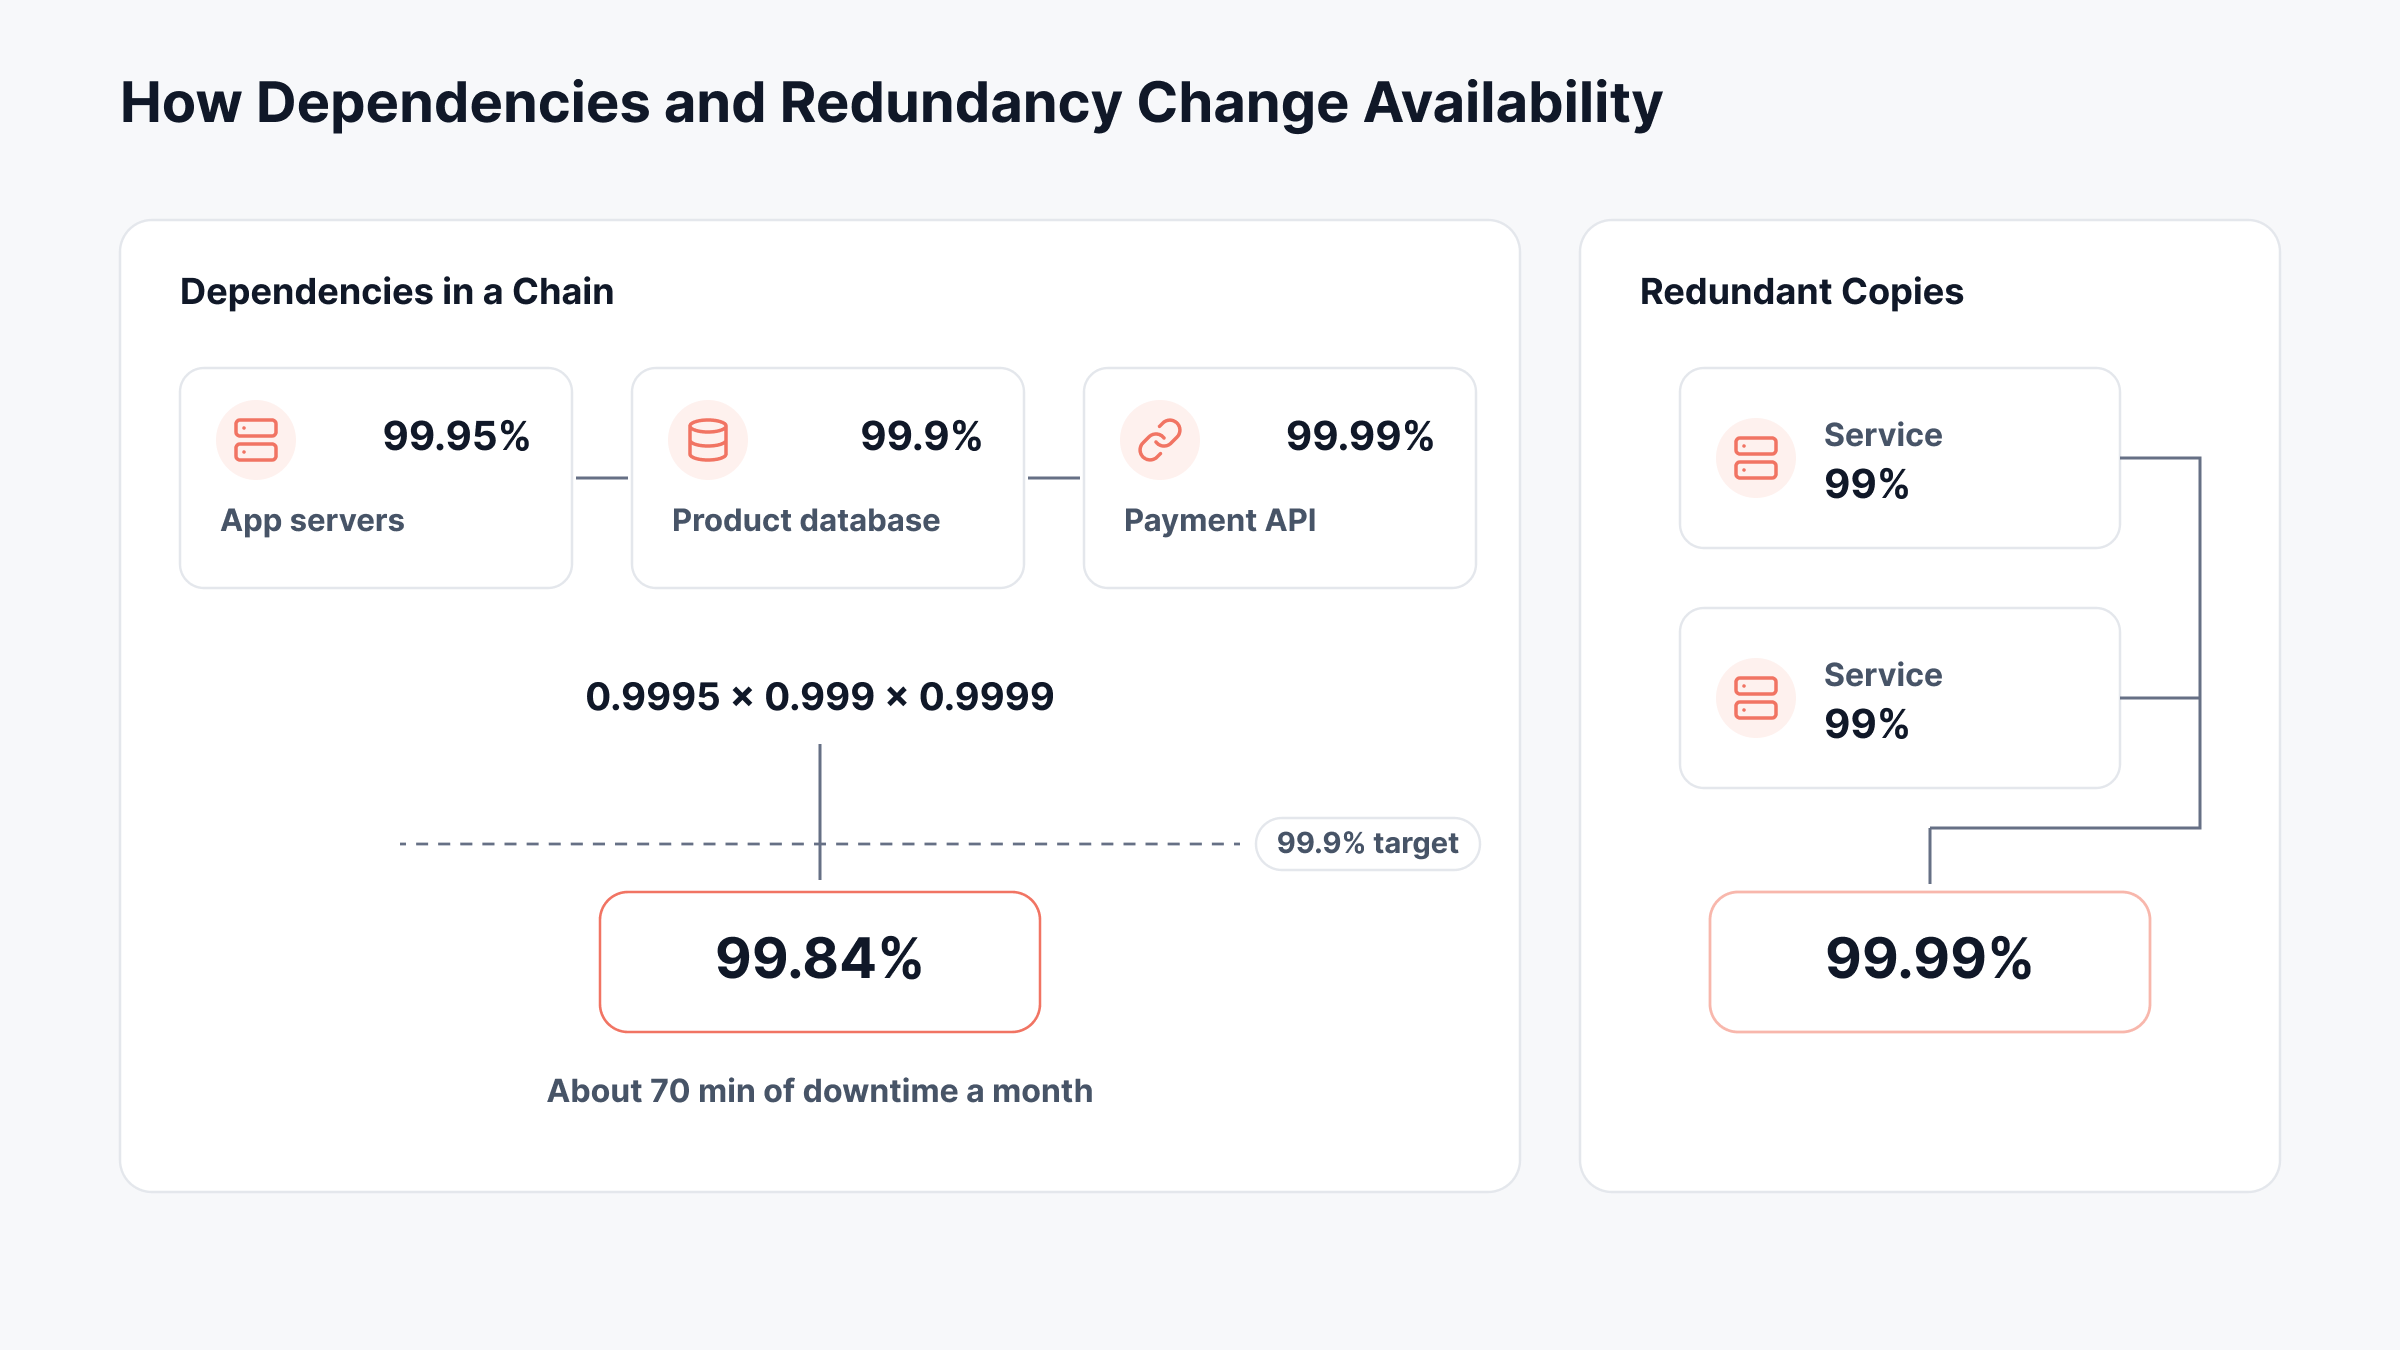
Dependencies pull that number down further. When an app needs several services, their availability figures multiply together. As a result, the app can never be more available than the chain of services underneath it:
Setup | Calculation | Best Possible Availability |
App running on one service at 99.95% | 0.9995 | 99.95% |
The same app that also needs a database at 99.9% | 0.9995 × 0.999 | 99.85% |
Add a third-party API at 99.99% | 0.9995 × 0.999 × 0.9999 | 99.84% |
Two redundant copies of a 99% service | 1 − (0.01 × 0.01) | 99.99% |
If the store's checkout runs on those three services, it can't honestly promise 99.9%. Its dependencies alone could cause about 70 minutes of downtime a month.
That's well over the 43.8 minutes a 99.9% target allows. Redundancy pushes the number back up, so two independent copies of a 99% service reach 99.99%. That only holds if the copies don't fail at the same time.
How Do SLAs Define Application Availability?
An SLA defines application availability with three things. It states the target percentage, how it's measured and what happens when the provider misses it.
The percentage gets most of the attention, but the definitions around it decide what the number really means. These are the parts we read first in any availability SLA:
What counts as down: Some SLAs count only a full outage. Others also count error rates above a set level or responses slower than a limit.
Measurement window: A monthly target can hide a few short bad days, while a daily target exposes them. Most SLAs use a calendar month.
Exclusions: Most SLAs leave out planned maintenance, problems the customer caused and events outside anyone's control.
Where it's measured: The provider's own checks and your users' experience can disagree. A good SLA states whose numbers count.
Penalties: Missing the target usually triggers a service credit or an SLA penalty, often worked out as a share of the monthly fee.
Teams that run their own apps can apply the same idea internally through an error budget. A 99.9% monthly target leaves about 43.8 minutes of downtime, and every incident spends part of it.
Say the store's payment API goes down for 20 minutes on the fifth day of the month. That one incident uses about 46% of the budget and leaves roughly 24 minutes for the remaining 25 days.
When the budget runs that low, we slow down risky releases until reliability recovers. Tracking the budget as you go keeps SLA compliance from turning into a surprise at the end of the month.
What Is App Uptime Monitoring?
App uptime monitoring is the simplest layer of availability monitoring. It checks on a schedule that an app or its host responds, and it records how long the app stays up between failures.
Uptime checks cost very little, so they often run every minute. They're usually the first alert to fire when an app goes fully down.
Uptime alone doesn't show whether people can use the app. An app can stay up while a failed database query breaks every search. An uptime check will still report that app as healthy.
That's why we treat uptime as the base layer and add content checks, API checks and SLO tracking on top of it. The same approach applies to networks, where uptime assurance covers devices, interfaces and links.
What Are the Best Practices for Application Availability Monitoring?
Most best practices for application availability monitoring come down to two things. Measure what users actually experience, and filter out the noise. These are the eight we'd put in place first:
Check from more than one location: A single test location can't tell an app outage from a local network problem. Microsoft recommends at least five test locations, with an alert when three of them fail.
Require consecutive failures before alerting: Since most failed checks pass on retry, alerting on the first failure mostly creates noise. Waiting for two or three failures in a row removes most false alarms.
Test a real user path: A homepage check misses broken logins, searches and payments. Point at least one check at the action your users care about most, and verify the content that comes back.
Use a proper health endpoint: A /health route that checks the database, cache and key APIs gives a more accurate answer than a static page. Keep it light, so the check doesn't add real load.
Watch the dependencies users can't see: DNS, SSL certificates and third-party APIs cause plenty of outages that look like app failures. Give each of them a check of its own.
Exclude planned maintenance properly: Schedule maintenance windows in your monitoring tool, so planned work doesn't count against your targets. Pausing alerts by hand also works, but it depends on someone remembering to turn them back on.
Alert on SLO risk, not single blips: One failed check matters less than a trend that threatens your monthly target. We alert when the error budget is being spent faster than the month allows.
Connect alerts to action: Each availability alert should point to a runbook or open an incident ticket. The sooner someone knows what to do, the lower your MTTR will be.
What Should You Look for in Application Availability Monitoring Tools?
Good application availability monitoring tools test from where your users are. They check content and API responses, not just status codes. They should also turn the results into reports you can compare against an SLA. Most products fall into one of four groups, and many teams use two of them together:
Tool Type | Best For | Typical Gap |
External uptime checkers | Simple public websites and status pages | Little insight into why something failed |
Synthetic monitoring platforms | Scripted user journeys tested from many regions | No view of internal servers and networks |
APM tools with RUM | Code-level causes and real user impact | Weaker coverage when no users are active |
Unified observability platforms | Linking app checks to servers, networks and SLOs | Test locations depend on where you deploy collectors |
During a trial, these are the checks we'd run on any tool:
It runs HTTP, API, DNS, port and SSL checks, with content validation on the responses.
It can test from inside your network as well as from outside it.
It lets you set retries and consecutive-failure rules before an alert fires.
It measures uptime against SLO targets and leaves out planned maintenance.
It links a failed check to the server, database or network device behind it.
It produces availability reports that business teams can read without help.
How ObserveOps Turns Checks Into Availability Numbers
ObserveOps turns check results into alerts, SLO scores and reports. Each step is set up in its own part of the product. Below, we walk through the settings we'd set up first, alongside our application performance monitoring module.
Service Checks for Each Layer of the App
ObserveOps runs service checks against Ping, Port, URL, REST API, DNS, SSL Certificate, NTP, RADIUS, FTP, Email and Domain targets.
You add them through a discovery profile, found under Menu, Settings, Discovery Settings and Discovery Profile. After discovery, you provision the results as monitors. The checks run from your Collectors or through a MotaAgent, so internal apps behind a firewall can be tested as well.
For APIs, the REST API check supports the GET, POST, PUT and DELETE methods, with a request body in JSON, plain text or XML. Its content check accepts Should contain and Should not contain values. With these, you can fail a response that returns a 200 status but carries an error message in the body.
URL Timings That Point to the Failing Layer
The URL monitoring check splits every request into phases and reports each phase as its own metric.
These three metrics show where the time goes:
url.dns.lookup.time.ms
url.connection.time.ms
url.first.byte.time.ms
Two more, url.response.code and url.content.found, show whether the response was correct.
Say response time on the store's login page rises from 400 ms to 3 seconds. The phase metrics show where to look:
DNS lookup time carries most of the increase: The app itself is fine, and the DNS provider is slow.
First-byte time carries most of the increase: The server or the code behind it has slowed down.
The response code stays at 200 while content found drops to zero: The page loads but no longer shows the expected content.
Availability Policies That Ignore Single Blips
An Availability Policy raises an alert when a monitor goes down, and you create one under Menu, Settings and Policy Settings.
The following two fields control how quickly it fires.
Notify if Monitor/Instance is down for sets the evaluation window.
Abnormality occurrence sets how many down polls in a row must fall inside it.
Take a 1-minute poll, a 5-minute window and 3 occurrences. Three down results in a row inside that window trigger an alert. If the second poll comes back up instead, the window resets, and the policy waits for three new failures in a row.
This builds the consecutive-failure practice from the list above into the policy itself. The same policy can also run a runbook or declare an incident through an integration profile.
SLOs That Track Availability and Speed
SLO profiles sit under Settings, in the Service Level Objectives category. Each one has either an Availability or a Performance type.
Availability SLOs measure whether selected monitors, groups or tags stayed up. Performance SLOs use metric, APM, RUM or NetRoute data.
Every SLO runs on a daily, weekly, monthly or quarterly window, with a target and a higher warning level. Our unified SLO creation handles all of these types from one screen.
The docs walk through an example. A team sets an APM Performance SLO on a payment API, with response time under 300 ms, a daily window and a 99% target.
The next morning, the SLO shows 97.3% achieved, so the on-call team is notified before the business day starts. Daily SLO data refreshes every 15 minutes, weekly data every 30 minutes, and monthly or quarterly data every hour.
Corrections and Penalties for SLA Reporting
A Correction Profile stops planned downtime from counting against an SLO. You create one under Settings, SLO and Correction Profile.
Each profile leaves out set periods, grouped into categories such as Public Holiday, Business Maintenance and Scheduled Deployment.
It can apply once or on a repeating schedule, such as every Sunday night, and you attach it to an SLO from the SLO History tab.
A Penalty Profile, found under Settings, SLO and Penalty Profile, attaches a financial cost to the result. You enter a contract amount and up to 10 slabs, each with an SLO range and a penalty percentage.
In the docs example, a 60% achieved SLO falls into the below-70% slab, which carries a 7% penalty. On a contract worth 10 million rupees, that comes to a 700,000 rupee penalty. Both corrections and penalties apply only to SLO cycles that have finished.
Flap Reports for Apps That Keep Bouncing
Some apps go down for a minute or two several times a day without staying down long enough to trigger a policy. The Availability Flap Summary report shows past availability alerts for the monitors or groups you pick.
It sorts them into Up, Down and Unknown states. A long list of short flaps usually points to a resource limit or an unstable dependency, not a full outage.
ObserveOps runs checks from the Collectors and agents you deploy. It doesn't include a hosted network of global test locations.
For public apps, we place Collectors near the regions where most users are and use their results as the view from outside your network. The table below maps common symptoms to the place in ObserveOps where we'd look first:
Symptom | Where to Look in ObserveOps | Likely Cause |
Login page is slow but returns 200 | url.dns.lookup.time.ms, url.first.byte.time.ms | DNS delay or slow server code |
Page returns 200 with the wrong content | url.content.found, REST API content check | An error page or broken backend behind a healthy server |
Alerts fire for single failed polls | Availability Policy abnormality occurrence | Window or occurrence count set too low |
Monthly SLO breached by planned work | SLO Correction Profile | Maintenance window not exempted |
App keeps going up and down | Availability Flap Summary report | Resource limits or an unstable dependency |
Users see a certificate warning | SSL Certificate service check | An expired or soon-to-expire certificate |
These checks run on the same platform as your server, network and APM data. So you can trace a failed check to the layer behind it without switching tools.
Monitor Application Availability With Motadata ObserveOps
Application availability monitoring answers one question: can people use the app right now? That question is harder to measure than it looks.
Reliable answers come from layered checks, accurate metrics and targets that account for every dependency in the chain.
Retries and checks from several locations keep false alarms down, while content checks catch the outages a ping would miss.
SLAs and SLOs then turn those results into commitments the business can plan around. Corrections keep planned work out of the numbers. Error budgets show when reliability needs attention, before a breach happens.
We built ObserveOps as part of our unified observability and ITSM platform. Service checks, availability policies, SLOs and APM data all sit in one place. Your team can see when an app goes down, which layer caused it and what the outage costs against the SLA.
FAQs
What is a good availability target for a business application?
Most internal business apps aim for 99.5% to 99.9% a month. Customer-facing apps that bring in revenue often target 99.95% or higher. Pick a target your dependencies can support, because each extra nine costs more in redundancy and on-call effort.
How often should availability checks run?
Every one to five minutes suits most apps. Critical public endpoints often run every minute from several locations. Checking more often than that adds little value if your alerting still waits for three failures in a row.
Does planned maintenance count as downtime?
It depends on the SLA, but most contracts exclude announced maintenance windows as long as notice was given in advance. We'd still record that time separately, because users feel planned downtime too, even when it doesn't breach a target.
Can you monitor availability for internal apps behind a firewall?
Yes, but the checks need to run from a collector or agent inside the network. External probes can't reach private addresses. Pair that with an outside check on any public entry point, such as a VPN gateway or a login portal.
Is availability monitoring the same as synthetic monitoring?
Not quite, because synthetic monitoring is only one way to measure availability, using scripted tests. Availability monitoring is the wider practice. It also covers simple uptime checks, real user data, SLO tracking and downtime reports against targets.
Author
Ramya Shah
Technical Writer
Ramya Shah is a technical content writer with a computer engineering background and roots in automotive journalism. He covers IT Service Management, observability, IT operations, and AI-driven automation. An early adopter of AI-assisted writing workflows, he turns complex IT processes into clear, engaging content optimized for search and answer engines (AEO), lifting content output and organic visibility.