Exit Code 143: What SIGTERM Means in Docker and Kubernetes
Exit code 143 means a process was stopped by a SIGTERM signal and shut down in response. The number follows a Linux convention, where a process ended by a signal reports 128 plus that signal's number. SIGTERM is signal 15, and 128 plus 15 gives you 143.
You'll see it most often in Docker and Kubernetes, where it's usually a normal part of stopping a container. Sometimes, though, it's the first sign that something is restarting your workloads when it shouldn't be.
In this blog, you will:
Learn what exit code 143 and SIGTERM mean, and when a 143 is worth worrying about.
Troubleshoot it in Docker and Kubernetes with the right commands, and fix the common causes.
See how 143 compares with 137 and where else it shows up, from CI jobs to Spark.
What Does Exit Code 143 Mean?
Exit code 143 means the container's main process received SIGTERM and exited because of it. In most cases, that's a graceful shutdown and not a crash. Something outside the process asked it to stop, whether that was you, Docker or Kubernetes, and it complied.
The 143 itself comes from how Linux reports processes that end because of a signal. The exit status is 128 plus the signal number, so you can work backward from any code above 128. Here's how that plays out for the signals we run into most:
Signal | Number | Exit Code | Usually Sent By |
SIGINT | 2 | 130 | Pressing Ctrl+C in a terminal |
SIGKILL | 9 | 137 | The OOM killer, docker kill or Kubernetes after the grace period |
SIGSEGV | 11 | 139 | The kernel, after an invalid memory access |
SIGTERM | 15 | 143 | docker stop, Kubernetes, systemd and most other orchestrators |
One detail trips up a lot of people, so it's worth knowing early on. A process exits with 143 when SIGTERM ends it directly.
Some runtimes, like the Java Virtual Machine (JVM), also catch SIGTERM, run their shutdown hooks and then exit with 143 themselves. An application that catches SIGTERM and exits cleanly with code 0 won't show 143 at all.
What Is SIGTERM?
SIGTERM, short for signal terminate, is the standard Linux signal for politely asking a process to shut down. Unlike SIGKILL, it can be caught, handled or even ignored by the process that receives it.
That gives the application a chance to finish in-flight requests, close connections and flush data to disk. Here's how it compares with the two signals it's most often confused with:
SIGTERM (15): It politely asks the process to stop, and the process can catch it and clean up first. That's why orchestrators send it before anything else.
SIGKILL (9): The kernel ends the process immediately, and the process can't catch or ignore it. As a result, nothing gets cleaned up on the way out.
SIGINT (2): This is the interrupt you send with Ctrl+C in a terminal. It behaves much like SIGTERM, but it's meant for interactive use.
That's why almost every system that stops containers follows the same pattern. It sends SIGTERM first, waits for a set period and only sends SIGKILL if the process is still running.
Is Exit Code 143 an Error?
Usually not, because exit code 143 normally means a container was stopped on purpose and shut down cleanly. The real question is who sent the SIGTERM and whether you expected it. We'd sort the common triggers like this:
Trigger | Expected? | What to Check |
A deployment rollout or rollout restart | Yes | Nothing, unless restarts continue after the rollout ends |
Scaling a deployment down | Yes | Whether the scale-down was planned or came from an autoscaler |
docker stop or docker compose down | Yes | Nothing, since this is the normal stop path |
A node drain for maintenance or upgrades | Yes | That the pods were rescheduled onto healthy nodes |
A failed liveness probe | No | Probe settings and how fast the app responds under load |
A Job hitting its activeDeadlineSeconds limit | No | Job run time compared with the deadline |
Pod eviction under node pressure | No | Node memory and disk usage |
The cluster autoscaler removing a node | Sometimes | Whether that node was really underused |
A spot or preemptible instance being reclaimed | Sometimes | Interruption notices from your cloud provider |
If a 143 lines up with a deployment or a planned change, you can usually move on. It's the 143s that show up outside those windows that deserve a closer look.
Common Causes of Exit Code 143
The causes differ slightly between plain Docker and Kubernetes, so we'll take them one at a time.
In Docker
In Docker, exit code 143 almost always means someone or something ran a stop command. The docker stop command sends SIGTERM to the container's main process and then waits 10 seconds by default. If the process is still running after that, Docker sends SIGKILL, and the container exits with 137 instead.
The docker compose down and docker restart commands follow the same path. So do most tools that stop containers on your behalf, such as CI runners and deployment scripts. With lots of containers across several hosts, Docker monitoring shows you which ones stopped and when.
In Kubernetes
Kubernetes sends SIGTERM far more often, because container orchestration means stopping and replacing containers all the time. These are the triggers we run into most:
Rollouts and restarts: Every rolling update replaces old pods, and each old pod gets SIGTERM on its way out.
Scale-downs: A HorizontalPodAutoscaler or a manual scale-down removes pods, and each one receives SIGTERM first.
Node drains: Running kubectl drain before maintenance evicts every pod on the node through the normal shutdown path.
Liveness probe failures: When a liveness probe fails too many times in a row, the kubelet restarts the container with SIGTERM.
Job deadlines: When a Job runs past its activeDeadlineSeconds value, Kubernetes terminates its running pods.
Node-pressure eviction: When a node runs low on memory or disk, the kubelet evicts pods to protect itself. Soft evictions allow a grace period, but hard evictions can kill pods right away with 137.
The liveness probe case is the one that catches teams out most often. A slow startup or a CPU-starved container can fail its probe even though nothing is actually broken. The kubelet then restarts it, the cycle repeats, and the pod can end up in CrashLoopBackOff.
How Kubernetes Shuts Down a Pod
We've found that knowing the exact shutdown order makes most exit code 143 problems much easier to reason about. When a pod is deleted, Kubernetes works through these five steps:
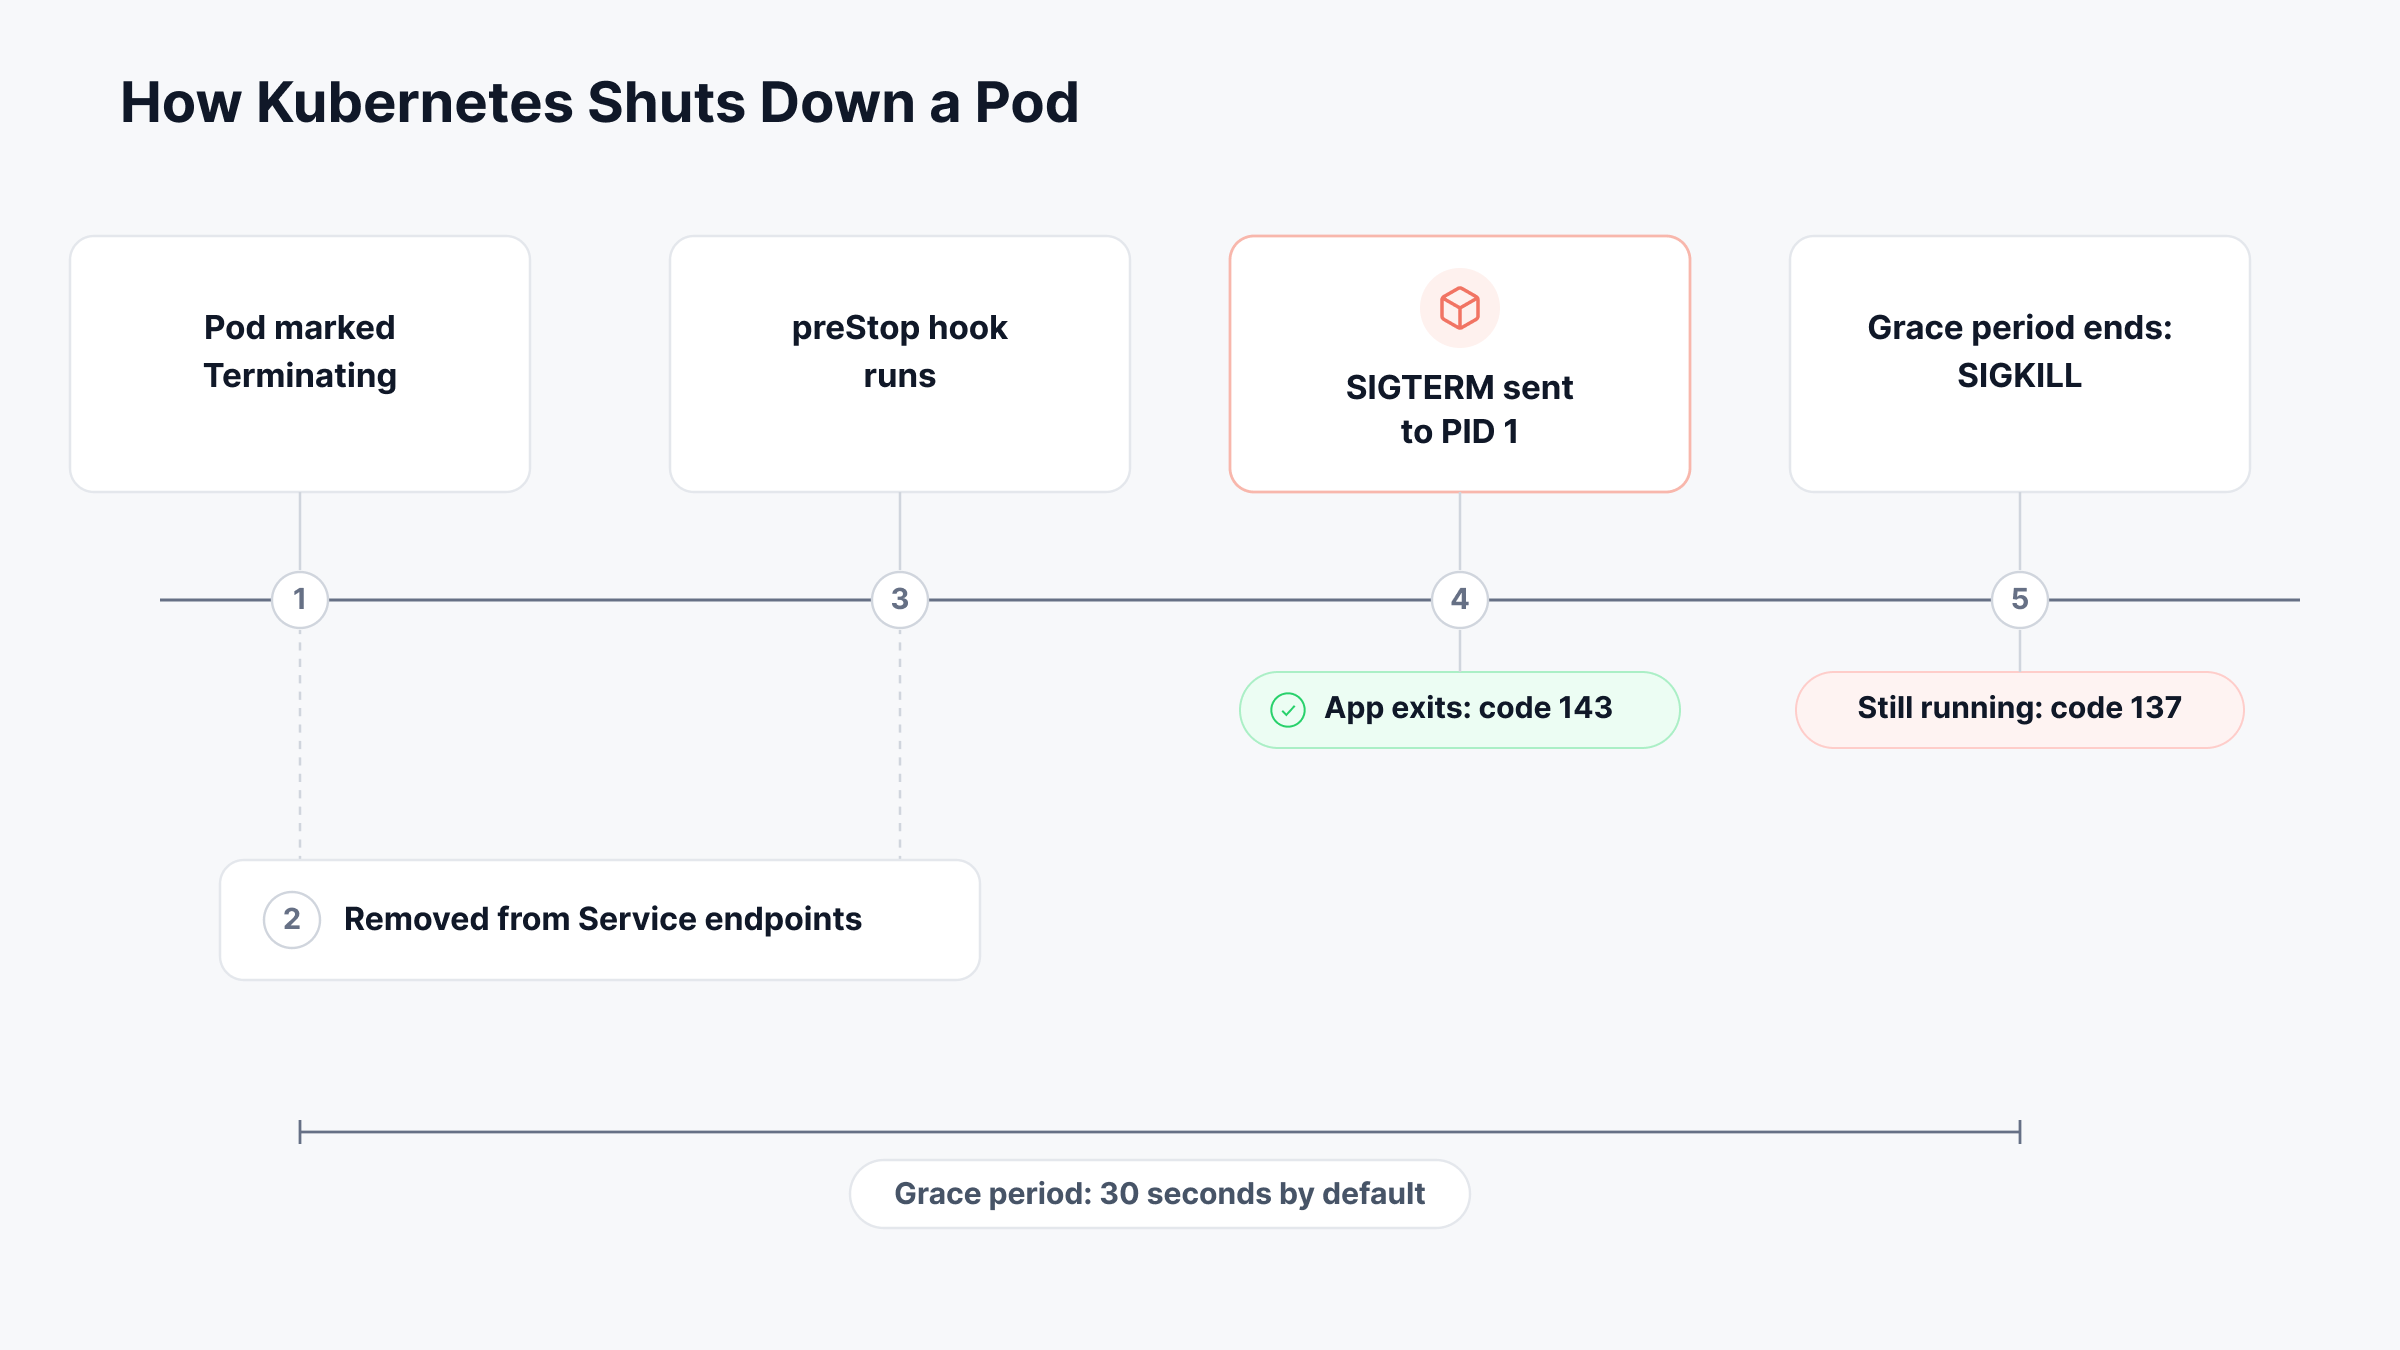
The pod is marked Terminating: The API server records a deletion timestamp, and the grace period starts counting down. The default is 30 seconds, set by terminationGracePeriodSeconds.
The pod is removed from service endpoints: At the same time, the pod is taken out of its Services, so new traffic stops arriving. This happens in parallel with the next steps, so it isn't instant everywhere.
The preStop hook runs: If you've defined a preStop hook, the kubelet runs it before sending any signal. The time it takes counts against the grace period.
SIGTERM goes to each container: Once the hook finishes, the kubelet sends SIGTERM to the main process (PID 1) in every container. This is where a 143 comes from, if the process exits because of the signal.
SIGKILL arrives after the grace period: If any container is still running when the grace period ends, it gets SIGKILL and exits with 137.
Step 2 is the one that tends to cause trouble during deployments. Some load balancers and kube-proxy rules take a few seconds to notice that a pod is gone.
If your app exits the instant SIGTERM arrives, those last requests hit a closed port and fail.
How to Troubleshoot Exit Code 143
The goal of troubleshooting is to find out who sent the SIGTERM and why. These are the commands we reach for first, and they'll get you most of the way there:
Command | What It Shows |
kubectl describe pod pod-name | The Last State block, with the exit code, the reason and when the container finished |
kubectl get events --field-selector involvedObject.name=pod-name | Events such as Killing, Unhealthy or Evicted around the time of the exit |
kubectl logs pod-name --previous | Logs from the container instance that exited, including any shutdown messages |
kubectl get pod pod-name -o yaml | The full status, including restartCount and lastState.terminated |
docker inspect container-name | The State block, with ExitCode, OOMKilled, Error and FinishedAt |
docker events --since 1h | Recent kill, stop and die events, so you can see what stopped the container |
We'd start with the events, because the reason usually sits right there. A Killing event right after a rollout is routine. A string of Unhealthy events before each restart, on the other hand, points to the liveness probe.
It's also worth checking the previous logs for your app's own shutdown messages. If you don't see any at all, the app probably isn't handling SIGTERM.
How to Fix or Prevent Unexpected Exit Code 143
You can't stop Docker or Kubernetes from sending SIGTERM, and you wouldn't want to. The fixes below are the ones we'd try first, because they keep shutdowns clean and cut down surprise SIGTERMs.
Handle SIGTERM in Your Application
Your app should catch SIGTERM, stop taking new work and finish what it's already doing. After that, it should close database connections, flush buffers and exit within the grace period.
Most frameworks support this out of the box. Spring Boot has a graceful shutdown setting, and Node.js and Go both let you add signal handlers.
Make Sure Your Process Actually Receives the Signal
A surprising number of SIGTERM problems come down to how the container's command is written in the Dockerfile.
With the shell form, like CMD java -jar app.jar, Docker runs your app under /bin/sh -c. The shell becomes PID 1, and it doesn't pass SIGTERM on to your app. Your app never hears the signal, so it gets SIGKILL when the grace period ends and exits with 137.
Switching to the exec form, where the command is written as a JSON array, makes your app PID 1 instead. If you need a shell script to start the app, end it with exec so the app replaces the shell.
PID 1 has one more quirk worth knowing about, because Linux treats it differently from other processes. Signals that PID 1 doesn't explicitly handle are ignored instead of ending it.
The JVM installs its own handler, but not every runtime does, so a small init process like tini or dumb-init helps. With docker run, the --init flag adds tini for you.
Tune the Grace Period and Add a preStop Hook
If your app needs more than 30 seconds to drain, raise terminationGracePeriodSeconds to match. We'd set it from how long your slowest requests or jobs actually take, not from a guess.
A short preStop sleep of 5 to 15 seconds also helps during rollouts. It gives endpoint changes time to spread before your app starts shutting down.
Fix Probes and Resource Settings
For restarts caused by liveness probes, give slow-starting apps a startup probe. That keeps the liveness probe from firing until the app is actually up. It's also worth checking that timeoutSeconds and failureThreshold leave room for a busy moment.
Finally, set realistic CPU and memory requests so the scheduler doesn't pack pods onto nodes that will run short. Watching requests against real usage is a big part of Kubernetes monitoring, and it's how you spot pods heading for eviction.
Exit Code 143 vs 137 and Other Container Exit Codes
Exit code 143 is easiest to understand next to the other codes you'll see from containers. These are the ones that come up most often:
Exit Code | Meaning | Common Cause |
0 | Success | The process finished its work and exited normally |
1 | General application error | An unhandled exception, a bad config file or a missing environment variable |
125 | Docker couldn't run the container | An invalid docker run flag or a Docker daemon error |
126 | Command can't be executed | A permissions problem or a file that isn't executable |
127 | Command not found | A typo in the entrypoint or a binary missing from the image |
137 | SIGKILL (128 plus 9) | The OOM killer, docker kill or a missed grace period |
139 | SIGSEGV (128 plus 11) | A segmentation fault from an invalid memory access |
143 | SIGTERM (128 plus 15) | A normal stop from Docker, Kubernetes or another orchestrator |
The pair we watch most closely is a 143 followed by a 137 for the same container. That pattern means SIGTERM arrived, but the app didn't finish shutting down in time.
If kubectl describe shows 137 with the reason OOMKilled, though, memory is the cause, and SIGTERM never came into it.
Where Else You'll See Exit Code 143
Exit code 143 isn't limited to containers, since any Linux process stopped by SIGTERM can report it. Outside Docker and Kubernetes, it comes up most in CI/CD pipelines, data jobs and long-running services:
GitHub Actions: When a workflow is canceled or a step hits its timeout-minutes limit, the runner stops the running processes. The step then reports that the process completed with exit code 143.
Jenkins: Aborting a build, or hitting a timeout step, sends SIGTERM to the running shell step. The console then shows that the script returned exit code 143.
Spark on YARN: YARN kills executor containers that go over their memory limit. The log then says the container was killed on request with exit code 143. The usual fix is more executor memory or memory overhead.
Amazon ECS: Stopping a task sends SIGTERM, then SIGKILL after the stop timeout, which defaults to 30 seconds. Deployments, scale-ins and Spot interruptions all go through this path.
Heroku: Dynos restart at least once a day and on every deploy. Each restart sends SIGTERM, and the logs show the process exited with status 143.
systemd services: Running systemctl stop sends SIGTERM, so Java services often show status 143 in journalctl. Adding SuccessExitStatus=143 to the unit file tells systemd to treat that as a clean stop.
In each case, the fix starts with the same question we asked earlier. Who sent the SIGTERM, and did you expect it?
What Exit Code 143 Looks Like in Your Monitoring Data
An exit code is a single event, and it's easy to miss once the container has restarted. What stays visible is the pattern around it, like restart counts, status changes and memory against limits.
Here's how we'd read those signals with Kubernetes monitoring in ObserveOps. It collects them for every container, pod, node and job in your clusters. That includes self-managed Kubernetes as well as Amazon EKS, Google GKE, Azure AKS, OpenShift and Tanzu.
Restart Counts Show How Often SIGTERM Arrives
kubernetes.container.restarts counts how many times each container has restarted, and kubernetes.pod.restarts rolls that up for the whole pod.
A jump during a rollout is normal, since every replaced pod gets SIGTERM. Restarts that keep climbing between deployments are a different story.
Say a pod shows 3 restarts on Monday morning and 41 by Thursday morning, with no deployment in between. That's 38 restarts in 72 hours, or roughly one every two hours. A steady rate like that almost always points to a failing probe or a resource problem.
On Amazon EKS and Google GKE, aws.eks.kubernetes.crashloopbackoff.pods and gcp.gke.kubernetes.crashloopbackoff.pods count the pods stuck in CrashLoopBackOff. We'd alert on any value above zero, because those pods are restarting faster than they can recover.
Memory Against the Limit Separates 143 From 137
kubernetes.container.memory.percent shows a container's memory use as a percentage of its limit. ObserveOps works it out from kubernetes.container.memory.bytes and kubernetes.container.memory.limit.bytes.
If restarts line up with this metric reaching 100%, you're looking at OOM kills and exit code 137. If restarts happen while memory sits around 60%, memory isn't the cause, and the 143s came from somewhere else.
Node Metrics Point to Evictions and Drains
kubernetes.node.status tells you when a node stops being Ready. Pair it with kubernetes.node.memory.percent and kubernetes.node.memory.available.bytes to see how close each node is to running out.
When node memory climbs and pods from several deployments restart at once, the kubelet is probably evicting them. That's a capacity problem, so the fix is better requests or more nodes, not changes to the app.
Job Status and Duration Catch Deadline Kills
For batch work, kubernetes.job.status and kubernetes.job.duration show how each job ended and how long it ran. If a job keeps failing at almost the same duration, like 3,600 seconds, it's probably hitting its activeDeadlineSeconds limit.
Those pods received SIGTERM, so 143 is exactly the exit code you'd expect there. kubernetes.namespace.failed.pods is useful too, since it shows failed pods piling up in one namespace.
Docker Hosts: Keep Stopped Containers in View
On plain Docker, ObserveOps discovers containers through the Linux monitor of the host that runs them.
During setup, the Discover Available Containers option picks up every container, whatever its current status. That matters for exit code 143, because a container that has already stopped still shows up for you to investigate.
You can also monitor Docker containers without code changes. The host agent can add APM to the Java and .NET apps running inside them.
One thing to keep in mind is that ObserveOps doesn't report the exit code itself as a metric. Instead, it shows the restart, status and resource signals around each exit, and kubectl describe fills in the rest. When restarts start climbing, this table shows where we'd look first:
Symptom | Metric to Check | Likely Cause |
Restarts spike during a deployment, then stop | kubernetes.pod.restarts | A normal rollout, with nothing to fix |
Restarts keep climbing between deployments | kubernetes.container.restarts | A failing liveness probe or an app crash loop |
Restarts line up with memory hitting 100% | kubernetes.container.memory.percent | OOM kills (exit code 137), not SIGTERM |
Many pods restart at once on one node | kubernetes.node.memory.percent, kubernetes.node.status | Node-pressure eviction or a node drain |
Pods stuck restarting on EKS or GKE | aws.eks.kubernetes.crashloopbackoff.pods, gcp.gke.kubernetes.crashloopbackoff.pods | CrashLoopBackOff after repeated failures |
A job fails at the same duration every run | kubernetes.job.duration, kubernetes.job.status | The Job's activeDeadlineSeconds limit |
Failed pods pile up in one namespace | kubernetes.namespace.failed.pods | A bad release or config change in that namespace |
Most unexpected 143s trace back to probes, deadlines or evictions, and each of those leaves a clear trail in these metrics.
Catch Unexpected Container Restarts With Motadata ObserveOps
Exit code 143 means a process received SIGTERM and shut down. Most of the time, that's exactly what should happen during deployments, scale-downs and planned stops.
The 143s worth your attention are the ones you didn't plan for. Those usually come from failing probes, job deadlines or evictions, and they tend to repeat until someone fixes the cause.
Handling SIGTERM in your app and using the exec form in your Dockerfile will fix most shutdown problems.
We built ObserveOps as part of our unified observability and ITSM platform. It tracks container restarts, pod status and memory against limits in one place. That way, your team can spot an unexpected restart pattern before it turns into an outage.
FAQs
Can a container ignore SIGTERM?
Yes, a process can catch SIGTERM and choose to ignore it. Docker and Kubernetes won't wait forever, though, and they send SIGKILL once the grace period runs out. At that point, the container exits with 137 instead of 143.
How do I stop a container without getting exit code 143?
Handle SIGTERM in your application and exit with code 0 once cleanup finishes. The container will then report a clean exit, even though Docker or Kubernetes was the one that stopped it.
Why does my Spring Boot or Java app exit with 143?
The JVM catches SIGTERM, runs its shutdown hooks and then exits with 143 by design. So a Spring Boot app stopped by Docker, Kubernetes or systemd will normally report 143, even when the shutdown was clean.
Does exit code 143 mean data loss?
Not by itself, because SIGTERM gives the app a chance to finish its work. Data loss is possible if the app ignores the signal or runs past the grace period. It can also happen if the app exits without flushing its writes.
Can ObserveOps alert on container restarts?
Yes, ObserveOps collects container and pod restart counts from Kubernetes, along with pod status and memory against limits. You can set alerts on those metrics to catch restart patterns that point to unexpected SIGTERMs.
Author
Ramya Shah
Technical Writer
Ramya Shah is a technical content writer with a computer engineering background and roots in automotive journalism. He covers IT Service Management, observability, IT operations, and AI-driven automation. An early adopter of AI-assisted writing workflows, he turns complex IT processes into clear, engaging content optimized for search and answer engines (AEO), lifting content output and organic visibility.