What Is Serverless Architecture? How It Works and How to Monitor It
With serverless computing architecture, your cloud provider will manage and operate the server(s) required to support your application. They will provision the necessary number of servers, increase as demand increases and reduce when demand subsides, charging you only for the duration your code executes.
As such, developers can create a series of discrete functions that execute on the occurrence of certain events, e.g. incoming HTTP(S) requests or objects added to an S3-like service. Serverless components will likely feature heavily in most cloud-native architecture, and you should expect to see issues manifest in terms of limited function concurrency and increased length of time messages sit in a queue.
In this blog, you will:
Trace the life of a single customer order through a typical serverless pipeline, identifying key considerations and cost implications
Understand when you may want to consider alternative approaches, e.g. containers and microservices
Identify the most commonly degraded signals in a serverless environment, e.g. Lambda function throttles, SQS queue age
What Is Serverless Architecture?
In short, serverless architecture means you push your code to a cloud provider and they take responsibility for the underlying server infrastructure (i.e. initial deployment, ongoing maintenance, scaling and ensuring sufficient capacity).
There will of course still be physical servers in place, but you never log in to these, and as a result will not incur the cost of leaving a server powered on (e.g. across a public holiday period).
Typically, serverless comprises two layers:
Function as a Service (FaaS)
This is the mechanism whereby your functions are triggered by external events and executed in short bursts. We'll explore this further below.
Backend as a Service (BaaS)
Your functions will need to interact with some form of data store, file store, messaging system or identity management. These will also typically be offered as managed services by your cloud provider.
Of course, there will be some variation in the above depending on the complexity of your application, but you can safely assume that you'll be utilizing at least some combination of these.
Increasingly, some serverless container offerings (AWS Fargate, Google Cloud Run etc.) are also classified under the serverless umbrella given the similarities in their auto-scaling and billing characteristics.
An easy heuristic to apply here is to consider the degree of control that you retain. Where you have to explicitly define the instance type(s) and quantity of instances to deploy your application, you are not running serverless.
However, where you specify the amount of RAM to allocate to your function(s) and the system determines the level of replication to meet demand, you are.
How Does Serverless Architecture Work?
A serverless application will typically consist of a sequence of steps, initiated by an event and completed after one or more interactions with the associated BaaS.
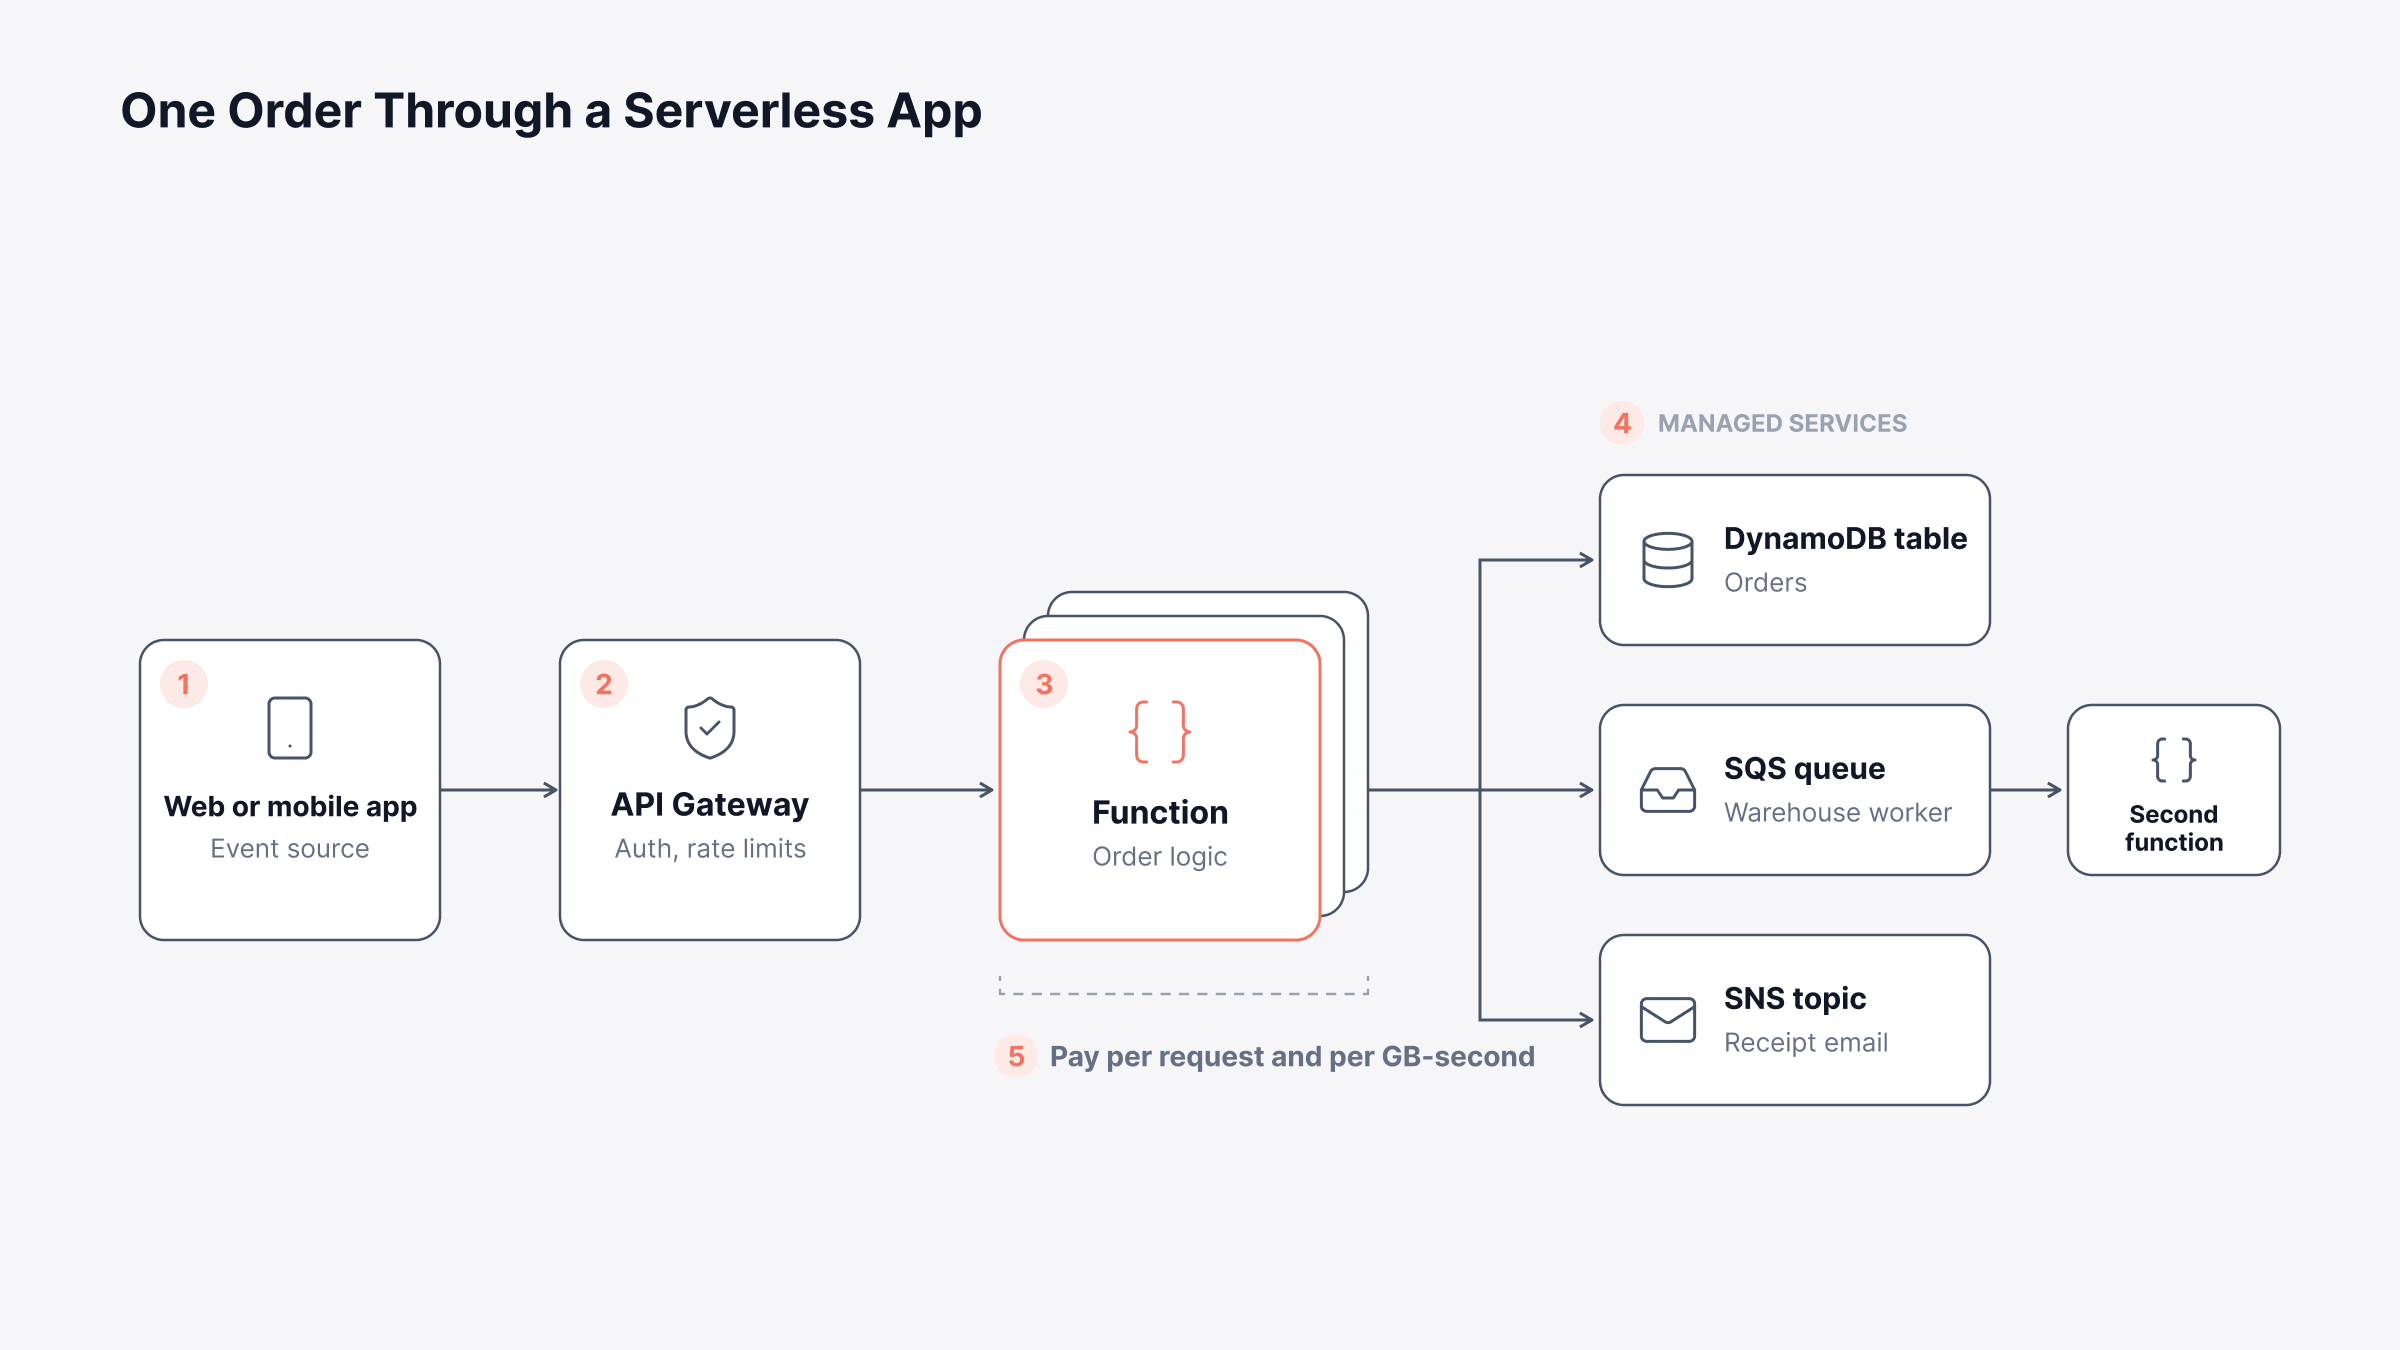
To provide a concrete illustration, we'll walk through an order placed on an e-commerce website across the following 5 steps:
1. Event Sources
There must be some trigger that initiates the execution of your function. This could take the form of an inbound HTTP(S) request, a newly uploaded object to a file store, entry to a message queue, update to a database (via change data capture) or a timer firing at regular intervals.
2. API Gateway
In this scenario, an HTTP(S) request will be received at your API Gateway, which will validate the relevant authentication credential, enforce any rate-limiting rules and dispatch the appropriate function.
Naturally, this will contribute a few milliseconds of latency to your application, although this may not be readily apparent unless investigated.
3. Functions
The function(s) contain the bulk of the logic to complete your task. Importantly, there is no concept of persistent state within your function between executions.
AWS Lambda, introduced in 2014, is the service that popularized the FaaS model. Upon an event triggering a function, the relevant system will instantiate a suitable execution environment to host your function, execute it and hold the environment open for a brief period to accommodate subsequent events.
Consequently, you cannot persist data to the function's filesystem and expect it to remain available for future invocations. Instead, you'll write to one or more of the BaaS options.
4. Managed Services
In the above diagram, your function will persist the order to a DynamoDB table, enqueue an SQS entry to signal the warehouse system to process the order, and fire an SNS message to generate a confirmation email.
All of the BaaS components will similarly comprise one or more hidden server(s) operated by the provider, and each will impose some constraints that your function may hit.
5. Pay-Per-Use Billing
You will be charged based on the number of invocations and the length of time your code runs. With Lambda, this is quantified in GB-seconds, i.e. the configured RAM x duration.
It stands to reason that if your function sees no invocations across a weekend, you will pay $0 for those two days. On the other hand, if it becomes trapped in a continuous loop of retries, your cost could escalate considerably.
Which Serverless Terms Should You Know?
We've identified 7 concepts that will be prevalent in the majority of serverless-related issues we've encountered. Note that nomenclature will vary slightly between each major provider, but the general principle is consistent.
Term | What It Means | Why It Matters |
Invocation | One run of a function, from start to finish | Both billing and error rates are counted per invocation |
Cold start | The wait while the platform builds a fresh environment and loads your code | The first request after a quiet period, or during a sudden rush, takes longer |
Concurrency | How many copies of a function are running at the same time | Each account and region has a limit, and reaching it causes throttling |
Throttle | A request that gets turned away because concurrency is maxed out (HTTP 429 on Lambda) | Callers waiting for a response get an error, while async events wait and retry |
Timeout | The longest a single run can last before the platform stops it | Long jobs have to be split up or moved elsewhere |
Dead-letter queue | Where failed async events go once all retries are used up | Without one, a failed event can disappear without a trace |
Provisioned concurrency | Environments you pay to keep warm in advance | Traffic served by these environments never hits a cold start |
Although cold start receives a disproportionate amount of publicity, in practice we have found that concurrency limits and function-level throttling have usually been the bigger factor driving significant degradation.
What Are Some Serverless Computing Examples?
Generally speaking, you'll find that serverless is applicable to a range of activities that are bursty and can be completed within a matter of seconds. We've broken these down into the following categories:
Image and file processing: When a photo is uploaded to S3, a function generates 3 thumbnail variants and relocates the base image to a cost-effective storage tier. No resize server runs up costs between uploads.
API backends: A typical setup combines API Gateway, one function per endpoint and DynamoDB. This is suitable for mobile applications with higher volumes of activity during the day and little at night.
Queue workers: The platform will replicate functions to keep pace with the volume of items (e.g. orders, invoices) in the queue, reducing the number of functions as the queue depletes.
Scheduled jobs: Timer-based Azure Functions or EventBridge schedules can replace a dedicated cron server running nightly reports, cleanup scripts and certificate checks.
Stream processing: For clickstream analytics or IoT sensor data, a function can consume records from a Kinesis stream or DynamoDB Streams and enrich the payload before forwarding it.
While there are many variations, our experience suggests that adding a function to consume an SQS queue is the most common starting point, as it can typically be layered onto an existing solution. Further, you'll notice that none of the above examples is truly limited to a single function.
Rather, each is likely to involve multiple interconnected elements, so it will be important to understand the full path that data traverses if performance is impacted.
Serverless vs Containers vs Microservices
You will frequently see the terms serverless, containers and microservices used interchangeably. In fact, they represent quite distinct concepts.
Both serverless and containers pertain to the means by which you execute your code, whereas microservices refer to an architectural style for breaking your solution into smaller, decoupled units, which can then be deployed using either of the former.
The comparison between these is shown below:
Area | Serverless (FaaS) | Containers | Microservices |
What it is | A way to run code | A way to package and run code | A way to design an app |
Who runs the servers | Your cloud provider | You, or a managed service such as Amazon EKS | Whoever runs the compute each service sits on |
Scaling | Automatic, per request, all the way down to zero | Follows rules you set, usually in an orchestrator | Each service scales on its own |
Run time | Seconds or minutes, with a hard limit | As long as you need | However long each service needs |
Billing | Per request and per GB-second | Per node or vCPU-hour, whether it's busy or not | Whatever the compute underneath charges |
Control | You choose the runtime and memory, and not much else | The OS image, libraries and networking | Depends on the service |
Best fit | Spiky, event-driven work | Steady traffic and long-running processes | Large apps owned by several teams |
As a result, it's very common to see elements of each combined in an application. For instance, your core checkout workflow may be implemented using containerized processes on Kubernetes, and in turn trigger a set of functions to produce thumbnails and send emails.
You will see analogous distinctions in containerization vs virtualization, with progressively reduced levels of control and therefore administrative burden at each stage.
What Are the Benefits of Serverless Architecture?
The primary motivation for implementing serverless is that you no longer need to dedicate any engineering capacity to maintaining the servers to run your workload. All of the remaining advantages are a direct consequence:
Reduced cost of running the system: You will only be charged for the period your functions are active. Therefore, a function processing 10,000 requests during the day and almost none at night is likely to be materially cheaper than a VM sized for the daytime peak.
Elasticity: The number of functions will automatically increase as the volume of events grows and decrease accordingly, bounded by your account's concurrent execution quota.
Minimal time spent applying patches: As noted previously, the provider will be responsible for updating the base OS and software layers, relieving you of a sizeable proportion of your security-related activities.
Improved speed to release: As individual functions can be updated in isolation, you don't have to coordinate the redeployment of an entire suite of services.
High resilience: AWS Lambda will spread functions across several AZs per Region by default.
Naturally, as with any technology, there are downsides to consider before taking the decision to implement serverless.
What Are the Limitations of Serverless Architecture?
Most of the points below arise as a result of ceding some degree of control to the platform:
Cold starts: Depending on the programming language, dependencies bundled with your function and network setup, the system may require anything from under 100 ms to several seconds to bring up a new execution context. This will be particularly noticeable for e.g. Java or .NET, so we recommend establishing a baseline before investing in mitigating this.
Maximum execution duration: AWS Lambda places an upper bound of 15 minutes on any given invocation. You'll therefore need to consider how to decompose longer-running operations or utilize an alternative.
Statelessness: As explained earlier, you'll need to use a BaaS component to store session information, intermediate results, static assets etc., increasing the number of downstream calls and hence cost.
Vendor lock-in: The ecosystem of available events, IAM policies and message schemas will vary from cloud-to-cloud. As such, porting a Lambda-based solution to e.g. Microsoft Azure Functions would necessitate substantial changes.
Limited ability to investigate faults: An individual action by a customer can propagate through as many as five services, and the offending function may have ceased executing prior to your discovery. On top of that, you won't be able to connect to the server and inspect its contents.
May be more expensive for sustained periods of high utilization: In some circumstances, you may achieve greater efficiency by containerizing your function and running continuously.
Having outlined these caveats, serverless is still likely to be well-suited to a number of scenarios.
When Should You Use Serverless Architecture?
Based on the discussion above, you can infer that you will typically see the greatest benefit from serverless where you have a set of discrete, short-lived operations that vary significantly in frequency.
Conversely, you would likely opt for a containerized or VM-based approach if your processes are prolonged or relatively constant. The table below summarizes some key decision factors:
Situation | Start With | Why |
Traffic swings between busy days and near-zero nights | Serverless | You stop paying for capacity that nobody is using |
A job runs longer than 15 minutes | Containers or VMs | It will run into the function time limit |
Traffic stays steady and high all day | Containers | Per-request pricing adds up quickly at constant load |
Every request has a strict latency target | Containers, or functions with provisioned concurrency | You can't afford a cold start on the busiest path |
A legacy app depends on one OS or a local disk | VMs | It needs control that the platform won't give you |
You're connecting existing services into a new workflow | Serverless | Small functions can link APIs together quickly |
As a final note, only a small minority of organizations will utilize a pure form of any of these architectures. Typically, you'll see a mixture of serverless functions deployed in the public cloud calling databases and applications that still run on premises, placing you in the space of a hybrid cloud architecture. Monitoring this type of environment is where things start to get harder.
How Do You Monitor Serverless Architecture?
As with any distributed system, there are many components to a serverless application and it's important to consider all of them. Your functions may appear to be working perfectly, but there could be a growing queue or your API Gateway may be adding 2s per transaction.
There are 4 broad categories that will identify many common issues:
Your functions: Measure the number of invocations, errors, throttles and concurrent executions.
Points of entry to your app, e.g. the API Gateway: Count transactions, response times and 4xx and 5xx rates.
The services your functions interact with: Watch queue length, max message age, DB throttles and object store errors.
Cost: Track the number of invocations and consumed compute. This is typically the first indicator that your application has gone into a retry cycle.
Of course, the major cloud providers will expose some or all of these in their native product. For AWS, the relevant information from Lambda and API Gateway is available via AWS CloudWatch; similarly for Microsoft via Azure Monitor. However, these only give you visibility within their respective clouds.
So if your function times out due to the performance of a database hosted in your data center, AWS CloudWatch will only indicate that the function has a problem.
Organizations operating mixed environments will want to consolidate these cloud metrics into the same cloud monitoring view as their existing infrastructure (i.e. servers, network, DB etc.).
Distributed tracing can also be highly effective at identifying root causes of degraded performance, particularly as your app evolves to include further serverless functions and containers. Many techniques used for microservices monitoring can be extended to a serverless context.
What Your Serverless Metrics Are Telling You
Once your AWS or Microsoft Azure subscription(s) are connected, ObserveOps will begin gathering the following metrics via direct queries to the cloud provider, as part of our AWS monitoring and Azure coverage.
On AWS, you will first create a Credential profile with an IAM access key and secret key, and define a Discovery Profile against which we will monitor the full range of cloud assets, or alternatively filter by tag.
Below we describe the key metrics that we monitor and what might indicate a potential issue.
Lambda Throttles and the Concurrency Ceiling
Suppose it's Black Friday and you observe that the aws.lambda.throttles metric increases from 0 to 340 in the space of 5 minutes. Assuming you haven't made any changes, the likely cause is that aws.lambda.concurrent.executions has reached your account's regional limit (typically 1,000, although newer accounts can start lower), as a consequence of another Lambda consuming a high proportion.
We would then look at the aws.lambda.unreserved.concurrent.executions metric. Should this be nearing the maximum, then it is probable that a particular Lambda is preventing other functions from executing.
In this case you should define a reserved concurrency level on any Lambda that cannot afford to fail.
Note that callers requiring a synchronous result from your application will receive 429 responses, whereas background events will simply be re-queued. Hence the 5-minute period of throttling described above can quickly escalate to an hour-long backlog.
Provisioned Concurrency Spillover
A common reason for implementing Provisioned Concurrency is to prevent your application experiencing a cold start, and the aws.lambda.provisioned.concurrency.utilization.percent metric can indicate if the number of allocated environments is sufficient.
Assume your e-commerce checkout flow has been configured with 50 concurrently-running environments and sits at 98% utilization during the midday rush. If aws.lambda.provisioned.concurrency.spillover.invocations begins to increase, this indicates that some customer transactions are landing on regular environments and experiencing the cold start the allocation was meant to avoid.
If the pattern repeats at the same time daily, you may wish to increase your allocation, or target it to ramp-up prior to the expected period of increased demand.
Conversely, if the aws.lambda.provisioned.concurrency.utilization.percent remains below 30% on an ongoing basis, you may be over-provisioning.
Iterator Age and Dead-Letter Errors
The metrics described here are difficult to flag as problematic unless you know what to look for. Where your Lambda is processing records from a Kinesis or DynamoDB Stream, the aws.lambda.iterator.age.ms metric can be used to determine the age of the last record in each batch when the function processed it.
Should you observe this increasing from 200 ms to 40 minutes, then your Lambda is unable to keep pace with the rate at which new records are streamed. Note that once records exceed the duration for which the Stream retains data, they cannot be recovered.
Similarly, the aws.lambda.dead.letter.errors metric can be overlooked, and is usually more serious; it indicates the number of times that a background event has failed to execute and subsequently failed to be persisted to the DLQ.
This commonly happens due to insufficient privileges to access the DLQ or it having been removed. Any non-zero reading should trigger an immediate alert.
API Gateway: Where the Latency Lives
The API Gateway exposes 2 latency metrics that allow you to isolate the source of delays. The aws.rest.api.gateway.latency.ms measures the overall time taken to service the transaction, and the aws.rest.api.gateway.integration.latency.ms relates solely to the invocation of your Lambda.
In the first instance, if the former returns 900ms and the latter 850ms, you can infer that the Lambda is responsible for the majority of the time. Alternatively, if the former is 900ms and the latter 150ms, then you will need to investigate the API Gateway configuration, potentially including the use of a custom Authorizer or mapping template. Both HTTP and WebSocket style API Gateways provide these metrics.
You would expect the rate of aws.rest.api.gateway.4xx.errors and 5xx errors to correspond to external (e.g. expired tokens, malformed payloads) and internal factors respectively. Finally, if you have enabled Caching for your REST API, the aws.rest.api.gateway.cache.hit metric should be tracked. Should this decline and the corresponding misses increase, a recent release has likely changed what the cache keys on.
SQS and DynamoDB: The Services Behind the Function
Your queue-based Lambda may continue to operate satisfactorily despite an underlying issue with the associated Queue. Our primary concern here would be the value returned by the aws.sqs.oldest.message.age.seconds metric.
If this increases significantly (e.g. from a few seconds to 20 minutes) while the aws.sqs.visible.messages continues to rise, then the downstream systems are struggling to consume messages from the queue.
An analogous situation arises if the aws.sqs.hidden.messages metric increases and deleted messages remain static, i.e. the function keeps picking up messages, failing and returning them to the queue. This will typically occur where the visibility timeout defined on the queue is less than the Lambda timeout. AWS recommends that the former should be at least 6x the value of the latter.
When using DynamoDB, you will want to assess whether the DB is a limiting factor. The aws.dynamodb.write.throttled.requests and aws.dynamodb.read.throttled.requests metrics will inform you of the volume of requests exceeding the configured Throughput, and the aws.dynamodb.provisioned.table.write.used.percent provides the highest value across your provisioned tables.
Clearly, if there is a corresponding increase in Lambda errors, the DynamoDB table will require additional Throughput and increasing the Lambda's allowed concurrency will exacerbate the issue.
Azure Functions: Queued Requests and Memory
Microsoft's suite of metrics is broadly comparable to those exposed by a standard web application. The azure.function.execution.units metric reflects the amount of Consumption plan compute (in MB-milliseconds) consumed and will correlate to your billing.
The azure.function.5xx.requests metric reflects errors that directly impact your end-customers, and finally the azure.function.request.queued.requests metric allows you to monitor the volume of transactions awaiting a worker. A sustained value above zero in the latter metric will indicate a shortfall in available workers.
For .NET based functions, you can also observe the frequency of Garbage Collection activities, i.e. the azure.function.gen.2.collections metric. An increase in this in tandem with the azure.function.memory.used.bytes suggests that the function is being constrained by available RAM, resulting in slower execution.
Accordingly, we keep these metrics in the same view as the rest of our Azure monitoring, including the relevant Service Bus Queues, Cosmos DB databases and Virtual Machines a function is likely to call.
Key metrics to consider when you are on call:
Symptom | Metric to Check | Likely Cause |
Users are getting 429 errors | aws.lambda.throttles, aws.lambda.unreserved.concurrent.executions | Another function used up the regional concurrency |
Latency spikes at the same time every day | aws.lambda.provisioned.concurrency.spillover.invocations | Too little provisioned concurrency for the peak |
Stream data shows up late | aws.lambda.iterator.age.ms | Batches take longer to process than new records take to arrive |
Events disappear without any errors | aws.lambda.dead.letter.errors | The dead-letter queue is missing, deleted or not writable |
The API is slow but the function isn't | aws.rest.api.gateway.latency.ms minus integration latency | Authorizer or mapping template overhead |
The queue keeps growing | aws.sqs.oldest.message.age.seconds, aws.sqs.hidden.messages | Slow consumers, or a visibility timeout that's too short |
Function errors line up with database errors | aws.dynamodb.write.throttled.requests | The table is short on write capacity |
An Azure function app slows down under normal load | azure.function.request.queued.requests, azure.function.gen.2.collections | Too few workers, or memory pressure |
Most rows in the table above relate to 2 separate services, so it is unlikely that a single metric alone will pinpoint a serverless-related fault.
Monitor Serverless Functions and the Services Behind Them With Motadata ObserveOps
While the introduction of serverless computing architecture relieves your IT team of some of the onerous tasks associated with maintaining traditional compute, faults will continue to arise. They will manifest as a result of concurrency restrictions, queues, API Gateways and DynamoDB provisioned Throughput, each reporting via their own interface.
Naturally, for a low-volume workload, this will suffice. But as your transaction flows through a sequence of API Gateway -> 3x Lambda -> Queue -> DynamoDB, and potentially other on-premises services, you will benefit from being able to view these in one pane.
ObserveOps was developed to meet this requirement, and is incorporated within our unified observability and ITSM platform to allow you to monitor your AWS Lambda, Azure Functions, API Gateway, SQS and DynamoDB alongside your servers, networks and apps.
FAQs
Is serverless architecture secure?
Fundamentally, the cloud vendor will manage the security of the underlying hardware, platforms and software, leaving it to you to ensure appropriate controls around the execution of your function code, its associated IAM Roles, key material and exposed endpoints. We commonly observe excessive levels of privilege granted.
Can serverless run on premises?
Open-source serverless frameworks (e.g. Knative, OpenFaaS) can be deployed to your private Kubernetes environment. While this enables you to reap some of the benefits (e.g. auto-scale, event-based), your organization will remain responsible for the management of the Kubernetes cluster, losing most of the benefit of not managing servers.
What programming languages do serverless functions support?
Node.js, Python, Java and .NET are supported by the vast majority of serverless offerings. AWS Lambda also permits Ruby, and Custom Runtimes for e.g. Go and Rust, and Microsoft allows the use of PowerShell in Azure Functions. Some legacy runtimes will reach end of life in due course.
Do serverless apps still need an operations team?
An Ops team will certainly be needed, albeit with a slightly altered remit. As no server maintenance will be required, staff will instead focus on managing concurrency, roles and policies, CI/CD, budget and notifications; the focus moves from keeping machines running to keeping the event chain healthy.
Can ObserveOps monitor AWS Lambda and Azure Functions?
Yes, via the creation of a cloud credential profile, ObserveOps will identify your Lambda and Azure Functions and begin collating invocations, errors, throttles, concurrency, execution units and 5xx requests. The API Gateway, SQS and DynamoDB will also be discovered and monitored.