Best IBM Instana Alternatives: 10 Observability Platforms Compared
Most teams shopping for IBM Instana alternatives rate its tracing highly. Few APM tools discover services as fast.
What sends them looking is the direction around it. In May 2026, IBM made Instana the engine inside a larger platform called Concert Observe, and the bill still counts servers while logs and synthetics meter separately.
In this blog, you will see:
Ten alternatives compared: On pricing, deployment, and coverage.
Full reviews: Key features, pricing, and the cons worth knowing.
The five types of Instana alternative: Replace only the part you need.
By the end, you will know which two or three deserve a trial.
Why Do Teams Look for an IBM Instana Alternative?
Teams leave IBM Instana for three main reasons. IBM is folding it into the Concert platform, the per-server meter sits beside separate log and synthetic charges, and its scope stops at the application and its hosts.
1. IBM Is Folding Instana Into Concert
According to IBM's Think 2026 announcements, IBM Concert now works as an agentic operations platform that "builds on the strengths of Concert, Instana, Turbonomic, SevOne and Cloud Pak for AIOps." Concert Observe, launched the same week, covers application, infrastructure, and network observability in one view.
IBM's own documentation describes the relationship plainly. Instana powers Concert Observe, the full-stack observability capability of the Concert platform.
Instana has not been discontinued. IBM still sells it on its own pricing page. The practical question concerns where the roadmap goes next. We have watched renewal talks shift from the product you run to the platform IBM would like you to adopt.
2. The Server Meter Sits Beside Separate Add-Ons
Instana licenses per Managed Virtual Server, or MVS, which roughly means one host, virtual machine, or worker node. SaaS starts at $21.20 per MVS per month, and each MVS carries either the Essentials tier for infrastructure or the Standard tier for full-stack monitoring.
The add-ons meter on their own terms. Logs in context cost from $0.351 per GB on SaaS, with 30, 60, or 90 days of retention. Synthetic tests from IBM-managed locations bill per execution.
The other two plans change the math. PayPerUse bills $0.03 per MVS hour, which comes to about 3 percent more than SaaS once servers run all month, and it takes no add-ons, so logs in context are off the table.
Self-hosting starts at $385.20 per MVS per year with logs included. At 50 servers that is $6,540 a year more than SaaS at list, before any hardware. We ran the numbers, and it only catches up once each server sends more than about 31 GB of logs a month.
3. The Scope Stops at the Application and Its Hosts
Instana's pricing tiers cover service discovery, distributed tracing, containers, Kubernetes, cloud resources, and web and mobile monitoring. Switches, routers, flow data, and device configurations appear nowhere in them.
IBM sells network monitoring as a separate product, SevOne Network Performance Management, and the Think 2026 announcement names SevOne among Concert's building blocks. So a team with a real network monitoring requirement ends up buying two IBM products or running a separate tool.
None of this makes Instana a weak product. It supports more than 300 technologies, reports metrics at one-second granularity, and IBM Instana for Government appears on the FedRAMP Marketplace. If this line item was due a review anyway, that review pays off more now than at renewal.
What Are the Five Types of IBM Instana Alternative?
IBM Instana alternatives fall into five groups, and picking your group first shortens the list fastest.
Here is how the ten tools sort:
Type | What you are replacing | Tools |
Enterprise full-stack suites | The same shape as Instana: one agent, automatic discovery, broad coverage | Dynatrace, Datadog, New Relic |
Cisco and Splunk estate | APM beside the Splunk logs and security data you already run | Splunk AppDynamics, Splunk Observability Cloud |
Open standards and open source | A proprietary stack, swapped for OpenTelemetry and open query languages | Grafana Cloud, SigNoz, Elastic Observability |
Trace-first debugging | Dashboards, swapped for high-cardinality questions about individual requests | Honeycomb |
Unified observability | Application data beside network, flow, log, and configuration data | Motadata ObserveOps |
The first two groups make the shortest move. The third costs less in licenses and more in engineering hours. The fourth suits teams whose incidents live inside the code.
The fifth pays off when you are cutting tools, which is the trade a unified observability platform asks you to make.
How Did We Evaluate These 10 Tools?
We scored every tool below on the same five factors.
How the bill scales: Whether cost tracks hosts, memory, gigabytes, events, users, or CPU cores.
Instrumentation coverage: Which languages, runtimes, and platforms get traced without custom work.
OpenTelemetry fit: Whether standard collectors and SDKs keep working after the move.
Deployment: SaaS, self-hosted, or both, since Instana offers both.
Scope beyond the application: Logs, networks, and configurations, not only services.
Two honesty notes. We ran no lab benchmark, so nothing here reports a measured trace overhead. All pricing comes from public vendor pages checked in September 2026, and vendors change it without notice.
The 10 Best IBM Instana Alternatives Compared
The table below puts all ten side by side. Instana sits in the last row as your baseline.
Tool | Best For | Deployment | Pricing Model | Free Option |
Motadata ObserveOps | APM, logs, and network on one license | On-premises, private or public cloud, SaaS | Per monitored device, quoted | Free trial |
Dynatrace | Automated discovery and AI root cause | SaaS, or Dynatrace Managed | Annual commit against a rate card | 15-day trial |
Datadog | The widest integration catalog | SaaS only | Per host, plus per GB and per event for logs | 14-day trial |
New Relic | A large free tier and one data rate | SaaS only | Per GB plus per full platform user | Free, 100 GB a month |
Splunk AppDynamics | Business transactions and SAP estates | SaaS or on-premises | Per vCPU, by edition | Free trial |
Grafana Cloud | Open query standards and dashboards | SaaS, or self-host the open-source stack | Per series, per GB, per user | Free, 50 GB logs |
Splunk Observability Cloud | Metrics and traces beside Splunk logs | SaaS, with Splunk Enterprise for logs | Per host, logs metered separately | Free trial |
Elastic Observability | Search-heavy logs with APM beside them | Self-managed, hosted, or serverless | Per node, per resource, or per GB | Free, self-managed |
Honeycomb | Debugging distributed systems by request | SaaS only | Per event volume | Free, 20M events a month |
SigNoz | One open-source app for three signals | Self-host, SaaS, or BYOC | Per GB and per million samples | Free, self-hosted |
IBM Instana (baseline) | Fast discovery and full-fidelity tracing | SaaS or self-hosted | Per MVS, logs and synthetics extra | 14-day trial |
The reviews below cover each one in roster order.
Detailed Overview of the 10 Best IBM Instana Alternatives
Here is a closer look at each one, Motadata ObserveOps first.
1. Motadata ObserveOps
Best for: IT teams that need the application and the network under it explained on one platform.
Type: Commercial, unified observability platform.
Rating: G2 4.7/5, Gartner Peer Insights 4.6/5
ObserveOps covers the ground Instana covers, then keeps going below the host. A slow checkout trace sits on the same topology as the database server, the switch port, and the flow data that fed it.
That matters most in hybrid estates. Instrumentation already written for OpenTelemetry comes across unchanged, so the move is mostly a matter of pointing collectors somewhere new.
Licensing works differently too, because logs never turn into a separate per-gigabyte bill beside the server count.
Pros
- Application, server, log, and network data correlate on one topology instead of across two vendors.
- Logs, flows, and configs sit inside one self-hosted deployment when data has to stay on-premises.
- AI/ML policies detect anomalies and forecast without a training period.
- An alert can raise and route a ServiceOps ticket on its own.
Cons
- APM covers six languages plus Kubernetes, fewer than Instana's 300-plus supported technologies.
- RUM covers four JavaScript frameworks, and native mobile monitoring needs other tooling.
- The licensing model is published, but the prices are not.
- LLM and AI agent observability, which Concert Observe markets, sits outside what ObserveOps covers.
Pricing: Subscription quoted to your environment. ObserveOps Infinity meters the platform per monitored device, with APM per instrumented app, RUM per front-end app, and log monitoring per log source, on one-year, three-year, or perpetual terms.
A feature list only tells you what a platform can do. Here is a review from a team that uses ObserveOps for their operations.
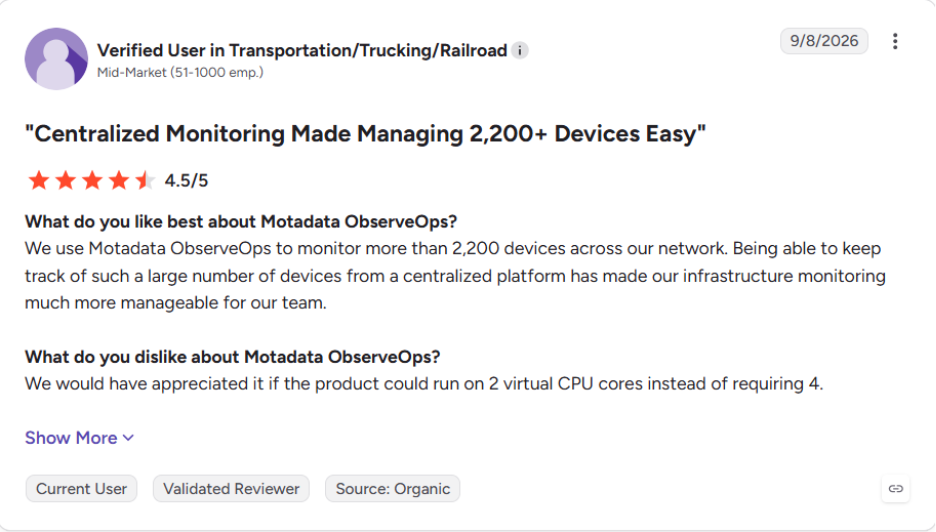
You can read the rest of the ObserveOps reviews on G2.
2. Dynatrace
Best for: Large enterprises that liked Instana's automation and want more of it.
Type: Commercial SaaS, with a self-managed option.
Rating: G2 4.5/5, Gartner Peer Insights 4.6/5
Dynatrace makes the most direct swap. OneAgent discovers hosts, processes, and services on its own, much as the Instana agent does, and Davis AI runs causal root-cause analysis across the map it draws.
The difference shows in data and cost. Everything lands in the Grail data lake and gets queried in DQL, so you trade one proprietary language for another. Dynatrace pricing runs on an annual platform commitment, and someone has to watch the drawdown.
Pros
- Discovery and dependency mapping need almost no manual setup.
- Unlimited seats, with no per-user fees at any tier.
- Usage above the commit bills at the same rate, with no penalty overage.
Cons
- Premium pricing, and the minimum commit rules out small teams.
- DQL adds another language you cannot take with you.
- Network device monitoring stays thin next to its application depth.
Pricing: Annual platform commitment. Full-Stack Monitoring from $58 per 8 GiB host per month, Infrastructure Monitoring from $29, and Foundation from $7, with a 15-day free trial.
3. Datadog
Best for: Cloud-native teams that want the widest catalog and can fund it.
Type: Commercial SaaS.
Rating: G2 4.4/5, Gartner Peer Insights 4.6/5
Datadog covers everything Instana covers, plus security, cloud cost, and a long tail of products beyond it. An estate on AWS, Azure, or GCP shows up on a dashboard within the hour.
The bill runs on more axes than Instana's. Infrastructure and APM each charge per host, logs carry separate ingest and indexing meters, and every added product brings its own line. The full Datadog pricing picture takes a spreadsheet to model.
Pros
- The broadest coverage on this list, so a second tool rarely follows.
- Traces, logs, and host metrics correlate with almost no setup.
- Dashboards and alerting lead the category on polish.
Cons
- The bill grows on several axes at once.
- On-demand pricing runs about 20 percent above the annual rate.
- SaaS only, so self-hosting teams leaving Instana lose that option.
Pricing: Infrastructure from $15 per host per month billed annually, APM from $31 per host, and logs from $0.10 per GB ingested plus $1.70 per million indexed events. A 14-day free trial applies.
4. New Relic
Best for: Development teams that want one data rate and a generous free tier.
Type: Commercial SaaS.
Rating: G2 4.4/5, Gartner Peer Insights 4.6/5
New Relic prices on data and people instead of servers. Hosts, agents, and containers come included without limit, which suits a Kubernetes estate where node counts swing through the day.
Seats become the variable to watch. New Relic pricing climbs with every engineer who needs full platform access, and in our experience that line gets negotiated harder than the data rate.
Pros
- The free tier runs a small production estate with no bill at all.
- One ingest rate for every data type.
- No charge for data egress or rehydration.
Cons
- Per-user pricing grows with headcount.
- Default retention runs 8 days on most data types.
- SaaS only, with no self-hosted path.
Pricing: Free for 100 GB a month and one full platform user. Data then costs $0.40 per GB, or $0.60 with Data Plus. Core users start at $49 and full platform users at $10 per month on Standard.
5. Splunk AppDynamics
Best for: Enterprises that measure applications by business transaction, especially on SAP.
Type: Commercial, SaaS or on-premises.
Rating: G2 4.3/5, Gartner Peer Insights 4.4/5
AppDynamics shares Instana's enterprise lineage but organizes everything around the business transaction. A checkout, a claim, or a trade becomes the unit you watch, with code, database, and infrastructure hanging off it.
That suits traditional application estates better than cloud-native ones. It also keeps an on-premises controller, so teams leaving self-hosted Instana do not have to give up data control.
Pros
- Business metrics and performance share one view, which executives actually read.
- SAP monitoring runs deeper than anything else on this list.
- On-premises deployment remains available.
Cons
- Per-vCPU pricing climbs quickly on large virtual estates.
- Less natural for cloud-native, OpenTelemetry-first teams.
- Its place beside Splunk Observability Cloud keeps shifting inside Cisco.
Pricing: Infrastructure Edition from $6 per vCPU per month, Premium from $33, and Enterprise from $50, billed annually. SAP monitoring starts at $95 per CPU core.
6. Grafana Cloud
Best for: Teams standardized on Prometheus and OpenTelemetry that want portable queries.
Type: Commercial SaaS on an open-source stack.
Rating: G2 4.5/5, Gartner Peer Insights 4.5/5
Grafana Cloud runs the LGTM stack for you. Every query and dashboard also works on the open-source version you could host yourself, so the exit door stays open.
The trade shows up in correlation. Instana joins a trace to its host automatically, while here your team builds much of that join with labels and dashboards. The Grafana Cloud pricing model also bills metrics per series, so high-cardinality labels multiply fast.
Pros
- Minimal lock-in, since the same stack runs self-hosted.
- The free tier serves a small estate indefinitely.
- Most engineers already know Grafana.
Cons
- Three datastores and three query languages leave correlation to you.
- Per-series billing punishes high-cardinality labels.
- Support runs community-only on Free and 8x5 email on Pro.
Pricing: Free tier with 10,000 metric series and 50 GB each of logs and traces. Pro costs $19 a month plus $8 per 1,000 series, $0.50 per GB of logs and traces, and $8 per active user. Enterprise starts at $25,000 a year.
7. Splunk Observability Cloud
Best for: Teams already on Splunk that want metrics, traces, and RUM from the same vendor.
Type: Commercial SaaS, part of Cisco.
Rating: G2 4.3/5, Gartner Peer Insights 4.4/5
Splunk Observability Cloud covers the cloud-native half of Splunk's APM story, where AppDynamics covers the traditional half. Logs stay in Splunk Cloud Platform or Splunk Enterprise, and Log Observer Connect bridges the two.
It keeps every span, which matches the full-fidelity tracing Instana users expect. The cost is two products and two bills, since the observability side prices per host and logs meter separately on the Splunk platform.
Pros
- The strongest fit for a security team that already lives in Splunk.
- Full-fidelity tracing without sampling decisions.
- RUM and synthetics price per session and per request, so they scale down for small sites.
Cons
- Two products and two bills for one observability job.
- SPL adds another proprietary language.
- Cisco's packaging keeps changing.
Pricing: Infrastructure Monitoring from $15 per host per month, APM from $55, and End-to-End from $75, billed annually. Logs price separately on the Splunk platform.
8. Elastic Observability
Best for: Log-heavy teams that want full-text search and APM on the same data.
Type: Open core, with hosted and serverless options.
Rating: G2 4.5/5, Gartner Peer Insights 4.5/5
Elastic comes at observability from search. Logs arrive first and best, and APM traces land in the same indices, so a trace ID query finds the log lines beside it.
Like Instana, it runs self-managed or hosted, which keeps data-control options open. Self-managed clusters put shards, JVM heap, and cluster health on your team, while serverless bills on what you ingest and retain.
Pros
- Runs fully on-premises with commercial support available.
- Search speed that log-heavy teams rarely find elsewhere.
- Security and operations share one data store.
Cons
- Automatic discovery sits well behind Instana's.
- Serverless meters retention beside ingest.
- The licensing history leaves some teams cautious.
Pricing: Free self-managed on the Basic license. Serverless Logs Essentials from $0.07 per GB ingested, and Complete from $0.09 per GB for logs and traces and $0.023 per GB for metrics, plus retention.
9. Honeycomb
Best for: Engineering teams debugging unpredictable behavior across microservices.
Type: Commercial SaaS.
Rating: G2 4.6/5. No significant Gartner Peer Insights listing.
Honeycomb asks a different question than Instana. Instead of watching services on a map, it lets you slice individual requests by any field, however many distinct values it holds, until the odd ones stand out.
That makes it a debugging tool more than a monitoring suite. Teams usually keep something else for infrastructure, and the event-based Honeycomb pricing rewards careful sampling.
Pros
- Finds the unusual request faster than dashboard-led tools.
- The free plan suits real testing.
- OpenTelemetry-native, so instrumentation stays portable.
Cons
- Infrastructure monitoring stays thin, so a second tool usually follows.
- Event-based billing rises quickly with heavy tracing.
- SaaS only.
Pricing: Free up to 20 million events a month. Pro starts at $150 a month and scales up to 750 million events, with Enterprise quoted.
10. SigNoz
Best for: OpenTelemetry-first teams that want an open-source app they can host.
Type: Open source, MIT community edition, with a managed cloud.
Rating: G2 4.6/5. No significant Gartner Peer Insights listing.
SigNoz keeps logs, metrics, and traces in one interface on a ClickHouse backend. For a team leaving self-hosted Instana, it keeps data on your own infrastructure without a per-server license.
The cost moves to operations. The automatic discovery Instana users are used to becomes instrumentation and labels your team configures and maintains.
Pros
- The MIT license means self-hosting scales at no license cost.
- Published per-GB rates with no tiers.
- Unlimited users and hosts on every cloud plan.
Cons
- Self-hosting means running ClickHouse, a skill of its own.
- A younger ecosystem, so enterprise controls keep filling in.
- Cloud retention defaults to 15 days for logs and traces.
Pricing: Free self-hosted. SigNoz Cloud from $49 a month including $49 of usage, then $0.30 per GB for logs and traces and $0.10 per million metric samples. Enterprise from $4,000 a month.
Are the Open Source IBM Instana Alternatives Good Enough?
Open source IBM Instana alternatives work for teams with engineers who can run a datastore. Grafana's LGTM stack, SigNoz's community edition, and self-managed Elastic cover logs, metrics, and traces with no license fee.
Automatic discovery makes up the first gap. Instana finds services and draws dependencies without configuration, while open-source stacks rely on the instrumentation and labels your team maintains.
Operations make up the second. A self-hosted stack sits on infrastructure you patch, scale, and back up, and when it fails mid-incident nobody else picks up.
We see teams underestimate that work more than any other part of the move. The license saving is real, but it arrives with an on-call rotation attached.
How Do You Choose the Right IBM Instana Alternative?
The table below pairs each reason for leaving Instana with the tool that answers it.
Your Situation | Start With | Why |
Your estate includes networks, not just applications | Motadata ObserveOps | APM, flows, logs, and configs share one license |
You want Instana's automation, only more of it | Dynatrace | OneAgent discovery and Davis AI root cause |
You want everything in one SaaS and can fund it | Datadog | More than 1,000 integrations and the broadest catalog |
Kubernetes node counts swing through the day | New Relic | Hosts are unlimited, so you pay for data and seats |
You monitor business transactions or SAP | Splunk AppDynamics | Transactions become the unit, with SAP depth |
You want queries that run anywhere | Grafana Cloud | PromQL, LogQL, and TraceQL run on the open stack too |
Splunk already holds your logs | Splunk Observability Cloud | Full-fidelity traces beside the logs you pay for |
Search is the job and APM comes second | Elastic Observability | Traces and logs share the same indices |
Incidents hide in individual requests | Honeycomb | High-cardinality slicing finds the odd request |
You want open source and will host it | SigNoz | MIT licensed, one app for all three signals |
One question settles most of these shortlists. If your last three incidents ended inside the code, any strong APM will do.
If they ended at a database server or a saturated link, pick a platform that sees below the host.
When Is IBM Instana Still the Right Choice?
Instana still fits a specific case. It suits a cloud-native estate on Kubernetes where the team wants services discovered and traced with almost no configuration.
Very little here matches its time to value. It also suits organizations already committed to IBM, since Concert Observe, Turbonomic, and the ServiceNow integration connect with little work, and federal teams gain from its FedRAMP listing.
The reasons we see teams move are structural. The platform now serves as an engine inside Concert, the add-ons meter apart from the server count, and the scope stops at the application layer.
Replace IBM Instana With Motadata ObserveOps
IBM Instana answers one question well. Which service slowed down, and what called it? For a cloud-native team, that may be the whole job.
Motadata ObserveOps answers the next one. Traces sit beside the servers, logs, network flows, and configurations under them, on one license and one topology. Because of OpenTelemetry-native monitoring, the instrumentation you already run comes along.
We would not put it in front of everyone. Among the IBM Instana alternatives above, a team needing mobile app monitoring or broad language coverage should look elsewhere. Everyone else gets one platform that sees from the code down to the switch, and one renewal conversation instead of two.
FAQs
Is IBM Instana being discontinued?
No. IBM still sells Instana on its own pricing page. Since May 2026, IBM also positions it as the engine behind Concert Observe, part of the Concert platform, so new features and packaging may increasingly arrive through Concert.
Is IBM Instana free?
No. Instana offers a 14-day free trial, then paid plans priced per Managed Virtual Server, with logs and synthetic tests billed separately. Motadata ObserveOps also offers a free trial, and its license counts devices and sources instead.
What should you test when migrating off Instana?
Test instrumentation coverage for your languages, whether your OpenTelemetry collectors keep working, trace retention at production volume, and the full cost model. ObserveOps ingests OTLP natively, so existing OpenTelemetry instrumentation carries over without rework.
Which IBM Instana alternatives can be self-hosted?
Motadata ObserveOps, Dynatrace Managed, AppDynamics on-premises, self-managed Elastic, Grafana's open-source stack, and SigNoz all run on your own infrastructure. Datadog, New Relic, and Honeycomb are SaaS only.
Is Motadata ObserveOps a good IBM Instana alternative?
It fits teams that want APM, logs, network flows, and configuration data on one license, with an on-premises option. It fits poorly if you need native mobile monitoring or instrumentation beyond its six supported languages.
Author
Ramya Shah
Technical Writer
Ramya Shah is a technical content writer with a computer engineering background and roots in automotive journalism. He covers IT Service Management, observability, IT operations, and AI-driven automation. An early adopter of AI-assisted writing workflows, he turns complex IT processes into clear, engaging content optimized for search and answer engines (AEO), lifting content output and organic visibility.