Tail Sampling: How It Works and When to Use It
A busy service can produce millions of traces an hour. Nearly all of them record requests that worked exactly as intended. Keeping every one costs real money and teaches you very little.
Tail sampling fixes that by deciding late. Your distributed tracing pipeline collects the whole trace first, then picks what to store. Tail-based sampling can therefore keep every failed request and drop the routine ones.
In this blog, you'll see:
How head sampling and tail sampling differ in what each one can decide.
Which sampling policies exist, and which question each one answers.
What the decision buffer costs you in collector memory.
By the end you'll be able to size a tail sampling setup before you deploy it.
What Is Tail Sampling?
Tail sampling is a tracing technique. It decides whether to keep a trace after all its spans have finished. The name points at the tail end of the request, where the outcome is finally known.
The decision happens outside your application code. A collector gathers the spans and waits a set period. Then it runs your rules against the completed trace.
That timing changes what a rule can ask. A tail sampling policy can check whether any service in the chain returned an error. It can also check the total duration against your latency target. Neither question has an answer when the request first arrives.
Most teams meet it through the tail sampling processor in the OpenTelemetry Collector. That's what the rest of this guide covers.
Head Sampling vs Tail Sampling: What Each One Can Decide
Head sampling and tail sampling differ in one thing, which is when the decision gets made. Everything else follows from that. The table sets the two side by side.
Head sampling | Tail sampling | |
When it decides | As the trace begins | After the spans arrive |
What it can see | The root span and its attributes | The full trace, errors included |
Where it runs | In the SDK, inside each service | In the collector |
State it holds | None | Spans buffered in memory |
Collector cost | Negligible | CPU and RAM scale with trace volume |
Can it guarantee errors are kept | No | Yes |
Head sampling stays cheap because it commits early and never looks back. A fixed percentage of traces gets recorded, and the rest are never created (so there is nothing left to drop later). That keeps overhead near zero.
The cost shows up when something breaks. A failure deep in a service chain stays invisible at the start. The first service decided long before that error existed. Head sampling discards the trace at its usual rate.
The more services a request touches, the worse that gets. Microservices monitoring routinely involves a dozen hops per request. The interesting failure is rarely in the first one.
We see most teams run both techniques together. Head sampling thins traffic near the source. Tail sampling then makes the quality decision on whatever survives, which keeps the collector's workload manageable.
How the Tail Sampling Processor Buffers and Decides
The processor holds spans in memory until it believes a trace is complete. It then evaluates your policies against the whole thing. Five settings control that behavior, and the defaults matter more than most teams expect.
Setting | Default | What it controls |
decision_wait | 30s | How long spans buffer before the policies run |
num_traces | 50000 | Traces held in the circular buffer at once |
expected_new_traces_per_sec | 0 | A sizing hint so memory gets allocated up front |
num_shards | 1 (maximum 256) | How far buffer work spreads across cores |
decision_cache | 0 (inactive) | Whether past decisions are remembered for late spans |
The buffer is circular. Once it fills, each new trace evicts the oldest one. An evicted trace never reaches your policies. It also leaves no error behind, which makes this failure easy to miss.
Turning on decision_cache is worth doing early. Spans sometimes arrive after their trace was already decided. Without the cache, the collector treats each straggler as a brand new trace. You then store orphaned fragments of requests you chose to drop.
All of this sits inside your telemetry pipeline as a stateful stage. That's unusual, because most collector processors handle one span at a time and forget it immediately.
What Are the Tail Sampling Policy Types?
The processor ships seventeen policy types. They fall into seven groups, sorted by what each one inspects. Grouping them this way makes the choice much faster than reading the list in order.
What the policy inspects | Policy types | The question it answers |
Outcome | status_code, trace_flags | Did any part of this request fail? |
Duration | latency | Was it slower than our target? |
Volume | probabilistic, rate_limiting, bytes_limiting | How much normal traffic do we keep? |
Attributes | string_attribute, numeric_attribute, boolean_attribute, trace_state | Does this belong to a tenant, route or flag we care about? |
Trace shape | span_count | Is this trace unusually large or small? |
Custom logic | ottl_condition | Anything the other policies cannot express |
Combination | and, not, drop, composite, always_sample | How do the rules above join together? |
The setups we see in production use three or four policies, not seventeen. A status_code rule catches errors. A latency rule catches slow requests. Those two cover what nearly every team wants.
A low-rate probabilistic rule then keeps a baseline of healthy traffic. That baseline is what keeps your error rates meaningful.
The combination policies deserve a closer look. An and policy narrows a rule to one route or one tenant. That stops a broad rule from keeping far more than you intended. A drop policy removes matching traces before anything else runs, and health checks belong there.
Policies evaluate independently of each other. A trace matching any single policy gets kept. The rules combine as an OR, never as an AND (unless you reach for the and type explicitly).
Why Every Span Has to Reach the Same Collector
Tail sampling only works when one collector instance holds the entire trace. The processor documentation states it plainly. All spans for a given trace must reach the same collector instance.
That requirement breaks the usual deployment pattern. Collectors normally sit behind a round-robin load balancer. That spreads one request's spans across several instances. Each one then decides on incomplete evidence.
The fix is a routing layer that keys on trace ID. A load-balancing exporter sits in front of your sampling collectors. It sends every span sharing a trace ID to one destination, which turns your collector layer into two tiers instead of one.
The diagram below shows that two-tier shape. The routing layer sits between your services and the sampling collectors.
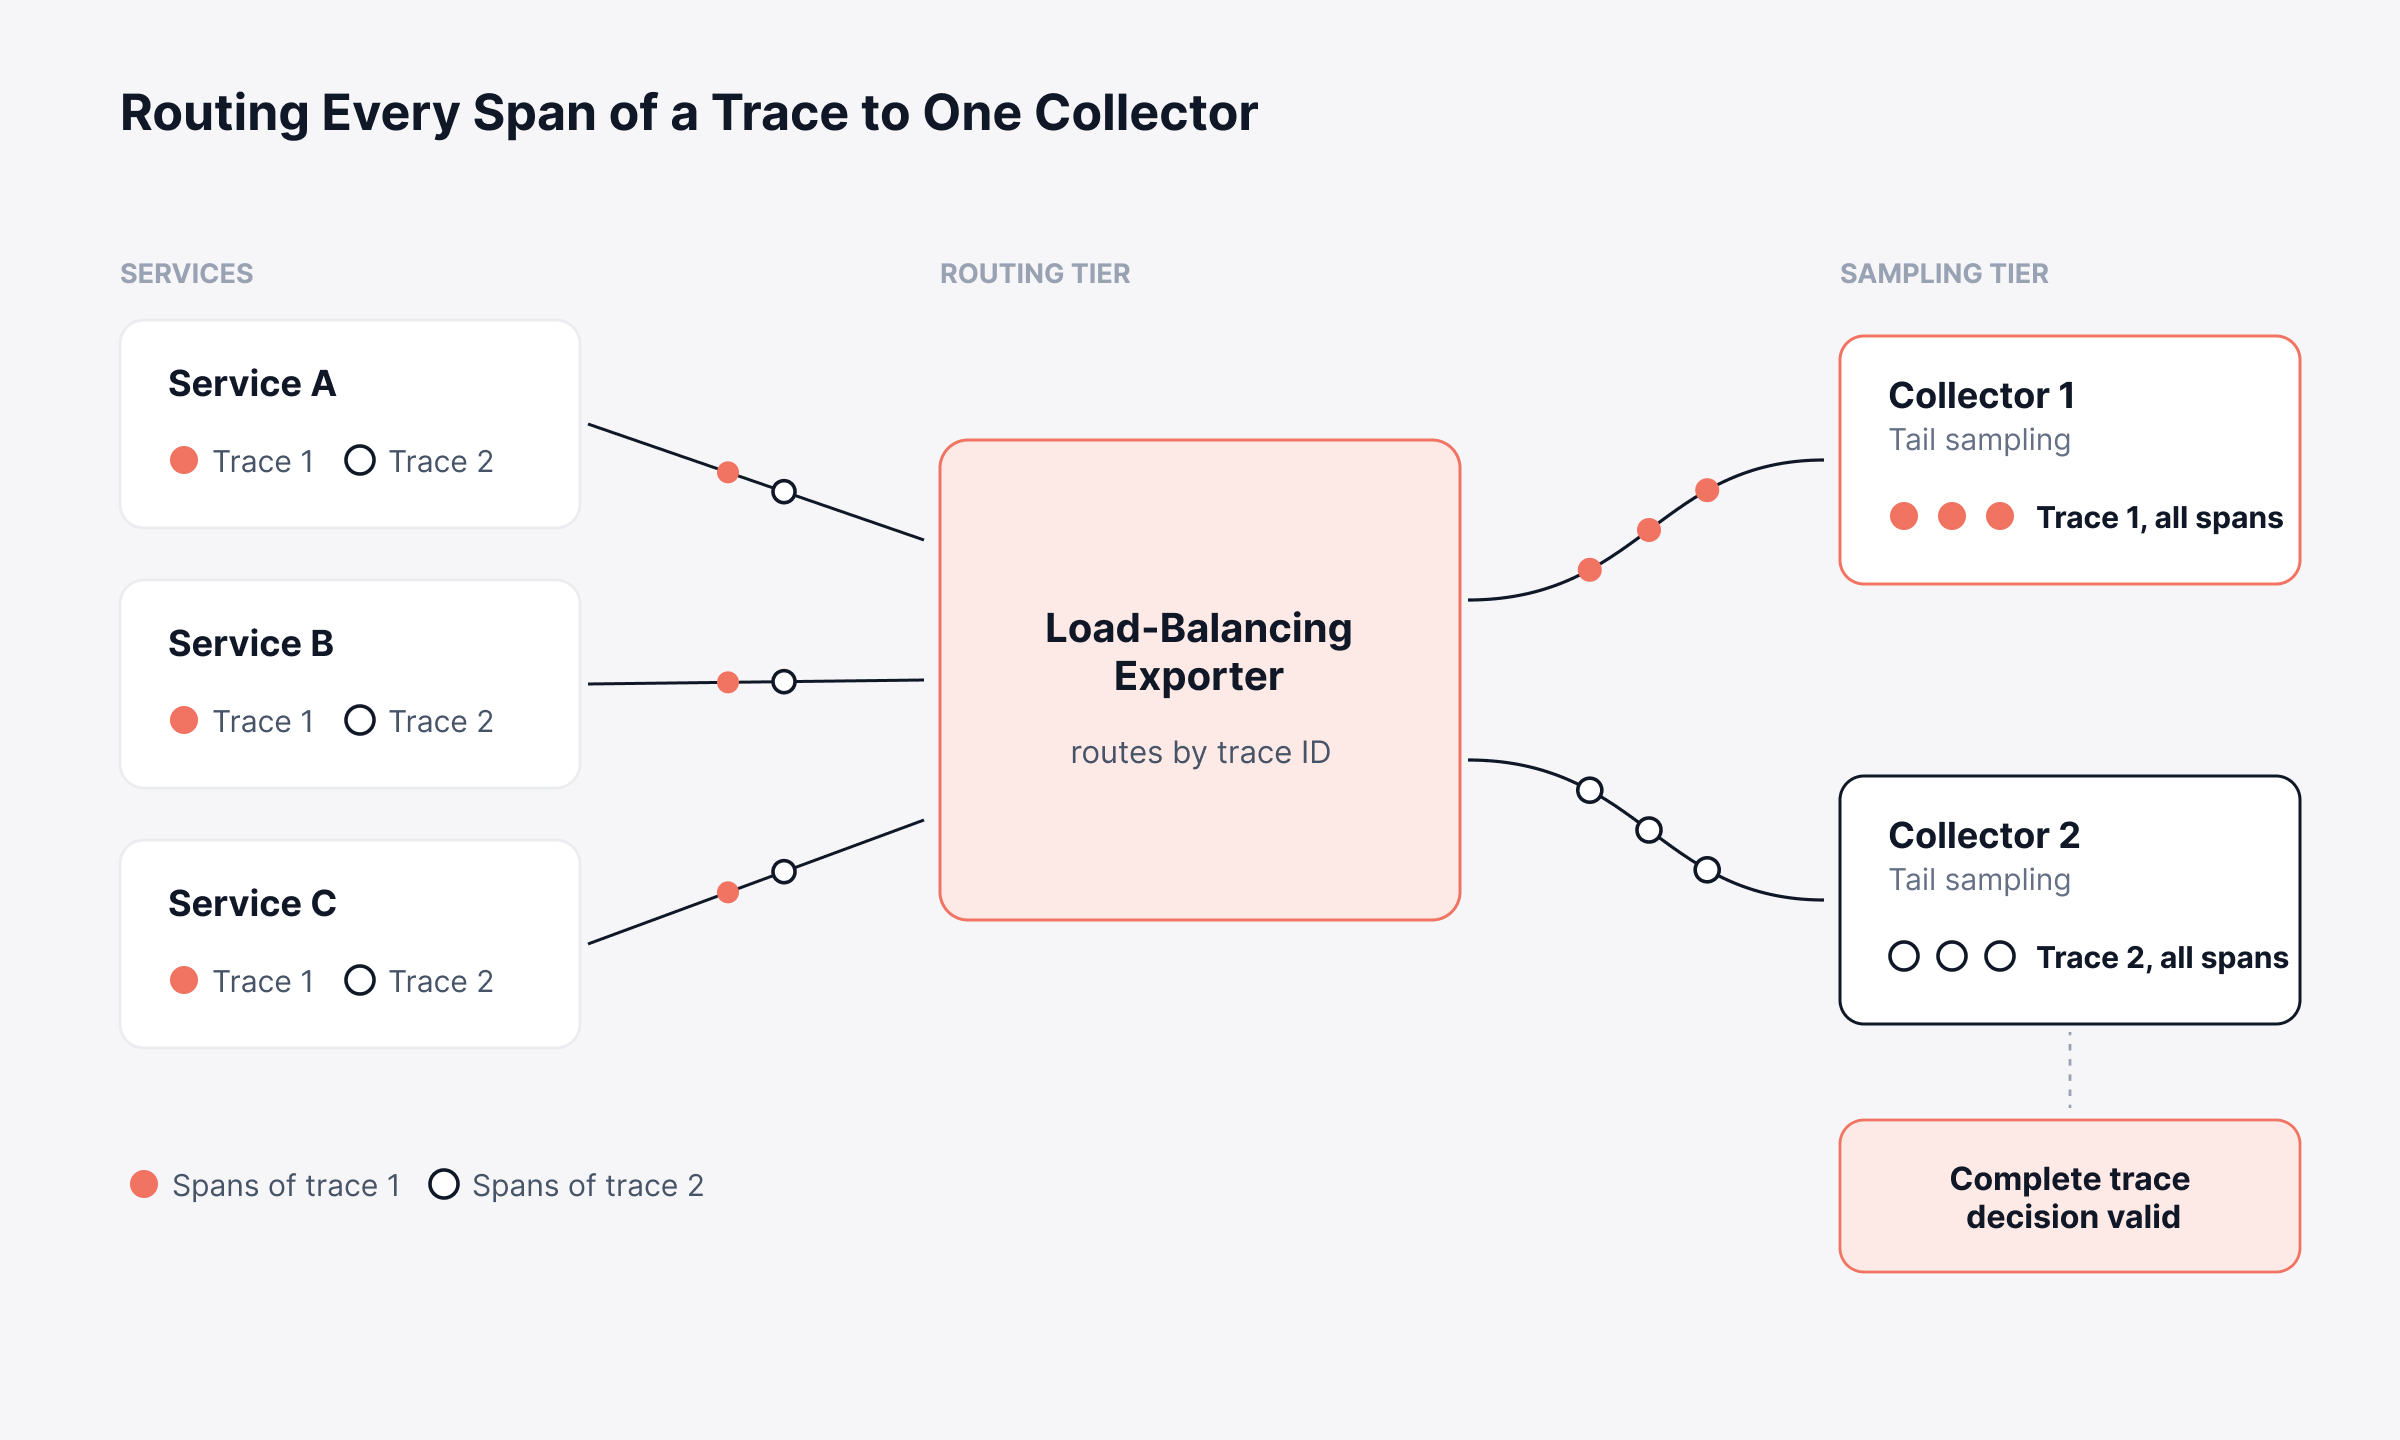
Teams running Kubernetes monitoring hit this first. Pod scaling and rescheduling keep changing the instance count underneath them. A stateful processor doesn't enjoy that.
Plan the routing tier before you turn on any policy. The sampling output looks perfectly plausible either way (which is exactly what makes the mistake expensive).
How Much Memory Does Tail Sampling Need?
Tail sampling needs enough memory to hold every trace still inside its decision window. Four numbers tell you whether the default settings will hold your traffic.
Step | What you work out | Worked example |
1. Trace rate | New traces started per second | 2,000 traces per second |
2. Decision window | Your decision_wait value, in seconds | 30 seconds (the default) |
3. Traces in flight | Rate multiplied by window | 60,000 traces held at once |
4. Buffer check | num_traces must exceed that figure | 50,000 default is too small, so raise it |
Step 4 is where most rollouts go wrong. A service handling 2,000 traces per second already overflows the default buffer. That rate is ordinary for a mid-sized estate. The processor then evicts traces before your policies ever see them.
Two levers bring the number down. Cutting decision_wait to 10 seconds drops the traces in flight to 20,000, which fits comfortably. Head sampling upstream reduces the arrival rate itself, so the same window holds far fewer traces.
Multiply the trace count by your average spans per trace to estimate real memory. A trace with 40 spans at roughly 500 bytes each needs about 20 KB. Sixty thousand of those need somewhere near 1.2 GB (before any runtime overhead).
We'd measure your own span sizes instead of trusting that figure. Span size varies enormously with how much your instrumentation attaches to each one.
When Should You Not Use Tail Sampling?
Tail sampling is worth skipping in several common situations, and the memory cost above is why. A stateful processor plus a routing tier is a lot of machinery to run.
Your trace volume is low enough to keep everything, which is true more often than teams assume.
You cannot guarantee that all spans of a trace reach one collector, and you aren't ready to build the routing tier.
Your contract meters something other than trace volume, so sampling saves you nothing on the invoice.
You need complete trace records for audit or compliance, where any dropped request is a gap.
Head sampling covers the first case perfectly well at a fraction of the operational cost. We'd rather see a team run a simple 10 percent head sample reliably than a tail sampling tier nobody has sized.
Six Starting Points for a Tail Sampling Policy Set
Your policy set should follow the problem you're solving, not a template. The six situations below cover most first rollouts, each with a sensible place to begin.
Your situation | Start with | Why |
First rollout, nothing configured | status_code on ERROR, plus probabilistic at 1 to 5 percent | Guarantees failures while keeping a baseline for rates |
Users report slowness, errors look fine | latency above your SLO threshold | Errors alone miss requests that succeed slowly |
One endpoint dominates your volume | and, combining string_attribute on the route with probabilistic | Thins that route without touching the others |
Collector memory under pressure | A shorter decision_wait and more num_shards | Fewer traces in flight, spread across more cores |
Health checks flooding the buffer | drop on the synthetic traffic attribute | Removes them before they occupy buffer space |
A customer tier you must never lose | string_attribute on the tenant identifier | Exempts those traces before any thinning happens |
Errors and latency map onto two of the golden signals. That's why the pairing works so well as a default. Metrics serve traffic and saturation better, so those two rarely belong in a sampling policy.
Watch what your rules keep in combination. Three broad policies can easily retain 40 percent of your traffic (far more than anyone intends). Each one looks narrow on its own. Nothing in the config warns you about the total.
Does Tail Sampling Actually Cut Your Bill?
Tail sampling gets sold as a cost control, and that's the weakest reason to adopt it. What it saves you depends on how your vendor meters tracing. Three meters are common, and they respond very differently.
Tracing meter | What it counts | What sampling changes |
Per ingested span | Spans written to the backend | The line falls by roughly the share you drop |
Per gigabyte | Trace data volume | Falls in proportion, with span size as the variable |
Per instrumented application | Applications you watch | Nothing, because the application count does not move |
The first two meters make aggressive sampling urgent. They also explain why so many tracing vendors publish so much about it.
We license ObserveOps APM on that third row, per instrumented application or agent. Sending fewer traces from the same application doesn't reduce what you pay for it.
That changes why you would sample at all. Teams on a per-application meter tune for signal quality and collector load. The invoice never enters that decision, so they keep more detail and move at their own pace.
We don't make the sampling decision ourselves, and no backend really should. Our ingest side stays OpenTelemetry-native, so traces arrive over OTLP from whatever collector you run. Tail sampling happens upstream in that collector, which keeps the decision portable between platforms.
We care about what happens next, once a sampled trace points at a real fault. That trace sits on the same record as the host metrics behind it. So does the ticket it raises.
How Do You Roll Out Tail Sampling Safely?
A safe rollout changes one variable at a time and measures after each change. These five steps work in order.
1. Build the Routing Tier First
Put the load-balancing exporter in place before you enable a single policy. Sampling against partial traces produces results that look correct and are not. Getting this wrong early costs you weeks of misplaced trust.
2. Start With always_sample and Watch Memory
Run the processor with always_sample for a short period (an hour of peak traffic is plenty). Nothing gets dropped, so you learn your real trace rate and buffer behavior without risking data. Check whether the circular buffer is evicting anything.
3. Add Errors and Latency
Switch to a status_code rule on ERROR and a latency rule at your SLO threshold. These two carry most of the value. Both are also easy to explain to the teams who own the services, and a flame chart of one slow trace usually ends the argument.
4. Introduce the Probabilistic Baseline
Add a low-rate probabilistic policy for healthy traffic. Start near 5 percent and reduce it once you confirm your dashboards still read correctly. Sampled rates need scaling back up, so check any count that feeds a report.
5. Review the Retention Rate Monthly
Measure what share of traces your policies keep, then compare it against last month. Traffic patterns move, and a rule tuned for March quietly keeps twice as much by June. Log sampling needs the same review, though it runs on separate rules.
Size the Buffer First, Then Start With Errors and Latency
Tail sampling earns its place when you need a guarantee that failures survive. No head-based rule can offer that, because the outcome arrives too late for it to matter.
It also adds a stateful, memory-hungry component and a routing tier to your pipeline. That's a genuine operating cost. We'd point a smaller estate at head sampling first.
Size the buffer before you write a policy. Work out your traces in flight and compare that against num_traces. Then start with errors and latency, and let a month of data tell you what to tune. Teams who keep traces, metrics and tickets on one unified observability and ITSM platform find that tuning conversation a lot shorter.
FAQs
What is the difference between head sampling and tail sampling?
Head sampling decides at the start of a trace, using only the root span. Tail sampling waits until the spans arrive, so it can see errors and total duration. Head sampling costs almost nothing, while tail sampling needs collector memory.
Does tail sampling work with any tracing backend?
Yes, because the decision happens in the OpenTelemetry Collector instead of the backend. Any platform that accepts OTLP receives whatever the collector keeps. That portability is a good reason to run sampling in the collector, not in a vendor agent.
How long should decision_wait be?
Long enough for your slowest normal trace to finish, which is usually 5 to 15 seconds. The 30 second default is safe but holds a lot of traces in memory. Check your p99 trace duration and set the value just above it.
Can tail sampling break my dashboards?
It can, if a chart counts traces instead of reading metrics. A sampled count under-reports by whatever share you dropped, so it needs scaling back up. Keep request rates and error rates on metrics, which stay unsampled.
Is tail sampling the same as log sampling?
No, the two work on different data and different rules. Log sampling thins individual log events by category or level. Tail sampling keeps or drops a whole trace together. Plenty of teams run both, with separate settings for each.
Author
Ramya Shah
Technical Writer
Ramya Shah is a technical content writer with a computer engineering background and roots in automotive journalism. He covers IT Service Management, observability, IT operations, and AI-driven automation. An early adopter of AI-assisted writing workflows, he turns complex IT processes into clear, engaging content optimized for search and answer engines (AEO), lifting content output and organic visibility.