Best Zabbix Alternatives in 2026: 8 Monitoring Tools Compared
At what point does a free monitoring platform stop paying for itself? With Zabbix, the shift is gradual. Templates need tuning, the database keeps growing, and alert rules get rebuilt after every false alarm, until the upkeep quietly costs more than the license ever saved.
That calculation is what leads most teams to evaluate Zabbix alternatives. Zabbix monitors servers, SNMP devices, and service availability reliably, and it carries no license fee. The expense shows up later. It lives in the hours your team spends operating the platform, scaling it, and keeping it running.
The market has since caught up. A number of mature tools now cover the same infrastructure monitoring territory Zabbix does. Some are lighter open-source Zabbix alternatives. Others are fully managed SaaS platforms, and a few are AI-driven suites that hand an alert straight to a service desk.
The sections ahead cover:
Eight tools compared on setup effort, telemetry breadth, deployment model, AI depth, and whether an alert connects to ticketing.
A comparison table and detailed reviews, with the trade-offs and limitations of every tool, including our own.
A staged plan for migrating off Zabbix without a risky cut-over, plus a short guide to matching your team with the right tool.
By the end you should know which of the eight is worth a trial in your own environment, and which you can rule out.
Why do Teams Look for a Zabbix Alternative?
Teams look for a Zabbix alternative when the maintenance load, dated interface, or missing application-layer visibility begins to cost more than the free license saves.
Monitoring is not an area to underinvest in. Uptime Institute's 2025 analysis reports that 54 percent of operators put their most recent significant outage above $100,000, and roughly one in five above $1 million, with network and IT issues now the largest single cause of IT service outages. A monitoring tool that is difficult to tune, or blind to the application layer, increases the risk of missing a critical alert, and network downtime on that scale carries direct financial exposure.
Five reasons come up most often.
1. Steep Learning Curve and Complex Configuration
Zabbix is not plug-and-play. Hosts, items, triggers, templates: each of these takes time and expertise to set up, and even routine changes can send you into custom scripts or a chain of configuration screens. New team members encounter this complexity first.
2. High Maintenance Overhead
Zabbix is self-hosted, so the whole stack is yours to run. You keep the server up, you manage a database that grows fast, you apply the updates, and you tune performance when it slips. Most teams describe this work as an ongoing operational cost.
3. Scaling Requires Planning
Zabbix can watch thousands of devices, but getting there takes planning, with load to distribute and a database to tune. There is no auto-scaling, and without someone who knows the internals, performance tends to slip. Scaling becomes a planning exercise rather than a configuration change.
4. A Dated Interface
The web interface has come a long way, though plenty of users still find it awkward to work in. An interface that feels dated slows troubleshooting, and building the clean dashboards that newer tools ship by default becomes harder than it should be.
5. No Native APM or Unified Telemetry
Zabbix is strong on infrastructure metrics, so it identifies what has broken. Zabbix was not built for application performance monitoring or distributed tracing, so it cannot easily explain why. Teams then add separate tools for logs, traces, and application insight, which recreates the data silos that monitoring is meant to eliminate.
How We Evaluated These 8 Tools
We looked at these eight Zabbix alternatives the way a team actually researches the move, reading vendor documentation, checking published pricing, and weighing how each tool handles deployment, telemetry, AI, and ticketing.
Five factors carried the most weight:
Setup and maintenance load: how much configuration and day-to-day care each tool asks for, set against the template and database overhead Zabbix is known for.
Telemetry breadth: whether one platform handles metrics, logs, flows, and traces, or the job gets split across several, which is the heart of full-stack observability.
Deployment flexibility: the mix of self-hosted, SaaS, on-premises, and hybrid on offer, and whether data-residency rules can be honored.
AI and automation depth: how good the anomaly detection and alert correlation are, and how long the tool takes to reach a baseline you can trust.
How far the loop closes: whether an alert can open a ticket on its own or stops at a dashboard.
The 8 Best Zabbix Alternatives Compared
The table below summarizes the eight tools at a glance. Pricing reflects publicly available information at the time of writing, so confirm current figures before purchasing.
Tool | Best For | Deployment | Pricing | Free Option |
Motadata ObserveOps | Hybrid, regulated, ITSM-tied estates | On-prem, private/public cloud, hybrid | Quote-based | Yes, 30-day trial |
Datadog | Fully managed SaaS full-stack | SaaS | Pro from $15/host/mo, usage-based | Free tier plus trial |
Checkmk | Faster-to-deploy open source | Self-hosted or cloud | Raw free; Pro from ~€190/mo | Yes, Raw edition |
PRTG | Windows-centric, sensor-based, on-prem | On-prem (Windows) or hosted | Free to 100 sensors; PRTG 500 from ~$200/mo (billed annually) | Yes, 100 sensors |
SolarWinds Observability | Deep enterprise network detail | SaaS and on-prem options | Node-based, from ~$7/node/mo (quote-based); verify on vendor page | Trial available |
Prometheus | Cloud-native and Kubernetes metrics | Self-hosted | Free and open-source | Yes, fully free |
Grafana | Visualization and alerting on an existing backend | Self-hosted or Grafana Cloud | OSS free; Grafana Cloud Pro from ~$19/mo | Yes, free tiers |
Netdata | Lightweight real-time host metrics | Self-hosted or cloud | Community free to 5 nodes; from ~$4.50/node/mo | Yes, to 5 nodes |
8 Best Zabbix Alternatives for 2026
The eight best Zabbix alternatives in 2026 cover a broad range. A few are unified, AI-driven platforms. Others include managed SaaS suites, open-source stacks, and lightweight sensor- or host-based monitoring tools. Each review below covers the tool's best-fit use case, key features, pros and cons, and pricing.
1. Motadata ObserveOps
Best for: Enterprise IT and network operations teams on hybrid or regulated estates that want a monitoring alert to open, and close, a service desk ticket on its own.
Motadata ObserveOps brings metrics, logs, network flows, traces, and topology into one platform, replacing the four or five separate tools most hybrid estates run today. The platform is built on DFIT (Deep Learning Framework for IT Operations), Motadata's AI engine, which correlates signals by cause rather than raising a separate alert for every threshold breach.
DFIT maps dependencies, detects anomalies, reduces alert noise, and forecasts issues without a training or baseline period. This supports usable root cause analysis in the first week rather than after months of tuning.
Because ObserveOps shares this AI foundation with Motadata ServiceOps, an alert can open a ticket, route it to the right team, and close it automatically once the issue clears. Motadata reports customers reducing MTTR by up to 80 percent and downtime by 45 percent after consolidating onto the platform, which are the vendor's own marketed figures and should be treated as directional.
Pros
- One platform for metrics, logs, flows, and traces, replacing several separate tools
- On-premises and private-cloud options for teams bound by data-residency rules, such as those in BFSI, telecom, and government
- Connects monitoring alerts directly to ticketing rather than stopping at a dashboard
- AI correlation that works from the first week, with no baseline period
Cons
- Pricing is tailored to each deployment rather than published, so you request a scoped quote
- Public review volume is smaller than the largest SaaS incumbents, though ObserveOps is featured in the Gartner Market Guide for IT Operations Platforms
- Built as a broad IT operations platform, so a team after a single-purpose network tool may not use its full range
Pricing: Quote-based, scoped to your deployment mode and the modules you pick, with a 30-day free trial.
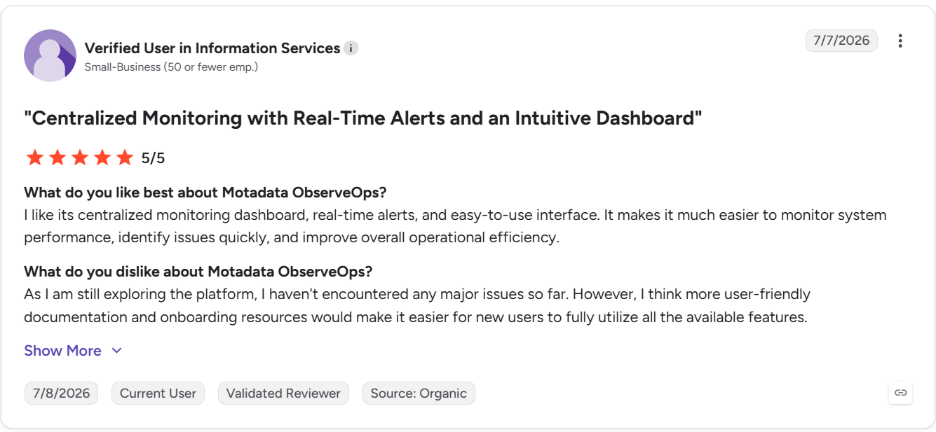
Here's what our customers say about Motadata ObserveOps on G2.
2. Datadog
Best for: Teams that want a fully managed SaaS platform spanning infrastructure, applications, and logs, and can plan around usage-based pricing.
Datadog removes the maintenance that Zabbix requires. It pulls infrastructure monitoring, APM, and log management into one console, backed by a large integration library and dashboards that reviewers tend to rate well.
What you give up is cost predictability and some control. The usage-based bill climbs as hosts, custom metrics, and log volume grow, and forecasting it takes steady attention. With Zabbix, the cost lands in staff hours. Datadog moves it onto an invoice that rises with your traffic and your high cardinality data.
Pros
- No infrastructure to run or maintain
- Polished interface and quick onboarding
- Extensive integration coverage
- Strong APM and tracing depth
Cons
- Usage-based pricing becomes expensive at scale
- Invoices are difficult to forecast as metrics and logs grow
- SaaS-on Delivery is a poor fit where data-residency rules are strict
Pricing: Starts at about $15 per host per month for infrastructure and about $31 per host per month for APM, billed annually, with log and usage fees on top. A free tier and trial are available.
3. Checkmk
Best for: Teams that like the self-hosted, open-source model but want a faster start than Zabbix gives, using smart-agent auto-discovery.
Checkmk keeps the ownership that Zabbix users value while reducing the configuration effort. Its smart agents collect a large volume of data with minimal manual setup, and its service discovery brings a monitored estate online faster than a template-driven approach. Infrastructure and network monitoring run in one interface.
Checkmk ships as a free open-source Raw edition alongside paid commercial tiers. As with any self-hosted tool, your team still operates and maintains the server, and the advanced features require a paid edition.
Pros
- Faster to deploy than Zabbix through auto-discovery
- Capable free open-source edition
- Efficient agents with low resource use
- One interface for infrastructure and network
Cons
- Remains a self-hosted tool with its own maintenance
- Advanced features require a paid edition
- No native APM or distributed tracing
Pricing: The Raw edition is free and open-source. The paid editions begin around €190 per month for Checkmk Pro, billed annually, with Cloud, Ultimate, and MSP tiers priced above that.
4. PRTG Network Monitor
Best for: Windows-centric IT teams and mid-sized organizations that want a single, sensor-based tool they can deploy quickly on-premises.
Paessler's PRTG is easier to set up than Zabbix. The installer bundles the database, so there is no separate backend to look after, and the sensor model keeps pricing easy to follow: every metric you monitor counts as one sensor. Auto-discovery scans network ranges and configures devices automatically.
The sensor model is also the constraint. Costs increase as sensor counts grow across a large estate, and PRTG suits traditional and Windows environments more than dynamic, cloud-native workloads. PRTG focuses on infrastructure and network monitoring software, not application tracing.
Pros
- Quick, straightforward setup
- Transparent, predictable licensing
- Reliable for on-premises and Windows estates
- Free tier for up to 100 sensors
Cons
- Per-sensor cost increases on large estates
- Limited fit for cloud-native and microservice workloads
- No native APM or log analytics
Pricing: Free up to 100 sensors. Beyond that, tiers scale with sensor count, billed monthly on an annual subscription: PRTG 500 runs about $200 per month, PRTG 2500 about $742 per month, with larger tiers above that. Confirm current figures on the Paessler pricing page.
5. SolarWinds Observability
Best for: Enterprise network teams that want detailed network and path analysis and topology mapping, with an established vendor behind it.
Network depth is where SolarWinds stands apart, going beyond what a general-purpose tool like Zabbix covers. Its observability and network performance products give detailed insight into paths, devices, and topology, with strong alerting and reporting. AI-driven correlation groups related events, so you reach a probable root cause and blast radius quickly.
SolarWinds is enterprise-grade and priced accordingly. Value appears most on large, complex hybrid estates, and the vendor now sells on multi-year subscription terms, so a single cloud-native application would not use most of the platform's capabilities.
Pros
- Detailed network insight that many tools omit
- Powerful alerting and reporting
- Backed by an established enterprise vendor
- Flexible deployment across hybrid estates
Cons
- Cost scales with monitored nodes across a large estate
- Now sold only on multi-year subscription terms
- More capability than a small or single-cloud application requires
Pricing: A node-based subscription with a published starting rate of about $7 per node per month, though most deployments are quoted, and it is sold on multi-year terms. A 30-day trial is available. Confirm current pricing on the SolarWinds Observability pricing page.
6. Prometheus
Best for: Cloud-native and Kubernetes teams that want an open-source metrics engine and are comfortable running it themselves.
Prometheus is built for dynamic environments where services appear and disappear, unlike Zabbix's host-centric design. It scrapes metrics on a pull model, stores them in its own time-series database, and queries them with PromQL, which suits microservices and containers well. Service discovery for Kubernetes comes built in, and Alertmanager handles routing, grouping, and silencing.
Prometheus does one job. It collects and queries metrics, and stops there. Its built-in interface is minimal, so most teams pair it with a dashboarding layer, and long-term storage usually means adding Thanos or Mimir. Logs and traces need separate tools entirely.
Pros
- The CNCF standard for cloud-native metrics
- Purpose-built for containerized and ephemeral workloads
- Free and open-source, with a large community
- Wide exporter coverage for common infrastructure
Cons
- Metrics only, with no logs, traces, or APM
- Minimal built-in visualization, so a dashboard tool is effectively required
- Long-term storage and high availability need extra components
Pricing: Free and open-source to self-host. Managed options are available through third-party cloud services.
7. Grafana
Best for: Teams that already have a metrics or logs backend and want a flexible open-source visualization and alerting layer on top.
Grafana is the leading open-source dashboarding tool, and it connects to a long list of data sources, including Prometheus, SQL databases, and cloud provider metrics. Dashboards are highly customizable, the plugin library is extensive, and unified alerting lets you define rules across several data sources in one place. Grafana Cloud adds a managed option, with Loki for logs and Tempo for traces.
Grafana visualizes data rather than collecting it. It stores no metrics of its own, so you still need a backend feeding it, and building a full observability picture means assembling and operating those pieces yourself. Correlating a metric with a log and a trace takes more manual configuration than a single-model platform, so OpenTelemetry instrumentation helps keep things consistent.
Pros
- Unmatched dashboard flexibility and visual customization
- Connects to almost any data source
- Free and open-source at the core
- Strong community and prebuilt dashboard ecosystem
Cons
- Stores no data itself, so a backend is always required
- Full observability means running several components together
- Enterprise features and support need a paid tier
Pricing: The open-source edition is free to self-host. Grafana Cloud offers a free tier, with a Pro plan built on a $19 per month platform fee plus usage-based charges. Self-managed commercial tiers are priced separately.
8. Netdata
Best for: Teams that want lightweight, real-time, per-second host metrics with almost no configuration.
Netdata is far lighter to deploy than Zabbix. Install the agent and a full dashboard is available immediately, with per-second granularity and auto-discovery of hundreds of services. Resource overhead stays low even across thousands of metrics, and machine-learning alerts help reduce noise.
Netdata's focus is also its limitation. Netdata is built for real-time troubleshooting on individual hosts, while Zabbix is built for long-term, distributed monitoring and alerting. Netdata is simpler, but less comprehensive on distributed architecture, and it does not add application tracing or log analytics.
Pros
- Fastest setup among these tools
- Strong real-time host visibility
- Very light on system resources
- Free for small deployments
Cons
- Host-centric rather than long-term distributed monitoring
- No native APM or log analytics
- Larger estates require the paid plan
Pricing: The Community edition is free for up to 5 nodes. Business runs from about $4.50 per node per month billed annually, with enterprise on-premises options for full data isolation.
How do you Choose the Right Zabbix Alternative?
The right Zabbix alternative depends on why you are leaving, so match your situation to the closest case below rather than the longest feature list.
Hybrid or regulated estate with a service desk in place: Motadata ObserveOps connects monitoring alerts to ticketing and deploys on-premises where compliance rules out SaaS.
Moving away from self-hosting entirely: Datadog removes all maintenance, if you can plan for usage-based cost.
Prefer open source but want faster setup: Checkmk keeps the self-hosted model with auto-discovery that is faster than Zabbix template configuration.
On-premises, Windows-heavy, want it running quickly: PRTG's sensor model and single installer bring you online fast.
Detailed enterprise network analysis: SolarWinds provides path analysis and topology depth built for network teams.
Kubernetes and microservices: Prometheus and Grafana are the cloud-native standard, if you can staff the configuration.
Lightweight real-time host view: Netdata delivers per-second metrics with minimal setup.
Choosing the right platform starts with understanding the difference between monitoring and observability. If threshold alerts on a known set of failures are sufficient, several tools here exceed the requirement. If you need to investigate failures you have not seen before, an AI correlation layer and native tracing add the most value.
How to Migrate from Zabbix
Moving off a tool as established as Zabbix is a significant task, but a staged plan keeps it low-risk. The following approach works for most teams.
Audit your current setup:
Identify which hosts and items are critical, which triggers and alerts fired in the last six months, and which dashboards the team actually uses. Most teams find that a small share of the configuration delivers the majority of the value.
Map Zabbix concepts to the new tool:
Zabbix hosts become the new tool's nodes or devices. SNMP items map to the new tool's SNMP discovery. Agent items change the most, since metrics move to exporters for a Prometheus-style stack or to a vendor agent for SaaS tools, and triggers are rebuilt as the new tool's alert rules.
Run both systems in parallel:
Operate the new tool alongside Zabbix for several weeks. Compare the data to confirm nothing is missing, tune the new alert rules to avoid excess notifications, and let the team learn the interface without pressure.
Decommission Zabbix:
Once you trust the new data and alerts, disable Zabbix alerts, then retire the server and any distributed collectors.
A platform with adaptive AI correlation shortens the parallel-run stage, since it helps you reduce MTTR and separate genuine signals from noise while both systems still run.
Reduce Monitoring Complexity with Motadata ObserveOps
Zabbix has earned its long reputation. For deep, reliable monitoring of traditional servers and network hardware, Zabbix remains dependable, and it is free to license. The difficulty appears in the time required to configure, scale, and maintain it, and in its limited visibility at the application layer.
For hybrid, regulated, or ITSM-tied teams, Motadata ObserveOps is the strongest starting point among these eight tools. ObserveOps brings metrics, logs, flows, traces, and topology onto one platform, runs cause-based AI without a training period, deploys on-premises where compliance requires it, and connects monitoring alerts directly to a service desk.
ObserveOps supports IT operations for more than 500 enterprises across more than 30 countries. It is not the right choice for every team, since a homelab or a small, single-cloud engineering team will move faster with Netdata or a Prometheus and Grafana stack. For most teams evaluating alternatives to Zabbix, the migration itself is rarely the most difficult part, and running both tools in parallel removes most of the risk from the switch.
To see how ObserveOps fits your specific deployment mode and alert volume, you can speak with the ObserveOps team and review the numbers together.
FAQs
What is the best Zabbix alternative?
There is no single winner. Teams that want AI-driven correlation tied to a service desk tend to choose Motadata ObserveOps, teams moving to a fully managed SaaS often choose Datadog, and cloud-native teams lean toward Prometheus and Grafana. The best fit depends on why you are switching, which is why the table above sorts by use case rather than rank.
Is there a free or open source alternative to Zabbix?
Yes, several. Checkmk offers a free open-source Raw edition, Prometheus and Grafana are free at the core, and Netdata has a free community tier for small deployments. Each trades some managed convenience for the control and cost savings of running it yourself.
Is Zabbix outdated in 2026?
No, but it is specialized. Zabbix remains reliable for deep monitoring of traditional servers and network hardware. It is a weaker choice for dynamic cloud-native applications or for teams that want metrics, logs, and traces in one place, which is what moves many of them toward a unified platform such as Motadata ObserveOps.
Does Zabbix do application performance monitoring?
Not natively. Zabbix is built for infrastructure and network metrics, so it shows what has broken rather than why at the application layer. Teams that need distributed tracing and code-level insight usually pair Zabbix with other tools or move to a platform that includes APM, such as Motadata ObserveOps.
How hard is it to migrate off Zabbix?
The switch itself is usually not the difficult part. The effort scales with how deep your custom triggers and dashboards go. Auditing what you actually use, mapping Zabbix concepts to the new tool, and running both systems in parallel for several weeks keeps the move low-risk, and adaptive AI correlation in the new platform shortens that parallel-run stage.
Author
Poonam Lalani
Content Strategist
Poonam Lalani is a B2B content strategist and writer with a background in computer engineering and experience across enterprise technology domains, including AI, cloud, DevOps, data engineering, and IT operations. She specializes in creating research-driven content that simplifies complex ideas and supports product education, thought leadership, and business growth.