All Features
Network Observability
Router Monitoring
Identify any discrepancy in your router network traffic or any bottleneck that can lead to business performance issues. Obtain critical insights, reduce MTTR, and enhance visibility with Motadata ObserveOps.
Routers build a solid network architecture in IT enterprises, and it becomes challenging to manage the associated bandwidths and utilize them to the optimum. Therefore, it is essential to optimize the bandwidth to avoid spending extra money and prevent downtime due to heavy traffic as well.
Having said that, routers need to be monitored to get the most out of them. Router monitoring refers to managing the router network, wherein the health, security, availability and performance of the routers is constantly monitored. This is done to ensure minimal downtime and better operations.
Since routers are the elements that connect network, it becomes essential to monitor them from time-to-time. Motadata ObserveOps, an infrastructure monitoring tool, can track router activities and help ensure high network availability, resolve network issues, handle high traffic, minimize downtime, and more.
Router Monitoring with Motadata ObserveOps
MotadataObserveOps is a monitoring solution built on AI-ML abilities with Deep Learning Framework for IT operations that check all the router connections and bandwidth status, devices, applications, and users. Motadata ObserveOps offers a wide range of features that makes it easy to monitor all of your router traffic, log network activities and calculate network utilization round the clock.
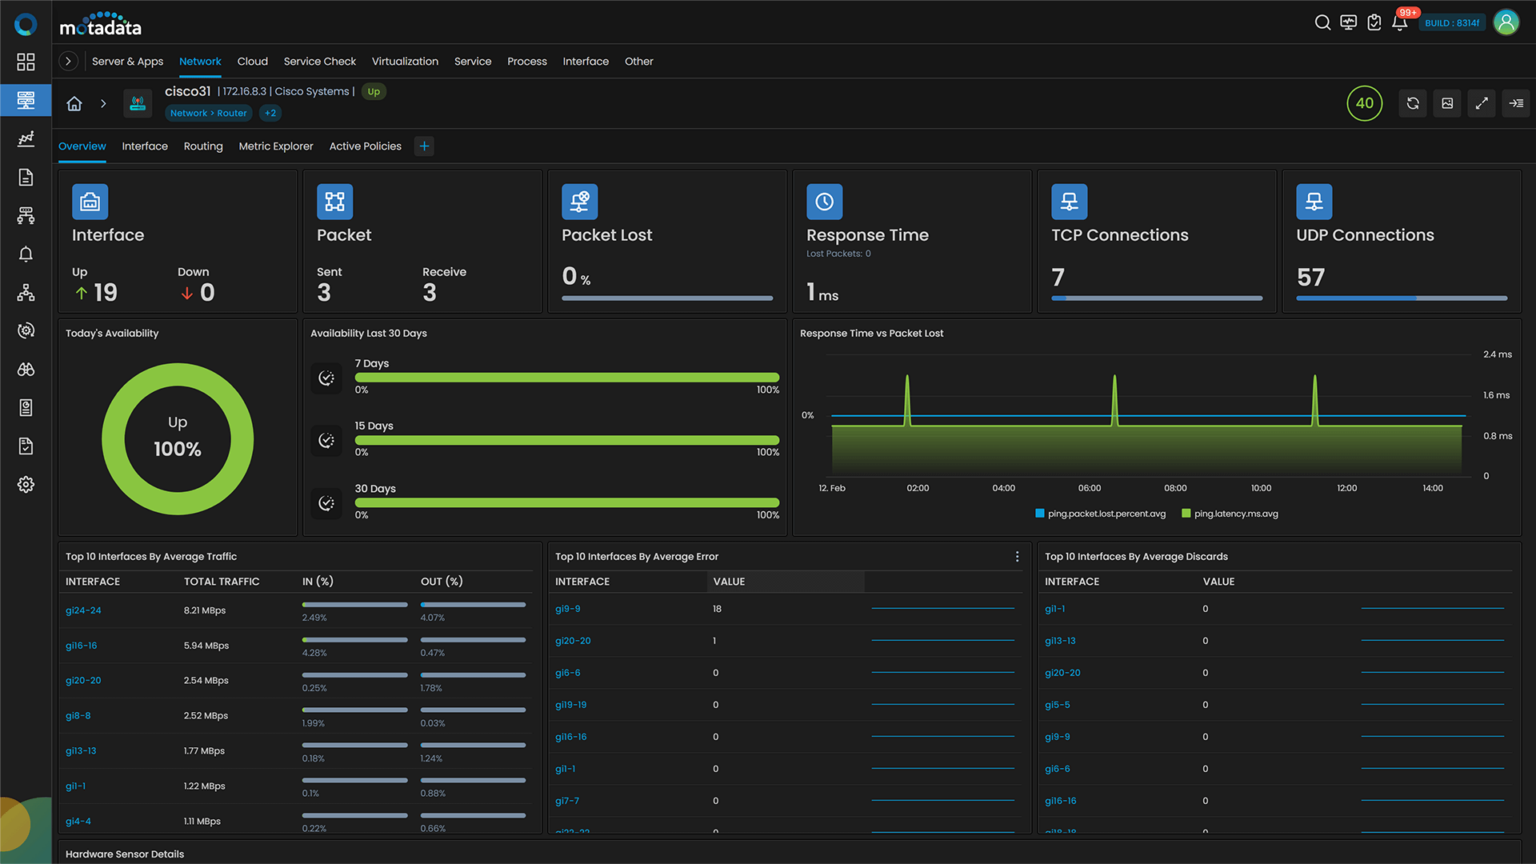
Motadata ObserveOps keeps a constant eye on the routers and collects the data of lost packets, response time, interface statistics, hardware sensor details, and many more. In addition, you can stay updated with statistics of VPN connections with a router monitoring solution.
Motadata ObserveOps also collects the logs from routers and offer insights into traffic passing through your network. By debugging the router logs, you can identify the network issues and find the root cause initiating the problems. In addition, you can get insights into configuration changes and blocked connections and apply rules from the logs collected from routers.
Bandwidth Optimization
Motadata ObserveOps monitors bandwidth, usage, errors, and lost packets. With all the historical audit data, it helps meet the Service Level Agreements with Internet Service Providers. The precise traffic data and bandwidth usage information help discover utilized and under-utilized links and optimize bandwidth allocation across the network.
Many enterprises with private network established over a WAN, connect multiple branches with the head office with the help of MPLS network. Enterprises can create MPLS cloud and connect every branch location to it. Motadata ObserveOps will help monitor this edge routers to track link utilization across their head and branch locations.
With the assistance of specific router interface monitoring, you can identify how the bandwidths are being utilized. You can also tweak the router parameters while monitoring your interface with Motadata AIOps.
Achieve SLA Targets
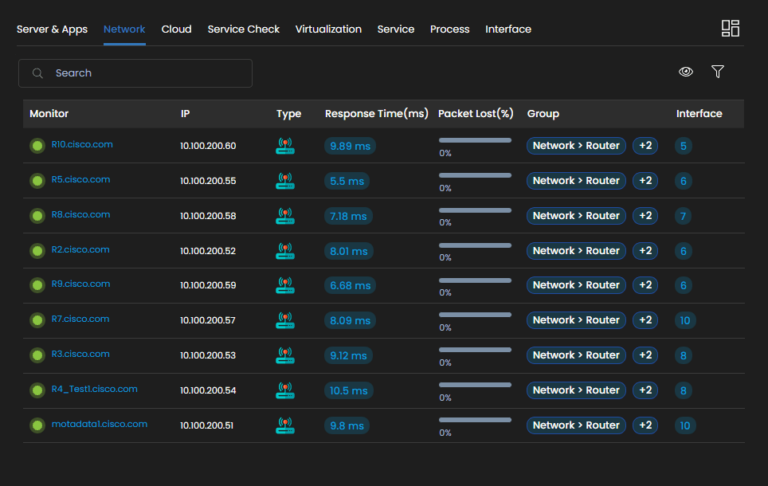
Predict the downtimes by proactively monitoring link latency and errors, assigning the threshold alerts to network admins with Motadata ObserveOps. It could be worse to have a downtime and not know about the same. Set alerts via text or email whenever a link goes down. You can also generate detailed, actionable reports of your network availability and cross-check to ensure your SLA compliances.
Know Network Traffic Utilization Trends
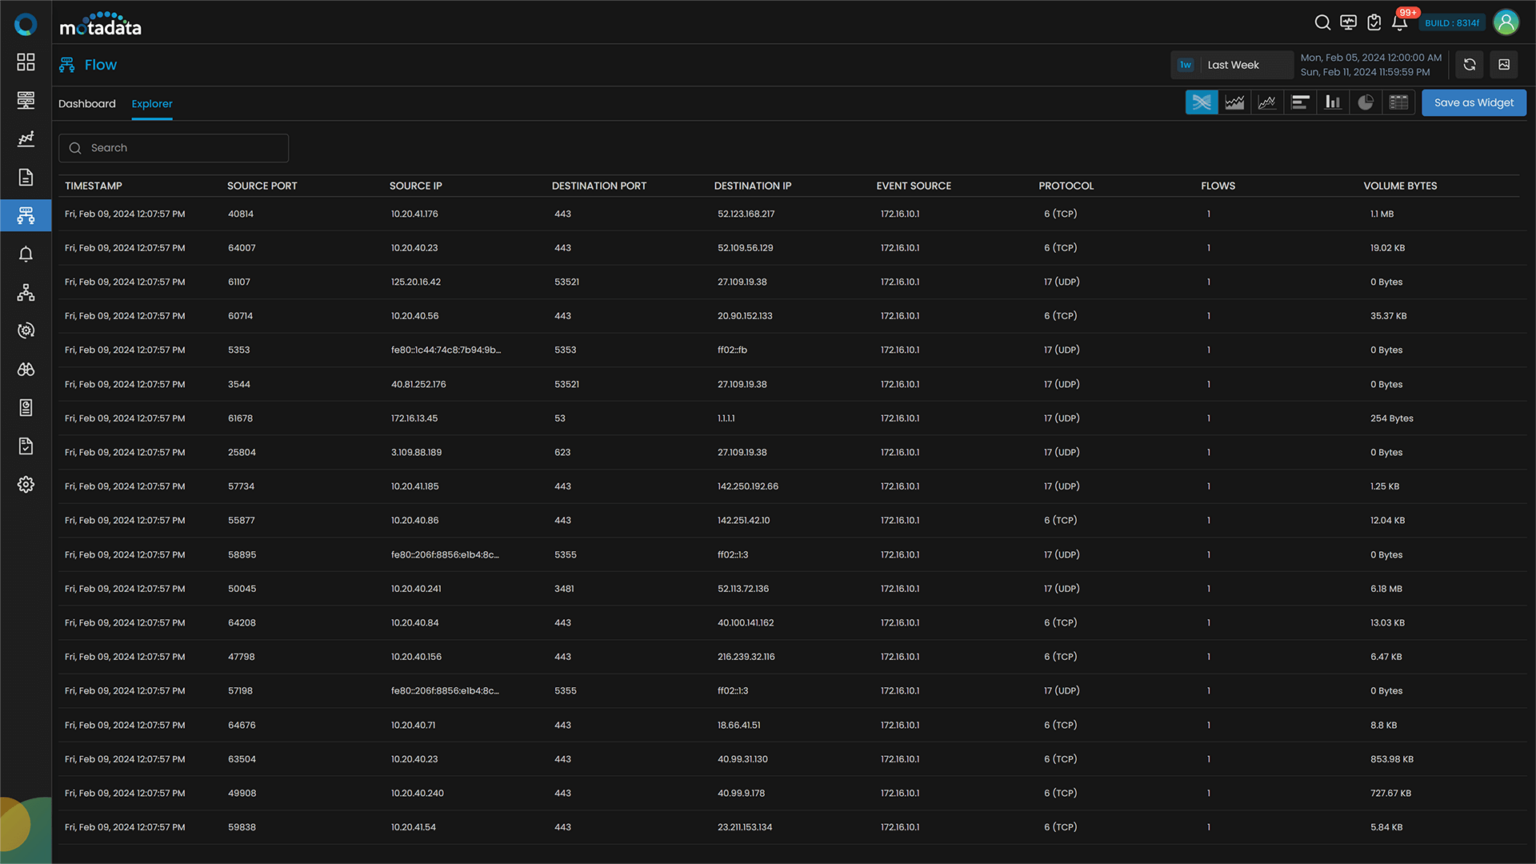
Identify network traffic utilization with the help of intuitive visualization, which aids you drill-down at a packet or port level with Motadata ObserveOps. This helps you bifurcate traffic with respect to specific user, network, or an interface.
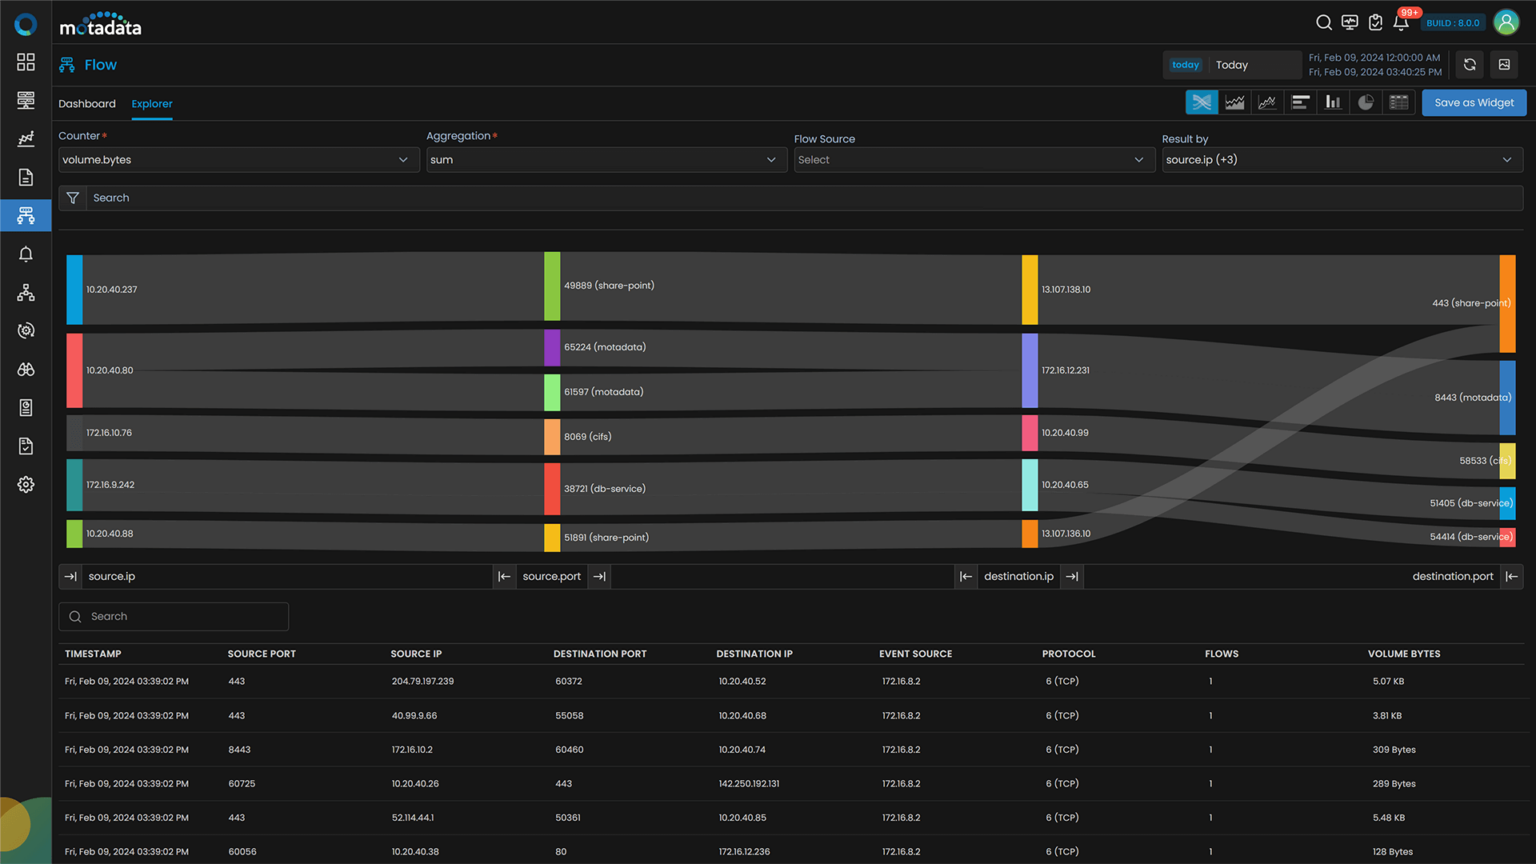
The abnormal high traffic can not only be discovered but can be troubleshooted as well. Get detailed traffic analysis with Motadata ObserveOps and know the users or applications utilizing bandwidth the most.
Discover Problematic Router
Identify the problematic behaviours such as sudden spikes, unusual router traffic with Motadata ObserveOps, and get root cause analysis of such routers. It also lets you execute SNMP Monitoring and get SNMP trap messages to perform actions and secure your network.
You can get the advance L3 level topology with the help of native support for the BGP, ISIS, OSPF protocol. The topology gives you a holistic view of all the networking devices and their status and performance. You can even gain complete visibility across your network and track the outages to the hop level.
Monitor Key Performance Metrics with Motadata ObserveOps
Numerous activities in the network concern the router every second, and every activity can impact the network performance and operations, causing inevitable damage. Motadata ObserveOps can help you track key performance metrics impacting router activities.
List of KPIs for router monitoring:
Sr. No. | Counter | Description |
|---|---|---|
1. | Average latency (in milliseconds) observed during ping | |
2. | network.connection.tcp.connections | Number of TCP connections |
3. | network.connection.udp.connections | Number of UDP connections |
4. | network.connection.tcp.retransmitted.segments | Number of TCP retransmitted segments |
5. | network.connection.protocol | Protocol used for network connection |
6. | interface.packets | Number of packets on the interface |
7. | interface.error.packets | Number of error packets on the interface |
8. | system.cpu.percent | CPU usage percentage |
9. | system.memory.used.percent | Memory usage percentage |
10. | active.sessions | Active sessions |
11. | interface.speed.bytes.per.sec | Speed of data transfer in bytes per second |
12. | interface.traffic.utilization.percent | Percentage of interface bandwidth being used |
13. | interface.traffic.bytes.per.sec | Total traffic on the interface in bytes per second |
14. | interface.out.traffic.utilization.percent | Percentage of outbound traffic bandwidth used |
15. | interface.in.traffic.utilization.percent | Percentage of inbound traffic bandwidth used |
Motadata ObserveOps helps you identify the unusual patterns in your router behavior and logs the incidents as events. You can even list the routers with such incidents that need to be upgraded or replaced.
Ready to implement Router Monitoring?
Discover how Motadata AIOps can help you monitor your infrastructure in real-time and respond to issues instantly.