What is Network Intelligence? A Guide for IT Teams
"This is the third slowdown at the regional offices this quarter. What is actually causing it, and what will it cost us to stop?" Questions phrased like that come from a business head rather than an engineer, and a dashboard screenshot will not answer them.
Most network operations groups can produce evidence that something happened. Producing an explanation of why it happened, in language a finance director will accept, takes hours of manual correlation across separate consoles. Network intelligence describes the work of shortening that distance.
The term has been in use since the mid-2000s, when telecom operators applied it to subscriber traffic profiling. What it means for enterprise IT today has moved a long way from that origin, and any capable network monitoring tool now carries part of the capability.
In this blog, you’ll see what network intelligence covers today, the telemetry it depends on, how it differs from monitoring and observability, the use cases it opens up, the metrics that show it is working, and a staged path to adopting it without disturbing what already runs.
What does Network Intelligence Mean in IT Operations?
Network intelligence is the layer that converts raw network telemetry into explanations and recommended actions. It ingests flow records, device metrics, logs, configuration state, and topology, correlates them against each other, and returns a ranked answer to an operational question instead of another set of charts.
The distinction matters commercially. A monitoring product delivers the readings and leaves interpretation to your engineers. Network intelligence solutions commit to an answer, which means they can be wrong in a way a dashboard cannot.
How the Definition Changed from Telecom to Enterprise IT
The original definition came out of the carrier world. Network intelligence meant deep packet inspection combined with packet capture and business intelligence, used to identify protocols in transit and extract metadata about who was communicating with whom. Carriers applied it to bandwidth management, traffic shaping, policy enforcement, usage-based billing, and service assurance.
That framing still appears in reference material, which is why a search for the term returns two answers that barely resemble each other. The carrier definition centers on subscriber traffic and revenue. The enterprise definition centers on availability, performance, cost, and risk inside an organization's own infrastructure.
Both share one mechanism, which is extracting meaning from traffic metadata rather than reading payloads. What changed is the question being asked of that metadata.
What Network Intelligence Covers Today
A working enterprise definition has three parts:
Correlation across domains: Flow, metric, log, configuration, and topology data are joined into a single timeline for any given incident.
Explanation over detection: The output names a probable cause and shows the evidence behind it, with some indication of confidence.
Recommended or executed action: Findings feed a runbook, a ticket, or a change proposal, so the finding leads somewhere.
An intelligent network, on this reading, is one where the operating layer above the hardware can answer questions without a specialist translating between consoles.
How is Network Intelligence Different from Network Monitoring and Observability?
Network intelligence differs from monitoring and observability in what it hands back to the operator. Monitoring reports state against thresholds. Observability lets you interrogate the system freely, and network intelligence proposes the answer along with the next step.
The three build on each other, so this is a progression rather than a set of competing choices. Our breakdown of observability versus monitoring covers the first two in more depth.
Dimension | Network Monitoring | Network Observability | Network Intelligence |
Question it answers | Is it up, and is it within the threshold? | Why is it behaving this way, if I know what to ask? | What broke, why, and what should happen next? |
Data model | Polled metrics and alarms | Full-fidelity telemetry, queryable on demand | Correlated telemetry plus topology and business context |
Typical output | Dashboards and threshold alerts | Ad hoc queries and exploratory views | Ranked findings, forecasts, recommended actions |
Skill required to use | Operator | Domain specialist | Any engineer on the rota |
Common failure mode | Alert volume nobody can triage | Powerful queries nobody has time to write | Confident answers built on incomplete telemetry |
How is Network Intelligence Different from AIOps?
Network intelligence differs from AIOps in scope rather than in method. AIOps applies machine learning across the whole IT operations signal set, covering servers, applications, databases, and services alongside the network. Network intelligence narrows the field to network telemetry and reasons using network primitives such as routing state, path, interface behavior, and device configuration.
That narrowing is what makes the difference in practice. A general correlation engine can group forty alerts from one regional circuit into a single incident, and it will usually stop there. A network-aware engine goes on to name the circuit, the carrier, and the change that preceded the degradation, because it understands what those objects are.
The two overlap heavily in the market, and several platforms now sell both. Our comparison of AIOps and observability covers where the categories converge.
What Data does Network Intelligence Run On?
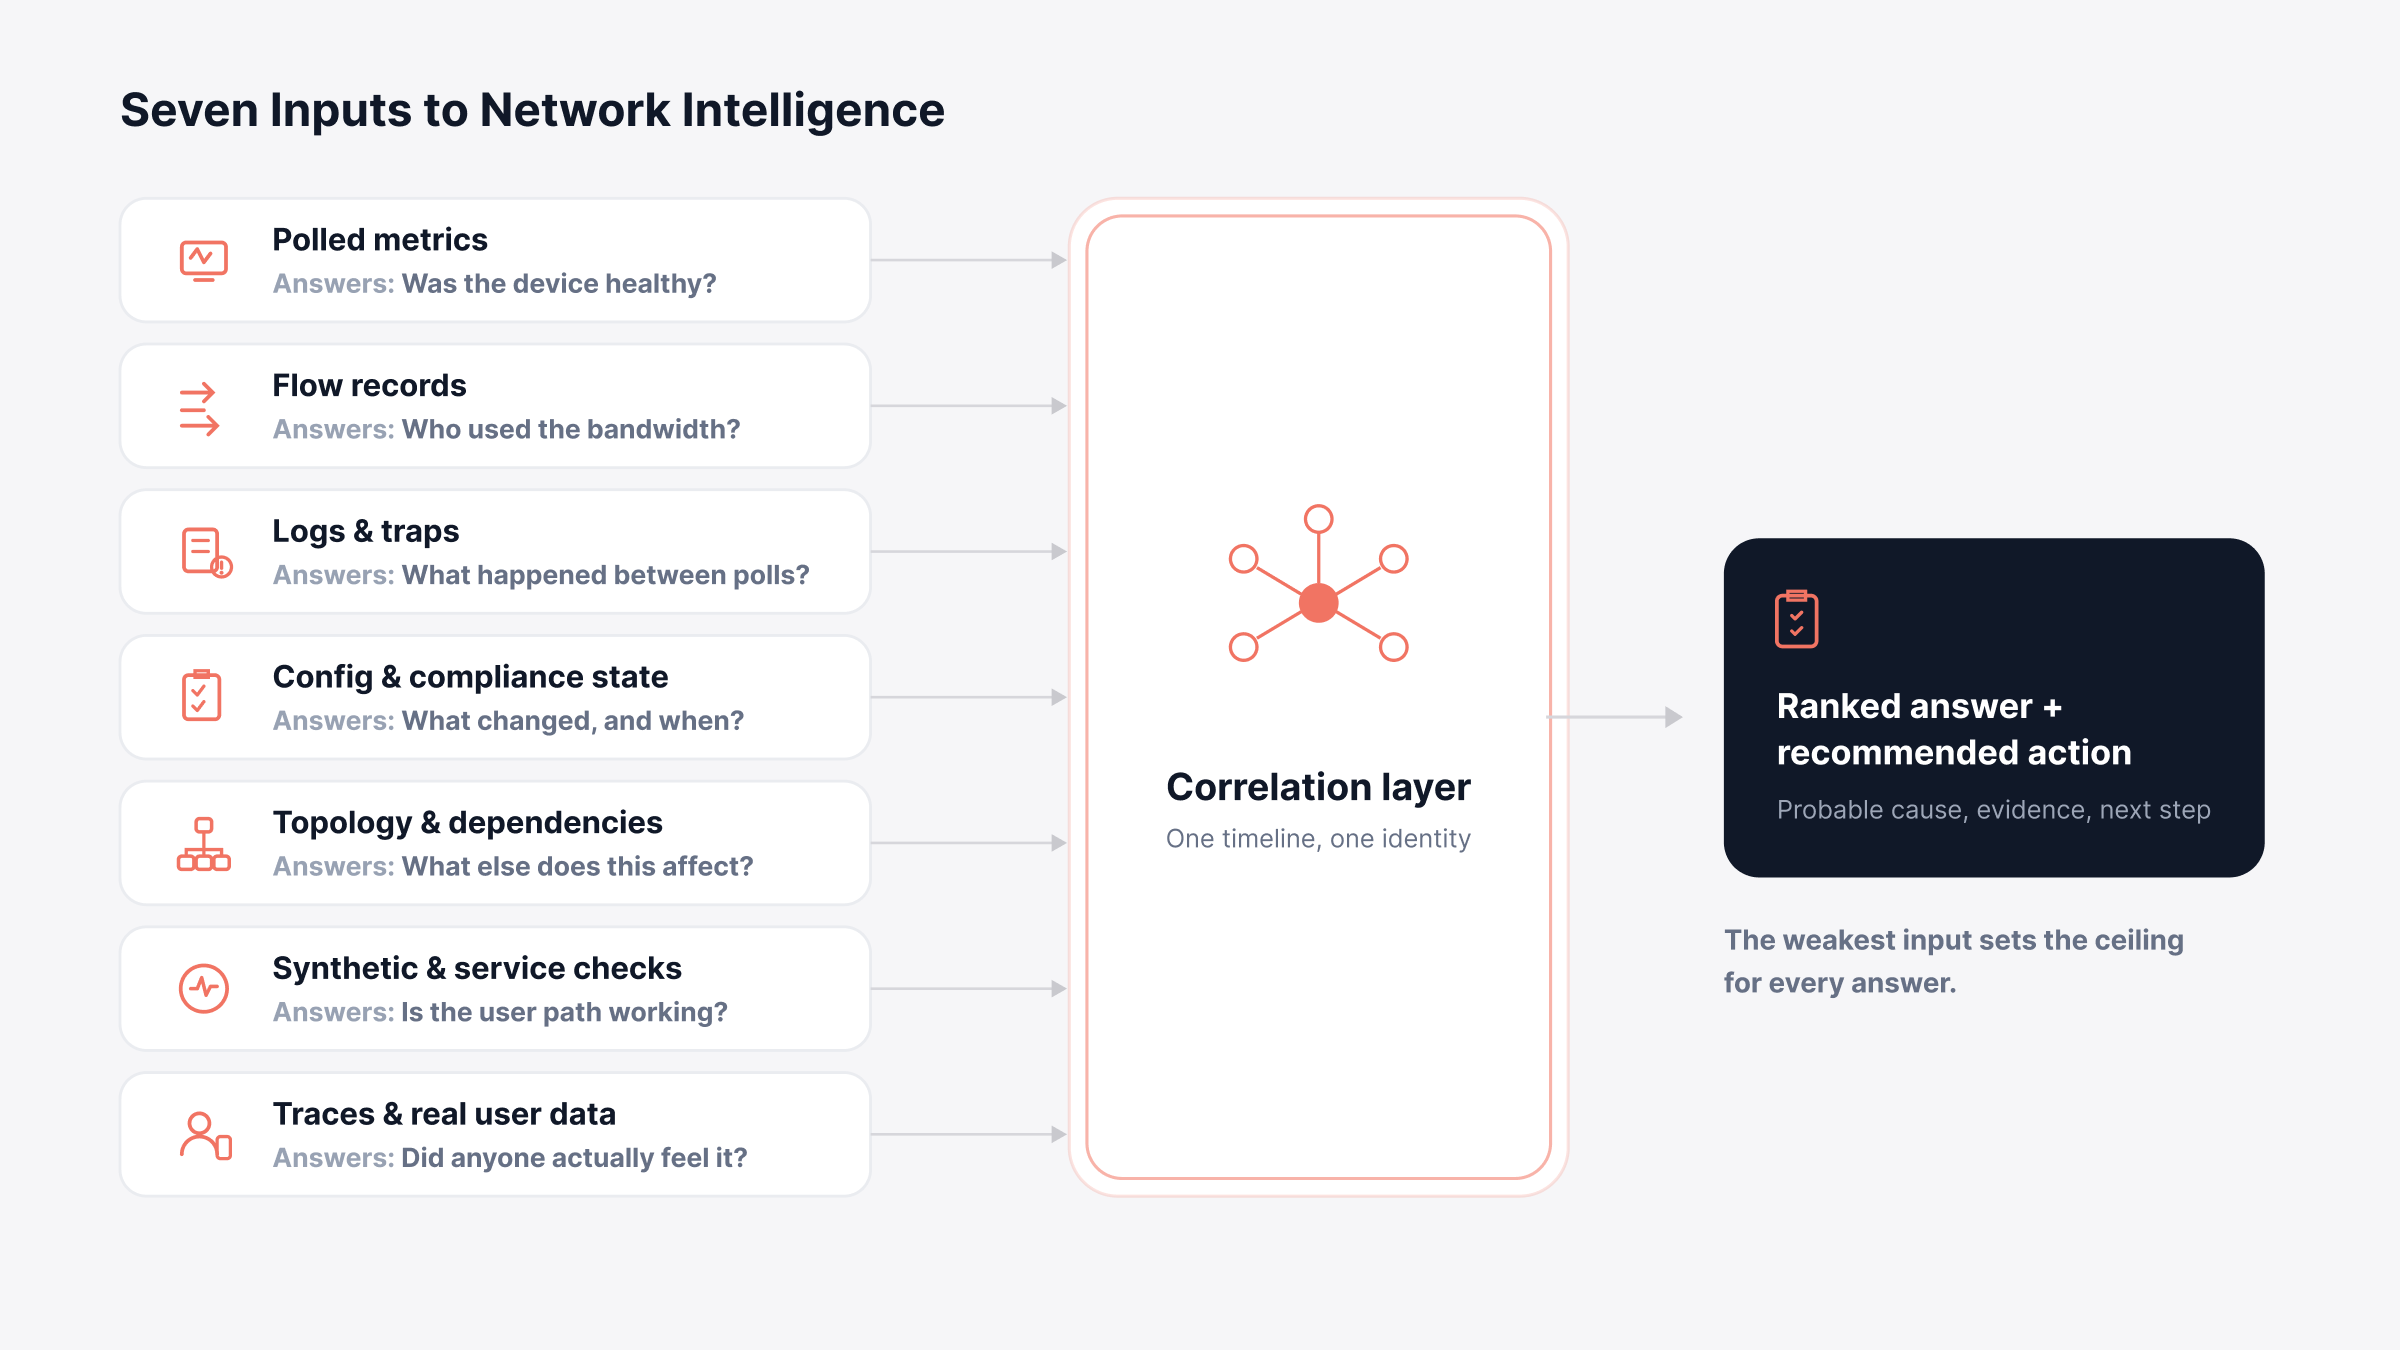
Network intelligence runs on seven telemetry sources, and its answers are only as good as the weakest one. Each source answers a question the others cannot, which is why single-source products struggle to move past detection. The seven are set out below in roughly the order most environments already collect them, starting with the one almost every network already produces.
1. Polled Metrics
Simple Network Management Protocol polling and agent-based collection produce interface counters, CPU, memory, error rates, and availability. SNMP is the baseline layer that establishes whether a device or link is healthy at a given moment. Polling intervals set the resolution ceiling, so a five-minute poll will never reveal a thirty-second microburst.
2. Flow Records
NetFlow, sFlow, jFlow, and IP Flow Information Export records describe conversations: source, destination, port, protocol, bytes, and duration. Network flow analysis answers who consumed the bandwidth and where the traffic went. Sampled flow trades fidelity for scale, so record the sampling rate alongside any conclusion drawn from it.
3. Logs and Events
Syslog, SNMP traps, and device event streams capture what happened between polls. A link flap, an authentication failure, or a routing session reset appears here first. Passive trap collection catches events that scheduled polling would miss entirely.
4. Configuration and Compliance State
Device configurations and their change history explain a large share of incidents that metrics alone cannot. Network configuration management supplies version history, drift detection, and compliance assessment against standards such as CIS, HIPAA, and SOX. When performance degrades an hour after a change window closes, this is the source that says so.
5. Topology and Dependency Data
Network topology records what connects to what, and dependency mapping records what relies on what. Without it, correlation produces coincidences rather than causes. A discovered, auto-refreshed map beats an accurate diagram drawn last year.
6. Synthetic and Service Checks
Scheduled ping, port, DNS, HTTP, and certificate checks measure the path a user actually traverses. They fill the gap between device health and service health. They also supply internet intelligence about segments outside your administrative control, such as ISP paths and SaaS endpoints.
7. Application Traces and Real User Data
Traces and real user measurements show whether a network condition reached the user at all. This separates a genuine incident from an interesting graph. It also settles the recurring argument over whether the network or the application caused a slowdown.
Audit which of these seven you already collect before evaluating any platform, because most environments already produce five or six of them without knowing it.
Why are IT Operations Adopting Network Intelligence Now?
Network intelligence has climbed the priority list because network faults now carry a directly measurable cost, and the environments producing them have outgrown manual correlation. Five pressures are doing most of the work.
Outage economics has hardened: Uptime Institute found in its Annual Outage Analysis 2026 that 57% of respondents said their most recent major outage cost more than $100,000, and that for the second consecutive year one in five reported costs above $1 million.
Connectivity failures last longer: The same report notes that outages linked to fiber and connectivity issues are rising, and that they are more likely to produce extended disruption.
Complexity generates its own faults: Uptime Institute's 2025 analysis put IT and networking issues at 23% of impactful outages during 2024, attributing the rise to growing complexity and the change management and misconfiguration problems that follow it.
Overlay layers hide the physical path: SD-WAN, or software-defined wide area network, builds an encrypted tunnel mesh above the carrier circuits, and a tunnel can report itself healthy while the circuit beneath it drops traffic.
Expertise is concentrated in too few people: Reading flow data alongside routing state and configuration history is a specialist skill, and the specialists are already committed elsewhere.
Traffic patterns have shifted underneath all of this as well. The AI networks now being built for model training and inference move data in sustained bursts that baselines calibrated on office traffic never anticipated.
The common response has been to add tools, which multiplies consoles without improving answers. AI network monitoring moves correlation off the human and onto the platform.
How does Network Intelligence Work, Step by Step?
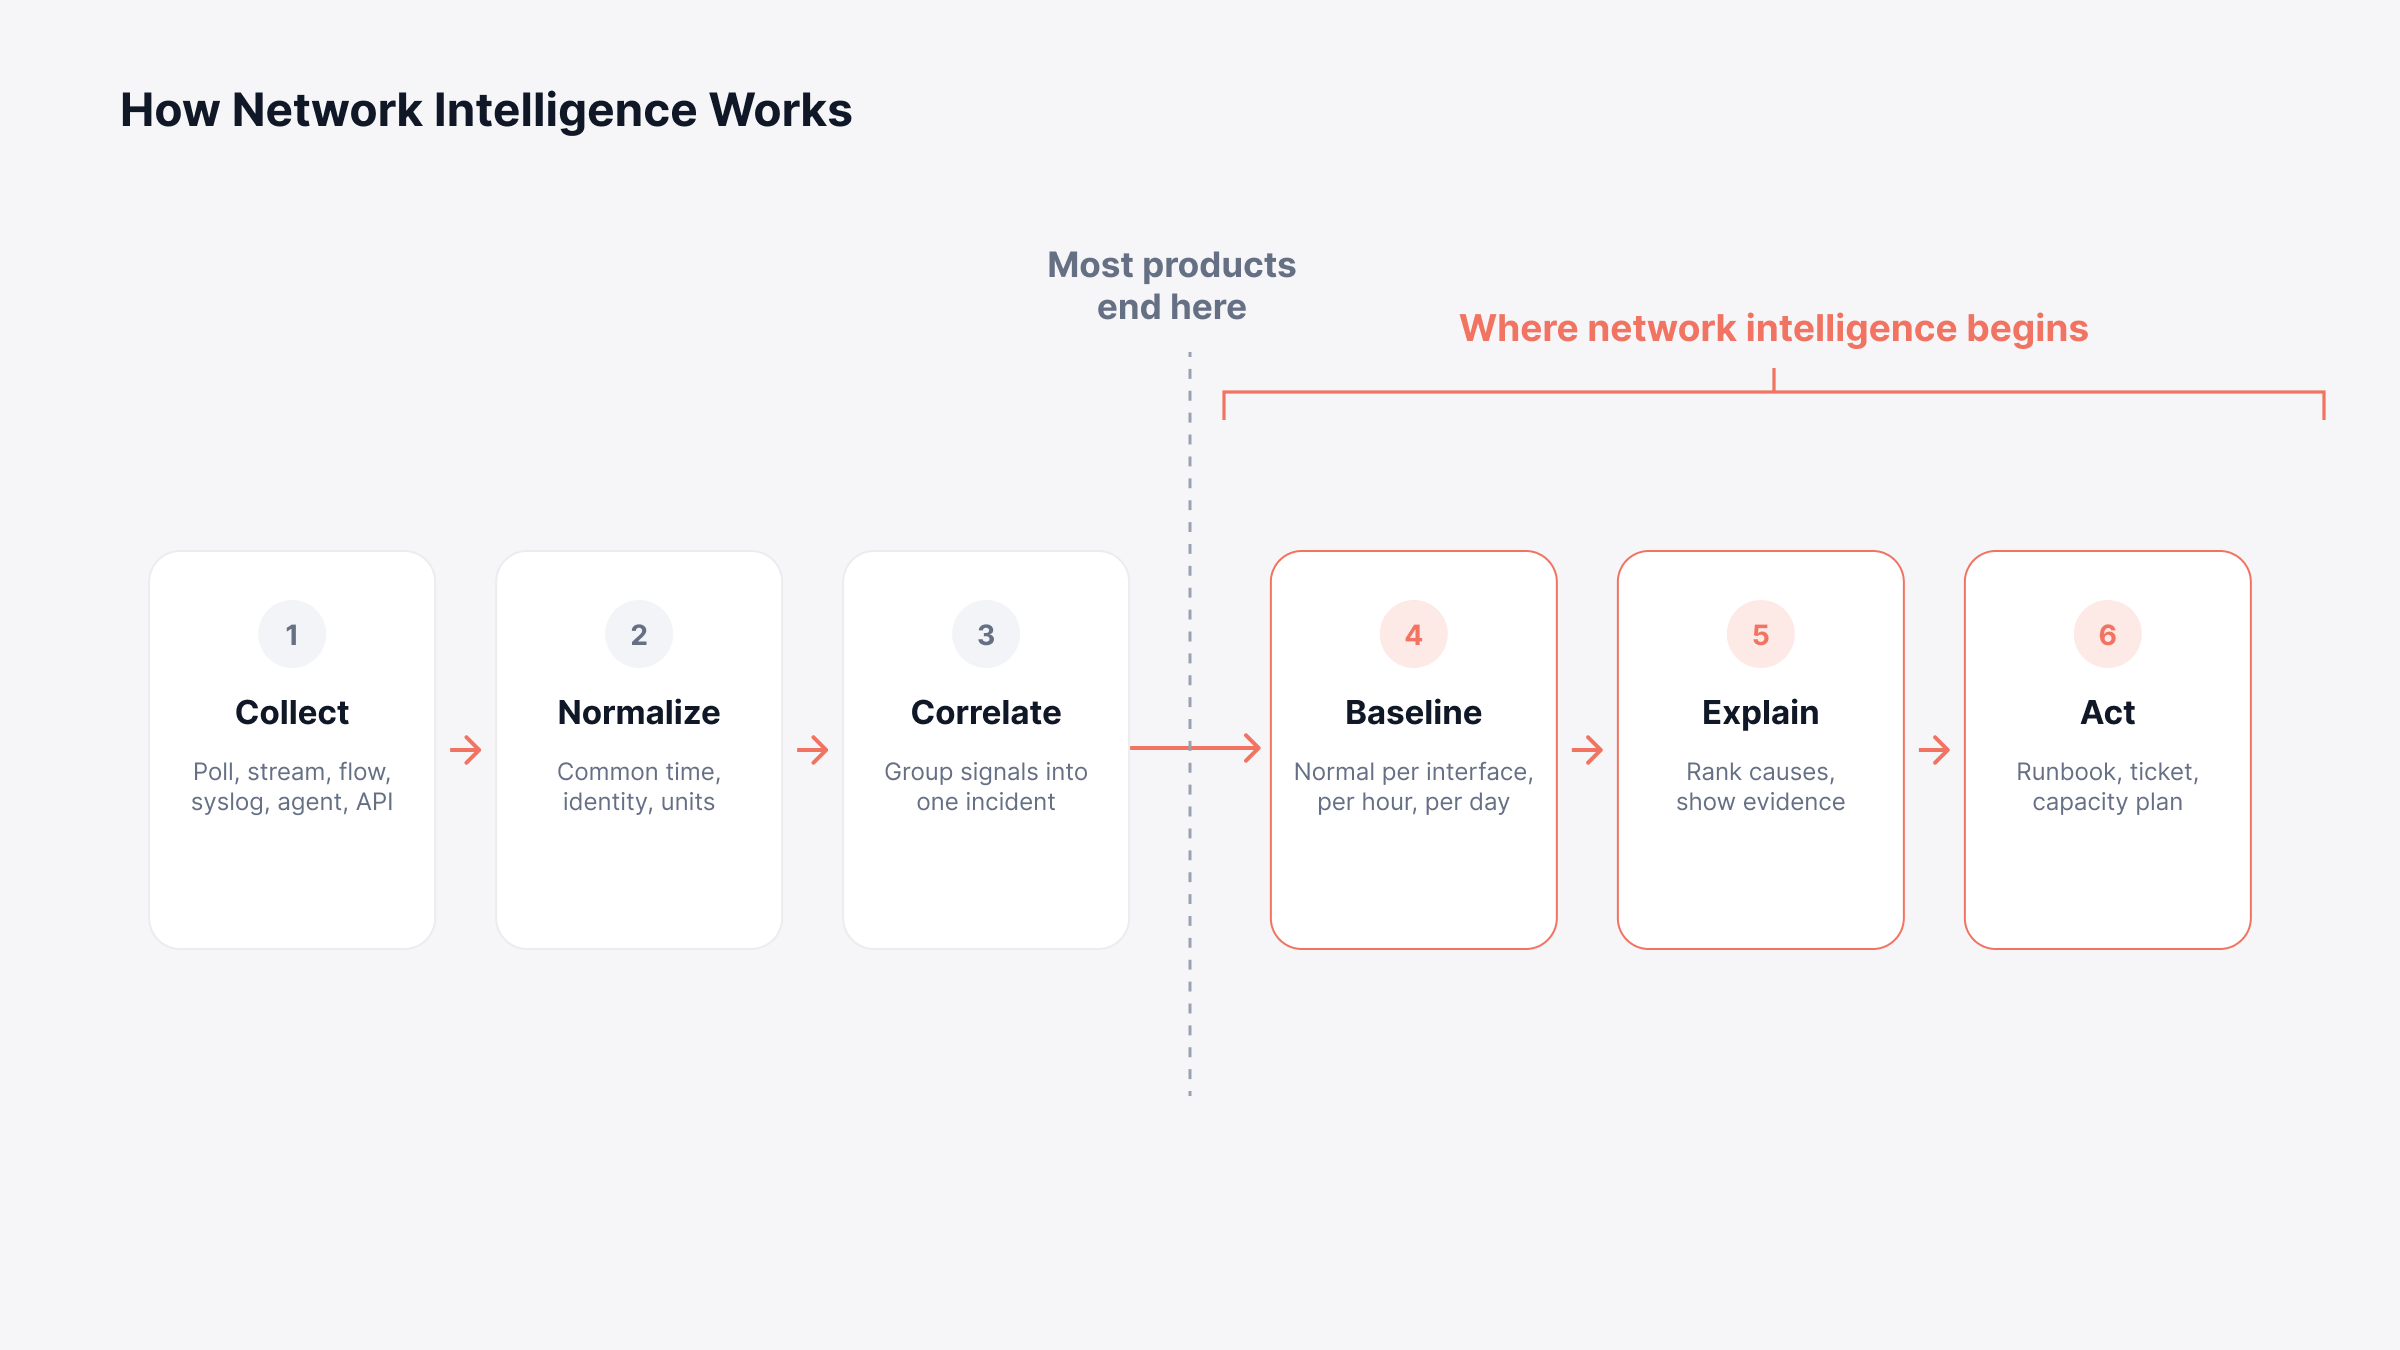
Network intelligence works through six stages that run continuously rather than on demand. The sequence matters when evaluating vendors, because most products are strong across the first three and thin across the last three.
Collect: Telemetry arrives by polling, streaming, flow export, syslog, agent, and API, across on-premises, cloud, and hybrid segments.
Normalize: Sources are converted to common time bases, identities, and units, so a switch interface and a cloud gateway become comparable.
Correlate: Event correlation groups related signals into one incident using topology and dependency relationships.
Baseline: Historical behavior establishes what normal looks like per interface, per hour, per day, which is what makes anomaly detection usable in production.
Explain: The platform ranks probable causes and presents the evidence, including recent configuration changes and affected dependency paths.
Act: Findings trigger a runbook, open a ticket, or feed a capacity plan.
Stages four through six are where products separate from one another. Anything that stops at stage three is an alerting engine with better grouping.
What are the Use Cases for Network Intelligence?
Network intelligence use cases share one trait: each needs at least three telemetry sources joined together before it produces anything useful. Six of them recur across enterprise deployments, and each is listed with the data it depends on.
Root cause analysis that names the change, the interface, and the dependency path removes the bridge call spent deciding which domain owns the problem.
It draws on topology, configuration history, and interface counters read on one clock. The output an engineer needs is a short ranked list with the evidence attached, so the finding can be checked rather than taken on trust.
Capacity forecasting on observed growth:
Trend projection against actual utilization identifies which circuits and interfaces reach saturation over the next two quarters, well before procurement lead times force a rushed decision.
Historical interface counters and flow volumes supply the curve, and business calendars supply the seasonality. A forecast that names a date and a confidence range is what turns a capacity discussion into a budget line.
Configuration drift detection:
Comparing running configurations against a known-good baseline surfaces the unauthorized change behind the intermittent fault nobody could reproduce.
Version history, syslog change events, and performance data have to be aligned on the same timeline for this to work. The same comparison feeds network compliance reporting against CIS, HIPAA, and SOX without a separate audit exercise.
Traffic and cost attribution:
Flow analysis mapped to applications and business units answers which workload consumed the expensive link, which is the question finance actually asks.
Flow records supply the conversations, and asset ownership data supplies the attribution. Without the second half, the report names IP addresses that mean nothing to a budget holder.
Security signal from network behavior:
Sudden protocol changes, unusual destination sets, and lateral movement patterns appear in flow and log data before they surface in a security alert.
Behavioural baselines make this workable, since a fixed rule cannot describe what normal looks like for four hundred subnets. Findings here belong in a SIEM rather than a network console, and an insider threat investigation frequently starts from exactly this data.
Digital experience measurement:
Synthetic checks combined with real user data show whether an internal service degraded for one office or for everyone, which decides who gets paged.
End user experience monitoring supplies the user-side view, and path measurements supply the network-side view. Running both stops a support queue filling with tickets that read "network slow" and carry no evidence.
Each of these depends on context that the network itself does not carry. Business service mapping, asset ownership, and change records all have to be present and current for the answers to be worth acting on.
Where Network Intelligence Applications Differ by Industry
Network intelligence applications follow the shape of the network underneath them, so the same platform gets used very differently across sectors. Five patterns account for most enterprise deployments.
Banking and financial services: Branch connectivity, regulatory reporting, and transaction path assurance dominate. Network monitoring for BFSI usually runs on-premises, because telemetry from payment segments cannot leave the organization.
Telecom and service providers: Subscriber-facing quality, peering behavior, and capacity across shared access networks. This is closest to the original carrier definition, and AIOps in telecom covers the scale involved.
Government and public sector: Multi-site deployments with air-gapped segments, long asset lifecycles, and audit obligations that outlast any single vendor contract.
Healthcare: Clinical systems where latency and packet loss carry patient safety implications, alongside medical devices that cannot be patched on a normal cycle.
Manufacturing and retail: Distributed sites with thin local IT presence, where a degrading circuit at one plant or store has to be identified centrally before anyone on site notices.
What are the Benefits of Network Intelligence?
The benefits of network intelligence show up in outage duration, in how many engineers get pulled into each escalation, and in the quality of evidence you can put in front of someone who is disputing a bill. Five outcomes justify the spend.
Outages end sooner and cost less: Shortening the diagnostic phase moves the whole incident timeline, and the cost of network downtime scales with the clock more than with the severity of the fault.
Escalations consume fewer people: A finding that arrives with evidence attached removes the four-domain bridge call convened purely to establish ownership, which frees senior engineers for work that only they can do.
Spending moves from urgent to planned: Knowing which link saturates in November means the circuit gets ordered at contract rates in August instead of at emergency rates in October.
Evidence survives a dispute: An independent record of loss and delay on a carrier circuit, timestamped and held outside the provider's own console, is what settles a service credit claim or an audit finding.
Expertise reaches more of the on-call rotation: A junior engineer working from a ranked finding closes incidents that previously waited for the one person who could read flow data unaided.
Those outcomes arrive in that order rather than together. Detection and diagnosis improve within the first quarter, while the planning and commercial gains need two or three quarters of history before the platform can forecast anything worth acting on.
Which Metrics Show Network Intelligence is Working?
Network intelligence should move a specific set of network metrics within two quarters of going live. Capture the baseline before deployment, because a baseline reconstructed afterwards produces numbers nobody trusts. The targets below are practical starting points to calibrate against your own environment rather than published benchmarks.
Mean time to detect: MTTD should fall as anomaly detection replaces static thresholds. Track it alongside false positive rate, since a lower detection time achieved by alerting on everything is worth nothing. Target: Under 5 minutes for availability faults, under 15 for performance degradation
Mean time to identify: The interval between an alert firing and the responsible domain being named. Correlation pays for itself here, and this is frequently the largest single block of time inside an incident. Target: Under 20 minutes, and falling quarter on quarter
Mean time to resolve: The end-to-end figure the business actually sees. It moves later than mean time to identify and by a smaller margin, because repair time depends on factors outside the platform. Target: A 20% to 30% reduction against your own pre-deployment baseline within two quarters
Alert-to-incident ratio: How many alerts it takes to produce one genuine incident. A ratio moving from hundreds-to-one toward tens-to-one indicates correlation is doing its job. Target: Below 20 alerts per genuine incident
Forecast accuracy: Compare predicted saturation dates against what actually happened. Accuracy below roughly 70% usually means the baselining window is too short or the underlying data too sparse. Target: 70% or better on saturation dates projected one quarter ahead
Change-related incident share: The proportion of incidents traced back to a configuration change. Drift detection should push this down steadily over the first two quarters. Target: Below 15% of all incidents
What Should you Look for in Network Intelligence Solutions?
Evaluating network intelligence tools comes down to whether the platform can ingest what you already produce and defend the conclusions it draws from it. Six criteria separate the field.
Telemetry breadth: Native support for polled metrics, flow in multiple formats, syslog, traps, configuration state, topology, synthetics, and traces, without a bolt-on collector for each one.
Correlation you can inspect: The platform should show which signals produced a finding and allow an engineer to disagree with it.
Baselining without a long warm-up: Ask how many weeks of data are needed before anomaly detection becomes trustworthy, and whether that clock restarts after a topology change.
Deployment mode: On-premises, multi-site collector, high availability, and disaster recovery options matter for banking, telecom, government, and healthcare. A large share of platforms in this category are cloud-only.
Action integration: Runbook execution and native ITSM ticket creation, so a finding becomes scheduled work rather than a notification.
Data retention and cost model: Full-fidelity retention is expensive. Understand what gets rolled up, at what age, and what that removes from future investigations.
Every vendor will answer yes to all six criteria in a first call. The table below gives the question that forces a specific answer, what an answer worth accepting sounds like, and the reply that should stop the evaluation.
What to test | Question that forces a specific answer | Answer worth accepting | Answer that should worry you |
Telemetry breadth | Which of the seven sources do you collect natively, and which need a separate collector? | A named count with the gaps admitted, such as five native and flow through a collector | We support everything |
Inspectable correlation | Open this finding and show me the individual signals behind it | Drills into the contributing signals on screen, each with a timestamp and source | The model determined it |
Baseline warm-up | How many weeks of data before an anomaly alert is trustworthy, and does that clock restart after a topology change? | A figure in weeks, usually two to four, plus a direct answer on restarts | It learns as you go |
Deployment mode | Can this run on-premises with no outbound connection, and who runs it that way today? | Yes, with a named reference customer in a comparable industry | Cloud is more secure anyway |
Action integration | Create a ticket from this finding now, while I watch | A ticket appears in your own service desk with the fields already populated | That is on the roadmap |
Retention and cost | What is rolled up at 30, 90, and 365 days, and which investigations stop being possible? | Exact intervals per data type, and a straight answer on what you lose | Storage is unlimited |
Run all six during the proof of concept rather than after the contract is signed, since every one of them is far harder to renegotiate later.
How do you Adopt Network Intelligence in Stages?
Network intelligence adoption works in four stages, each producing value on its own. Attempting all four at once is the most common reason these projects stall in month three.
Consolidate collection: Bring metrics, flow, logs, and traps into one store before switching on any analytics. Most environments discover at this point that two or three sources were misconfigured years ago.
Add topology and ownership: Load discovered topology, dependency relationships, business service mapping, and change records. Correlation quality depends more on this stage than on the algorithm behind it.
Enable correlation and baselining: Run in advisory mode first, comparing platform findings against what engineers concluded independently. Keep a score for six to eight weeks before trusting the output.
Automate the routine: Once findings hold up, connect them to runbooks and ticket creation for the incident types that repeat every month.
Proactive network monitoring practices carry directly into stages three and four, so existing runbooks rarely need rewriting.
What are the Limits of Network Intelligence?
The limits of network intelligence are telemetry resolution, encryption, data currency, and retention cost. All four are worth establishing during a proof of concept, because each one quietly narrows what the analytics layer can conclude.
Resolution sets a hard ceiling: No correlation engine recovers details that sampling has already discarded. Flow sampled at one packet in ten thousand will not explain a microburst, and a five-minute polling interval will not surface a thirty-second network congestion event.
Encryption removes application context: Payload-level classification has been shrinking for a decade as traffic moved to encrypted transport. Behavioral classification using packet timing and volume patterns fills part of that gap, at lower confidence than reading the content directly.
Stale context degrades correlation silently: A dependency map or ownership record that stopped being accurate six months ago still produces findings, and those findings are wrong in ways that look plausible. This failure mode is harder to spot than an outright gap.
Full-fidelity retention is expensive: Roll-up policies decide which investigations remain possible a year from now. Establish what gets aggregated at 30, 90, and 365 days before the first invoice, since the decision is difficult to reverse afterwards.
Translate Scattered Network Telemetry Into Answers with Motadata ObserveOps
Correlation across domains is a claim every platform in this category now makes, so it has stopped separating them. The narrower question is which sources a platform collects natively, and what happens to its conclusions when one of them is missing.
Motadata ObserveOps runs metrics, logs, flows, traces, and topology on one platform, with configuration and compliance management inside the same product. Change history therefore reaches correlation instead of being held in a separate console, and the DFIT framework applies dependency mapping, anomaly detection, forecasting, and alert correlation across everything ingested.
Six deployment modes run from single-box through to high availability over WAN, which is often the deciding factor for banking, telecom, government, and healthcare organizations that cannot send network telemetry to a shared cloud. Native integration with Motadata ServiceOps then carries a finding through to a ticket.
FAQs
What is network intelligence in simple terms?
Network intelligence is software that reads all the data your network already produces and tells you what is wrong and what to do about it. Network intelligence in networking terms means joining flow records, device metrics, logs, configuration history, and topology into one explanation rather than five separate views.
Is network intelligence the same as AIOps?
They overlap but are scoped differently. AIOps applies machine learning across the whole IT operations signal set, including servers, applications, and services, while network intelligence focuses on network telemetry and network-specific context such as routing state, interface behavior, and device configuration.
What is the difference between network intelligence and network observability?
Network observability gives you the ability to ask any question of your network data and get an accurate answer back. Network intelligence goes a step further by identifying which questions matter, answering them without being asked, and recommending the action that follows.
What telemetry does a network intelligence platform need?
At minimum it needs polled device metrics, flow records, and logs or traps. Adding configuration state, topology and dependency data, synthetic checks, and application traces raises the accuracy of every conclusion the platform draws, because correlation improves with each independent source.
Can network intelligence run on-premises?
Yes, though many products in the category are offered as cloud-only services. Regulated industries such as banking, telecom, and government generally require on-premises or multi-site collector deployment with high availability and disaster recovery, so confirm deployment options early in any evaluation.
Author
Poonam Lalani
Content Strategist
Poonam Lalani is a B2B content strategist and writer with a background in computer engineering and experience across enterprise technology domains, including AI, cloud, DevOps, data engineering, and IT operations. She specializes in creating research-driven content that simplifies complex ideas and supports product education, thought leadership, and business growth.