How to Use the Netstat Command to Find Open Ports and Fix Issues Faster
Why would a service refuse to start when nothing seems to be running on its port? Or why is an application running slowly when its CPU and memory graphs look healthy? Look at the server's open connections with the netstat command and you'll usually find out why.
Type netstat on a server and it lists two things right away: The ports it's listening on, and the remote systems it's talking to. It also names the program behind each connection. Windows and macOS ship with it, though plenty of Linux distributions stopped including it once newer tools took its place.
Engineers tend to type it within the first few minutes of an incident, which makes it a natural opening move in any network troubleshooting workflow. What takes practice is reading the output and knowing when another tool will answer faster. In this blog, you will see:
Syntax: The netstat commands that matter on Windows, Linux and macOS
Interpretation: What every column and TCP state in the output means
Port checks: How to find the program holding a specific port
Replacements: Which commands replace netstat in Linux and PowerShell
Scale: Where single-host checks stop being enough for the business
What is the Netstat Command Used For?
The netstat command, whose name is short for network statistics, is a built-in command-line tool that lists the open connections and listening ports on a machine. Put plainly, the answer to what does the netstat command do (or just what does netstat do) is visibility: You see who a host is talking to over core network protocols such as TCP and UDP, and which ports it has open.
Depending on the options you add, netstat can show you:
Active connections: Local and remote IP addresses, ports and the current connection state
Listening ports: Every TCP and UDP port the machine is waiting for traffic on
Owning programs: The process ID, and on some systems the program name, behind each connection
Routing table: The routes the operating system uses to forward traffic
Interface and protocol counters: Packets, errors, discards and resent data
Ask a few colleagues what is netstat command used for, or what does netstat command do in practice, and you'll hear about very different jobs. Some only want proof that a web server is taking traffic on port 443. A security analyst reads the same output looking for an outbound connection nobody expected.
Which Operating Systems Include Netstat?
Where netstat is available depends on the operating system, so check this before anyone writes it into a runbook:
Windows: Built into every current desktop and server release, and it runs in both Command Prompt and PowerShell
macOS: Built in, with BSD-style options that differ from the Linux version in a few important places
Linux: Part of the net-tools package, which many current distributions treat as legacy and leave out of default installs
Unix: Systems such as AIX and Solaris ship their own versions with similar core options
First, though, it's worth asking why any of this matters outside the server room.
Why does Netstat Matter Beyond the Command Line?
The netstat command matters beyond the command line because what it finds on a server rarely stays a server problem for long. A port conflict holds up a release, and a slow connection leak drags down the app customers rely on. Engineers look at a socket; leadership sees a missed launch date or an outage report.
Here is how those findings show up on the business side:
Delayed releases: A port already taken by an old process can stop a deployment and hold up a fix customers are waiting for
Slower customer experience: Connection leaks degrade response times gradually, so revenue-facing applications suffer before anyone links the cause to a server
Longer outages: Every minute spent working out which program owns a port adds to overall resolution time
Security and audit exposure: An unapproved listening port widens the attack surface and tends to surface later as an audit finding
Seen this way, connection visibility is a cost and risk question for IT leaders, and a daily task for engineers. It ties straight back to what network downtime costs the organization. So the next step is learning to read netstat output correctly.
How do You Read Netstat Output Line by Line?
The netstat command prints one row per socket, and a socket is one end of a network connection, made up of an IP address and a port. Every column answers a specific question about that connection. Windows and Linux share the core fields, as the table below shows with placeholder addresses:
Column | Example value | What it tells you |
Proto | TCP | Whether the connection uses TCP or UDP |
Recv-Q (Linux and macOS) | 0 | Data received that the application has not read yet |
Send-Q (Linux and macOS) | 0 | Data sent that the remote host has not confirmed |
Local Address | 10.0.0.10:443 | The IP address and port on this machine |
Foreign Address | 198.51.100.7:52114 | The IP address and port at the other end |
State | ESTABLISHED | Where the TCP connection is in its lifecycle |
PID or PID/Program name | 1187/nginx | The process ID, a number the system gives each running program |
Watch for a Recv-Q value that keeps climbing on an open connection. It usually means the application isn't reading data fast enough, which is an application problem that looks like a network one. Once the columns make sense, learning how to use netstat command options on each platform gets much easier.
What do the Local and Foreign Address Columns Tell You?
The local and foreign address columns tell you who can reach a service and who it's talking to. That's usually what a port check is trying to find out. A few patterns come up again and again:
0.0.0.0:22 or [::]:22: The service accepts connections on every IPv4 or IPv6 interface
127.0.0.1:3306: The service only accepts connections from the machine itself
10.0.0.10:443: The service is bound to one specific network interface
: or 0.0.0.0:0 as the foreign address: A listening or UDP socket with no single remote peer
There is one caveat here. The foreign address shows the last device your server can see, so if traffic passes through a load balancer or NAT gateway, you'll see that device's address in place of the end user's.
What does Each TCP Connection State Mean in Netstat?
Each TCP connection state in netstat marks one step in how two hosts open and close a connection. That makes the State column the place most diagnoses start, and the states themselves follow the TCP flags the hosts exchange. The table lists the states that turn up most, with the point at which each one deserves a closer look:
State | What is happening | When it signals a problem |
LISTEN (LISTENING on Windows) | A service is waiting for new connections | When the port you expect is missing from the list |
SYN_SENT | This host asked to connect and is waiting for a reply | When it persists, usually because something blocks the path |
SYN_RECEIVED (SYN_RECV on Linux) | A connection request arrived and is half open | When hundreds appear at once on a public service |
ESTABLISHED | The connection is open and carrying data | When the count climbs far above normal traffic levels |
CLOSE_WAIT | The remote side closed, and the local application has not | When the count keeps growing over hours |
TIME_WAIT | This host closed the connection and is waiting out stray packets | When thousands build up on a busy client or proxy |
FIN_WAIT_2 | This host closed its side and waits for the remote side | When connections stay here long after traffic stops |
Check one connection from both ends and you'll often get two different answers. The timeline below lines up both sides at each phase of one connection.
Look at where CLOSE_WAIT appears on the server row. Nothing moves it along except the application closing its own end. That's why a CLOSE_WAIT count that keeps rising almost always leads back to code.
Which Netstat Commands Should You Know on Windows?
The netstat command on Windows comes with every supported release, and you can combine its options freely; netstat -ano is the combination you'll type most. If you also want the program name, add -b and run the prompt as an administrator, in either Command Prompt or PowerShell. These are the netstat command Windows options administrators use most:
Command | What it tells you |
netstat -a | All connections plus every listening TCP and UDP port |
netstat -n | Addresses and ports as numbers, skipping slow name lookups |
netstat -ano | All connections, numeric, with the owning process ID |
netstat -anob | Adds the program name; needs an administrator prompt |
netstat -ano -p tcp | Limits the list to TCP; swap in udp for UDP |
netstat -e | Ethernet traffic totals, discards and errors |
netstat -s | Per-protocol counters for IP, ICMP, TCP and UDP |
netstat -r | The routing table, matching the route print output |
netstat -ano 5 | Repeats the output every five seconds until you press Ctrl+C |
tasklist /FI "PID eq 4321" | Names the program behind a process ID from netstat |
Two commands usually settle it. Start with netstat -ano to get the process ID, and tasklist or Task Manager's Details tab will tell you which program has it. For the rest of the machine's health, you'd look to broader Windows server monitoring.
How do You Use the Netstat Command in Linux?
The netstat command in Linux comes from the net-tools package, and its short options stack together; -tulpn is the combination you'll use most. Add sudo whenever you include -p. Skip it and the program column stays blank for any connection your own account doesn't own, which matters for most of the netstat Linux commands below:
Command | What it tells you |
sudo netstat -tulpn | TCP and UDP listening ports with program names |
netstat -tan | Every TCP connection and its state, in numeric form |
netstat -ltn | Only the TCP ports in the LISTEN state |
netstat -tanc | Refreshes the TCP list every second until stopped |
netstat -i | Packets, errors and drops for each network interface |
netstat -rn | The routing table without name lookups |
netstat -s | Protocol counters, including TCP data that had to be resent |
With the process ID in hand, ps -p 1187 -o comm= gives you the program. Its logs come next, and on systemd hosts journalctl is how you read them. Anything not covered here is in the full netstat manual page.
How is Netstat Different on macOS?
Netstat on macOS comes from BSD, which is why a few familiar Linux options do something else on a Mac. The biggest catch is -p. On a Mac it selects a protocol and won't show process IDs, so these commands cover the common tasks:
Command | What it tells you |
netstat -an -p tcp | All TCP connections and their states, in numeric form |
netstat -rn | The routing table without name lookups |
netstat -i | Packet and error counts for each interface |
sudo lsof -nP -iTCP -sTCP:LISTEN | Listening TCP ports with the owning program |
For matching a port to a program, use lsof, which comes with macOS. Most people open netstat for exactly that port-to-program lookup.
How do You Check a Port with Netstat?
To learn how to check a port with netstat, start with the Local Address column of the listening ports; the number after the colon is the port. Found it with a LISTEN state? A program owns it and the process ID names it; if the port is missing, nothing on that machine is accepting connections there.
On a busy server, netstat listening ports output can run to hundreds of lines. A command that filters for a single port is quicker. For a typical case, here's how to check if port 8080 is open, platform by platform:
Platform | Command | What it tells you |
Windows | netstat -ano -p tcp | TCP connections with process IDs; look for :8080 |
Windows PowerShell | Get-NetTCPConnection -LocalPort 8080 | The state and owning process ID for port 8080 |
Windows PowerShell | Test-NetConnection 10.0.0.10 -Port 8080 | Whether a remote host answers on port 8080 |
Linux | sudo netstat -tlnp | Listening TCP ports with programs; look for :8080 |
Linux | sudo ss -ltnp 'sport = :8080' | Only the program listening on port 8080 |
macOS | sudo lsof -nP -iTCP:8080 -sTCP:LISTEN | The program listening on port 8080, if there is one |
A local check and a remote check answer two separate questions. Netstat tells you whether this machine is listening. Run Test-NetConnection from a different machine and you'll know whether traffic makes it past each firewall along the route.
It's possible for a service to be listening while users still can't reach it, so do both before closing the ticket. The diagram below marks which part of the path each check actually covers.
Consider a deployment that fails on a Linux host. The new build of an internal API exits on startup with "address already in use," and sudo netstat -tlnp shows why: An older Java process that never shut down cleanly is still holding port 8080. Stopping that process fixes today's release, and a clean shutdown step in the pipeline keeps it from happening again.
How do You Use Netstat to Troubleshoot Common Connection Problems?
The netstat command helps troubleshoot connection problems by counting connections per state and naming the program behind them. Read those counts over a few minutes and patterns appear. Four of them account for most production issues.
Why are Connections Piling Up in CLOSE_WAIT?
Connections pile up in CLOSE_WAIT when the client has hung up but your application hasn't. Each of those stuck connections ties up resources, and eventually the program can't take on new work. You can list them with ss -tan state close-wait on Linux, or Get-NetTCPConnection -State CloseWait on Windows.
Here's how that looks in practice. Say a payments API slows down every afternoon. Netstat on its servers finds thousands of CLOSE_WAIT connections, all from a database client that never releases them, and a small code fix does what months of weekly restarts couldn't.
What do Thousands of TIME_WAIT Connections Mean?
Thousands of TIME_WAIT connections are expected on a proxy or API client, because whichever side closes first holds this state for a while. The trouble starts later. Once short-lived outbound connections use up the pool of temporary ports the system hands out, new connections fail, and these commands show how close you are:
Platform | Command | What it tells you |
Linux | ss -s | A summary count of connections, including TIME_WAIT |
Linux | sysctl net.ipv4.ip_local_port_range | The range of temporary ports for outbound connections |
Windows | netsh int ipv4 show dynamicport tcp | The temporary port range Windows assigns |
What fixes it? Most of the time, the answer is connection pooling and keep-alive settings. With fewer new connections, there's less churn to begin with, and that's a cleaner fix than tuning the operating system.
Why do Connections Stay Stuck in SYN_SENT?
Connections stay stuck in SYN_SENT whenever your server asks to connect and the reply never arrives. The usual suspect is a firewall quietly dropping the traffic. If it isn't that, the remote service may be down or misrouted, and a traceroute to the destination will show where the traffic stops.
SYN_RECEIVED is a different story. Seeing hundreds of them on a public service? That could be a sudden rush of genuine users, or a flood of fake requests meant to wear the server down.
How do Interface Errors Show Up in Netstat?
Interface errors show up in netstat's counters, and those are where to look when connections seem fine yet transfers stay slow. On a Linux server, netstat -i shows receive errors and drops interface by interface, while netstat -s counts the TCP data that had to be sent again. Windows has netstat -e for the same job, reporting discards and errors on the Ethernet interface.
Rising resend counts usually mean packet loss somewhere along the path. One reading won't tell you much, since the totals have been climbing since the last reboot. Take a second a few minutes later and compare the two.
Can Netstat Detect Malware?
The netstat command can reveal signs of malware, for example a program nobody installed talking to an address nobody recognizes, but proving intent takes more than netstat. Think of it as a first look during triage. These checks give you the most to go on:
Unexpected listeners: Ports in LISTEN state that no approved service should be using
Unknown owners: Programs in netstat -anob output, or sudo netstat -tunp output, that nobody recognizes
Odd destinations: Open connections to foreign addresses outside your normal partners and providers
Unusual locations: Owning programs that run from temporary or download folders
Anything odd you find is a lead to hand to security, and nothing more yet. Some malware hides from the operating system, which hides it from netstat as well; other strains connect for a few seconds every few hours and slip past any single check. That's where flow analysis over days and weeks becomes far more useful.
Why do You See "Netstat Command Not Found"?
The "netstat command not found" message just means net-tools isn't installed, which is now the default on many distributions and nearly every container image. You can install it or move straight to the newer commands in the next section.
If you'd rather keep netstat, these commands install it:
Platform | Command | What it tells you |
Debian and Ubuntu | sudo apt install net-tools | Installs netstat along with ifconfig and route |
RHEL, Rocky and Fedora | sudo dnf install net-tools | Installs the same package on Red Hat based systems |
Arch Linux | sudo pacman -S net-tools | Installs net-tools from the Arch repositories |
Production servers are often locked down. There, adding even a small legacy package may need a change request, and the built-in replacements will get you an answer sooner.
What Command Replaces Netstat in Linux?
The ss command replaces netstat in Linux whenever you need to list connections. For routes and interface counters, ip takes over, and both come with iproute2, which current distributions install by default. On a busy server you'll notice ss answers faster too, because it reads connection data straight from the system.
Netstat remains fully supported on Windows; for scripting, PowerShell's commands are easier to filter. Task by task, this is what has replaced netstat:
Task | Netstat command | Modern replacement |
Listening ports with programs (Linux) | sudo netstat -tulpn | sudo ss -tulpn |
All TCP connections and states (Linux) | netstat -tan | ss -tan |
Connection summary (Linux) | netstat -s | ss -s |
Routing table (Linux) | netstat -rn | ip route |
Interface statistics (Linux) | netstat -i | ip -s link |
TCP connections (Windows) | netstat -ano -p tcp | Get-NetTCPConnection |
UDP endpoints (Windows) | netstat -ano -p udp | Get-NetUDPEndpoint |
If you know netstat's options, you mostly know ss's already. And ss adds state filters, such as ss -tan state established, that netstat never had, which makes it the safer default on any current Linux server.
Where does Netstat Fall Short for the Business?
Netstat falls short for the business because it captures one host at one moment, with nothing kept afterward and no alerts. During a live incident on a single server, that's fine. At the scale of hundreds of servers, switches and cloud workloads, that same limitation turns into a liability.
The gaps tend to show up the same way every time:
Point-in-time view: A connection spike that lasts ten minutes overnight is gone before anyone logs in
One host at a time: Checking a service across a cluster means repeating the same command on every node
No history: Post-incident reviews have nothing to compare against, so finding the root cause becomes guesswork
No alerting: Nobody learns that a port stopped listening until users start reporting errors
No service context: A process ID says nothing about which customer-facing application depends on it
Access overhead: Every check needs direct access to production servers, which adds approvals and audit exposure
Each gap adds minutes to outages and hours to routine checks. Closing them takes continuous observability across hosts, network and applications. Then the questions netstat answers once get answered around the clock, with the history kept for later.
How does Motadata ObserveOps Bring Observability to Ports and Connections?
Motadata ObserveOps brings observability to ports and connections, so they're watched continuously and you hear about it when behavior changes. Each capability below answers a question netstat can only answer once:
Port service checks: ObserveOps checks that a service port answers and raises an alert when it stops responding
Process health: Process monitoring tracks CPU, memory and availability for individual programs, with threshold alerts and automated actions such as a restart
Traffic conversations: Flow data from NetFlow, sFlow, jFlow and IPFIX shows which internal and external systems talk to each other, and how much, over months or minutes
Interface health: Bandwidth use, error rates and status changes are tracked for every monitored interface
Baselines and anomalies: AI/ML policies learn normal patterns and can flag deviations that a fixed threshold would miss
Intelligent traffic analysis is what covers the missing history. Say an unknown host connects for a few minutes each night. The flow record is still there the next morning, ready for someone to review.
Engineers still get their hands-on tools. ObserveOps runbooks can trigger your own Python, PowerShell or shell scripts when an alert fires, which means the commands someone would type mid-incident get run without waiting for them. Here's the difference, question by question:
Question | What netstat gives you | What ObserveOps adds |
Is the service port listening? | A yes or no for one host, right now | A continuous check with an alert when it fails |
Which program is consuming resources? | A process ID at the moment you looked | Per-process trends with thresholds and automated actions |
Who is this server talking to? | Current connections on one machine | Flow history across the network, filterable by endpoint |
Is the interface dropping traffic? | Totals since the last reboot | Error rates over time alongside latency and loss |
With network performance insight, you see those signals next to latency, jitter and packet loss on dashboards for executives, NOC staff and network engineers. An alert that needs follow-up can open a ticket in Motadata ServiceOps, context included.
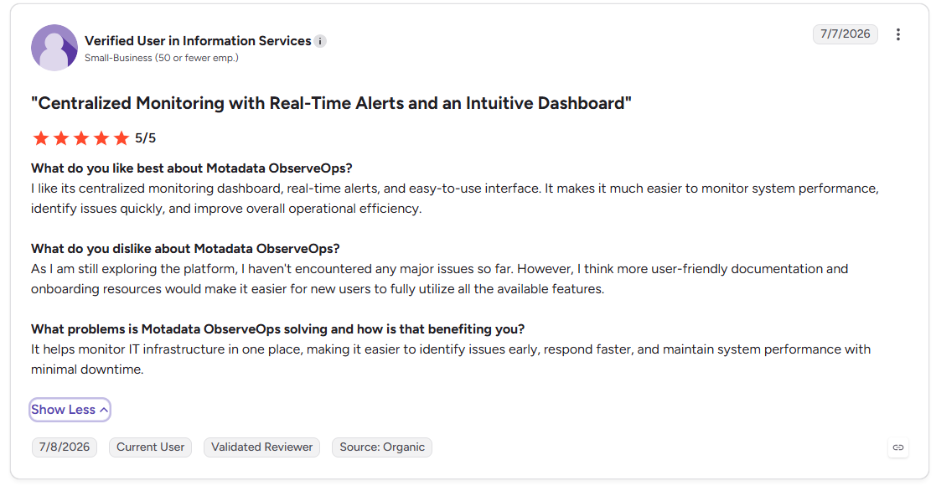
This is what one of our clients says about Motadata ObserveOps on G2.
Replace One-Off Netstat Snapshots with Continuous Connection Observability in Motadata ObserveOps
Nobody disputes that netstat asks the right questions about open ports, owning programs and connection states. What it can't do is look past one machine or one moment. The problems that cost the most tend to come and go, span many hosts or end before anyone logs in, and a single snapshot can't catch any of them.
Host-level tools aren't going away, and when you're already logged in to a server, netstat, ss and their PowerShell counterparts remain the fastest way to check. What Motadata ObserveOps covers is everything around that moment. It keeps watching ports, processes and traffic between those moments, and it holds on to the history your next post-incident review will ask for.
FAQs
How do I use the netstat command?
Open a terminal or Command Prompt and type netstat followed by the options you need. On Windows, netstat -ano lists all connections with process IDs. On Linux, sudo netstat -tulpn lists listening ports with program names, and macOS users can run netstat -an -p tcp for TCP connections.
What is the difference between netstat and ss?
Both list network connections on Linux, but ss is the modern replacement from the iproute2 package. It reads connection data directly from the system, returns results faster on busy servers and supports state filters. Most netstat options work the same way in ss, so switching takes little effort.
How do I check if port 8080 is open on Windows?
Run Get-NetTCPConnection -LocalPort 8080 in PowerShell to see whether a local program is listening on that port and which process ID owns it. To test whether another machine can reach it, run Test-NetConnection with the host name and -Port 8080, which checks the full network path.
Does netstat work in PowerShell?
Yes, netstat runs in PowerShell exactly as it does in Command Prompt, with the same options and output. PowerShell also offers Get-NetTCPConnection and Get-NetUDPEndpoint, which return structured results that are easier to filter, sort and reuse in scripts.
Can netstat track connections over time?
Netstat can refresh its output at an interval, such as netstat -ano 5 on Windows or netstat -tanc on Linux, but it stores no history and sends no alerts. Tracking connections over time needs an observability platform such as Motadata ObserveOps, which watches ports, processes and traffic flows and alerts on changes.
Author
Poonam Lalani
Content Strategist
Poonam Lalani is a B2B content strategist and writer with a background in computer engineering and experience across enterprise technology domains, including AI, cloud, DevOps, data engineering, and IT operations. She specializes in creating research-driven content that simplifies complex ideas and supports product education, thought leadership, and business growth.