Network Diagram Examples: 8 Types and How to Draw Them
Most network diagrams we come across land in one of two piles: the one drawn for an audit years ago and never opened since, and the one so crowded that finding the firewall takes squinting.
The network diagram examples below sit between those piles, 8 diagrams IT teams actually use, sorted into physical, logical, and cloud or WAN. For the full build process behind one map, see our guide to the network topology diagram. Each example covers what it shows, who reads it, what to label and the mistake we see most.
In this blog, you will:
Look through 8 diagrams, from a 10-person office to an SD-WAN spread across several sites.
Pick the right one for the job you have, be it an audit, a cutover or a new hire's first week.
Learn which labels go missing when people draw by hand, and how discovery puts them back.
What Is a Network Diagram?
A network diagram is a picture of how the devices on your network connect to each other. Some of them are basically floor plans for hardware, right down to which rack and which port. Others don't bother with cables at all and track where data goes, so what you mostly see is IP ranges, VLANs and routes.
Most teams end up keeping both. The person holding a patch cable needs a port number. The person chasing a routing loop needs to know why 10.10.1.0/24 can't talk to 10.20.1.0/24, and no single drawing serves them both well.
Underneath all of it sits the network topology (star, mesh, tree or, more often, some mix), which shapes how each version looks.
Which Network Diagram Should You Draw for Each Job?
Which network diagram to draw depends on the job, and on who's going to be staring at the page. An auditor and a cabling contractor want almost nothing in common from a diagram, so we sorted the table by situation.
Situation | Start With | Why |
Setting up or moving a small office | Small office diagram | Every device and the internet link fit in one view |
Planning rack space or a cabling job | Rack diagram | Shows rack units, power feeds and patch panels |
Explaining the network to leadership or auditors | Enterprise architecture diagram | Shows tiers and sites without port-level clutter |
Troubleshooting routing between sites | Layer 3 routing diagram | Shows subnets, gateways and routing protocols |
Separating departments, phones or guest Wi-Fi | VLAN diagram | Shows which VLAN lives on which port and trunk |
Reviewing firewall rules or audit scope | Security zones diagram | Shows trust zones and every path between them |
Moving workloads to AWS or Azure | Hybrid cloud diagram | Shows the VPC, its subnets and the link back on-prem |
Connecting branches over broadband and MPLS | SD-WAN diagram | Shows overlay tunnels on top of the transport links |
Physical Network Diagram Examples
Physical network diagram examples are the ones that get printed, folded and carried into a server room. You'll find where each box sits and which cable goes to which port. They also go stale faster than anything else here, usually because someone moved a cable and never touched the page.
1. Small Office Network Diagram
We like small office diagrams that fit on one page, since nobody flips to page two during an outage. The ISP modem goes at the top, with the firewall or router under it, then a switch or two, the Wi-Fi access point, and finally the printer, NAS and desks.
The reader is whoever looks after a site of 10 to 50 people (an office manager, or an MSP technician covering several of them) and, just as often, whoever inherits the job after that person leaves.
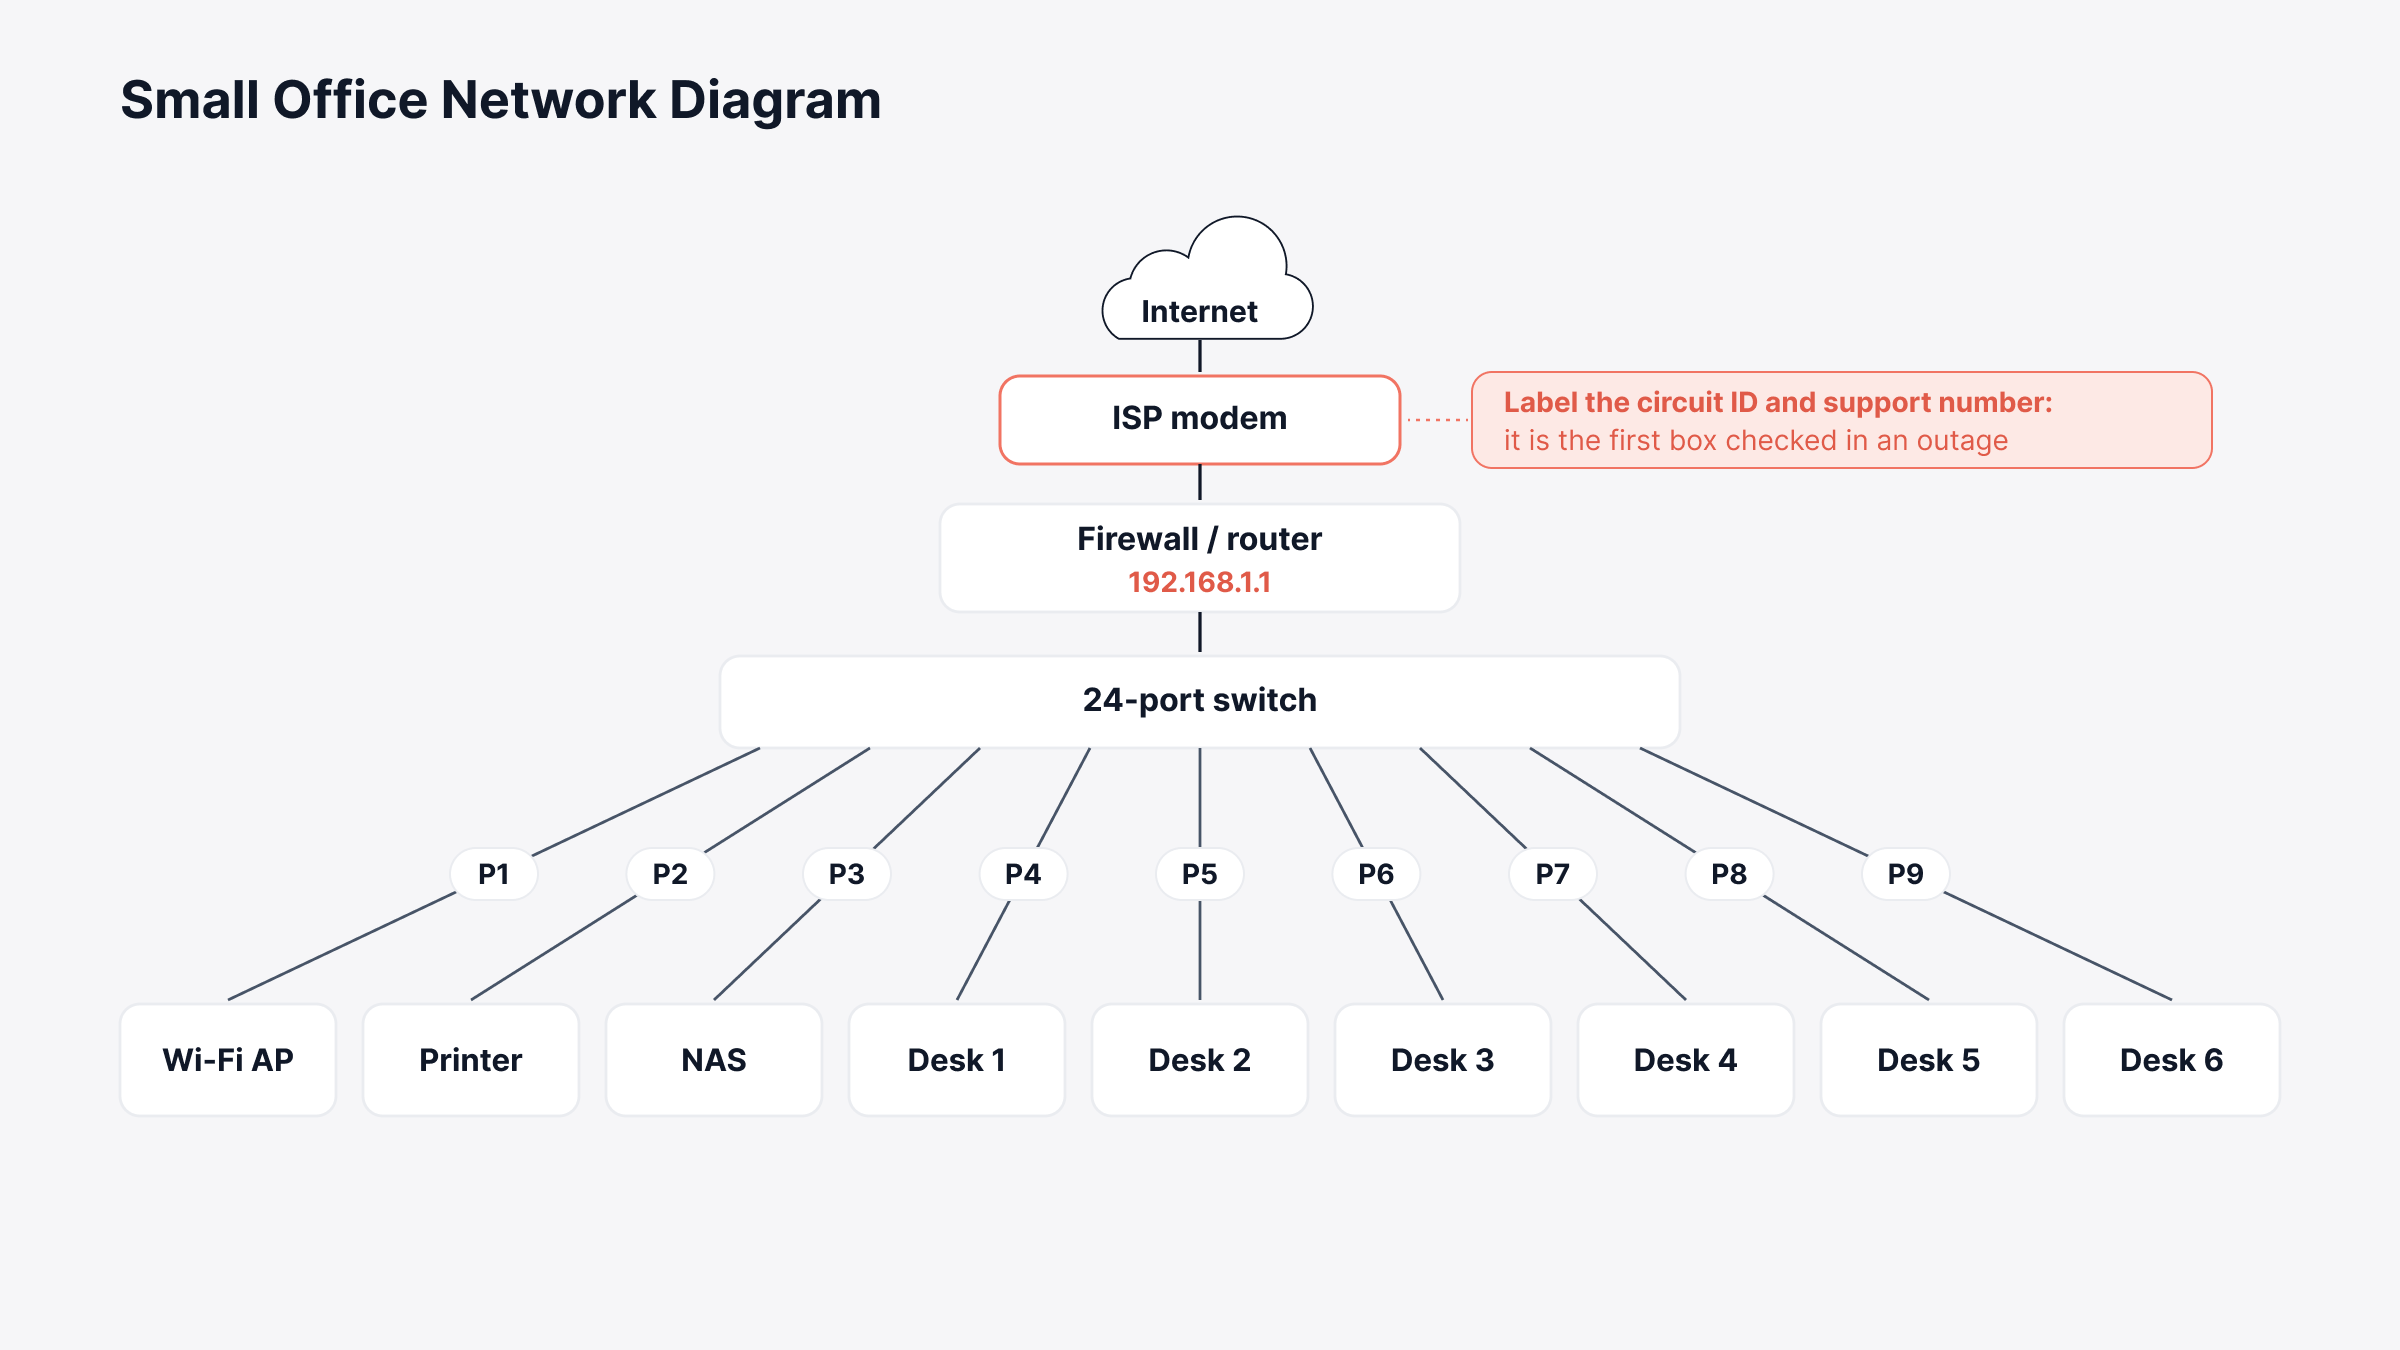
What to label: The ISP circuit ID and support number, the router's LAN IP, the switch port each access point uses and the Wi-Fi network names.
Common mistake: Leaving out the ISP modem. It's the first box anyone checks when the internet drops, and somehow it's also the one box nobody bothered to draw.
2. Network Rack Diagram
A rack diagram, or rack elevation, is a slot-by-slot picture of one rack, with every patch panel, switch, server, UPS and power strip drawn where it's actually mounted. Rack units are 1.75 inches tall and a full-height rack has 42 of them.
Even a one-slot gap is worth drawing, because someone will try to squeeze a 2U server into it. Data center technicians lean on it most. So does anyone planning a colocation move or writing instructions for remote hands.
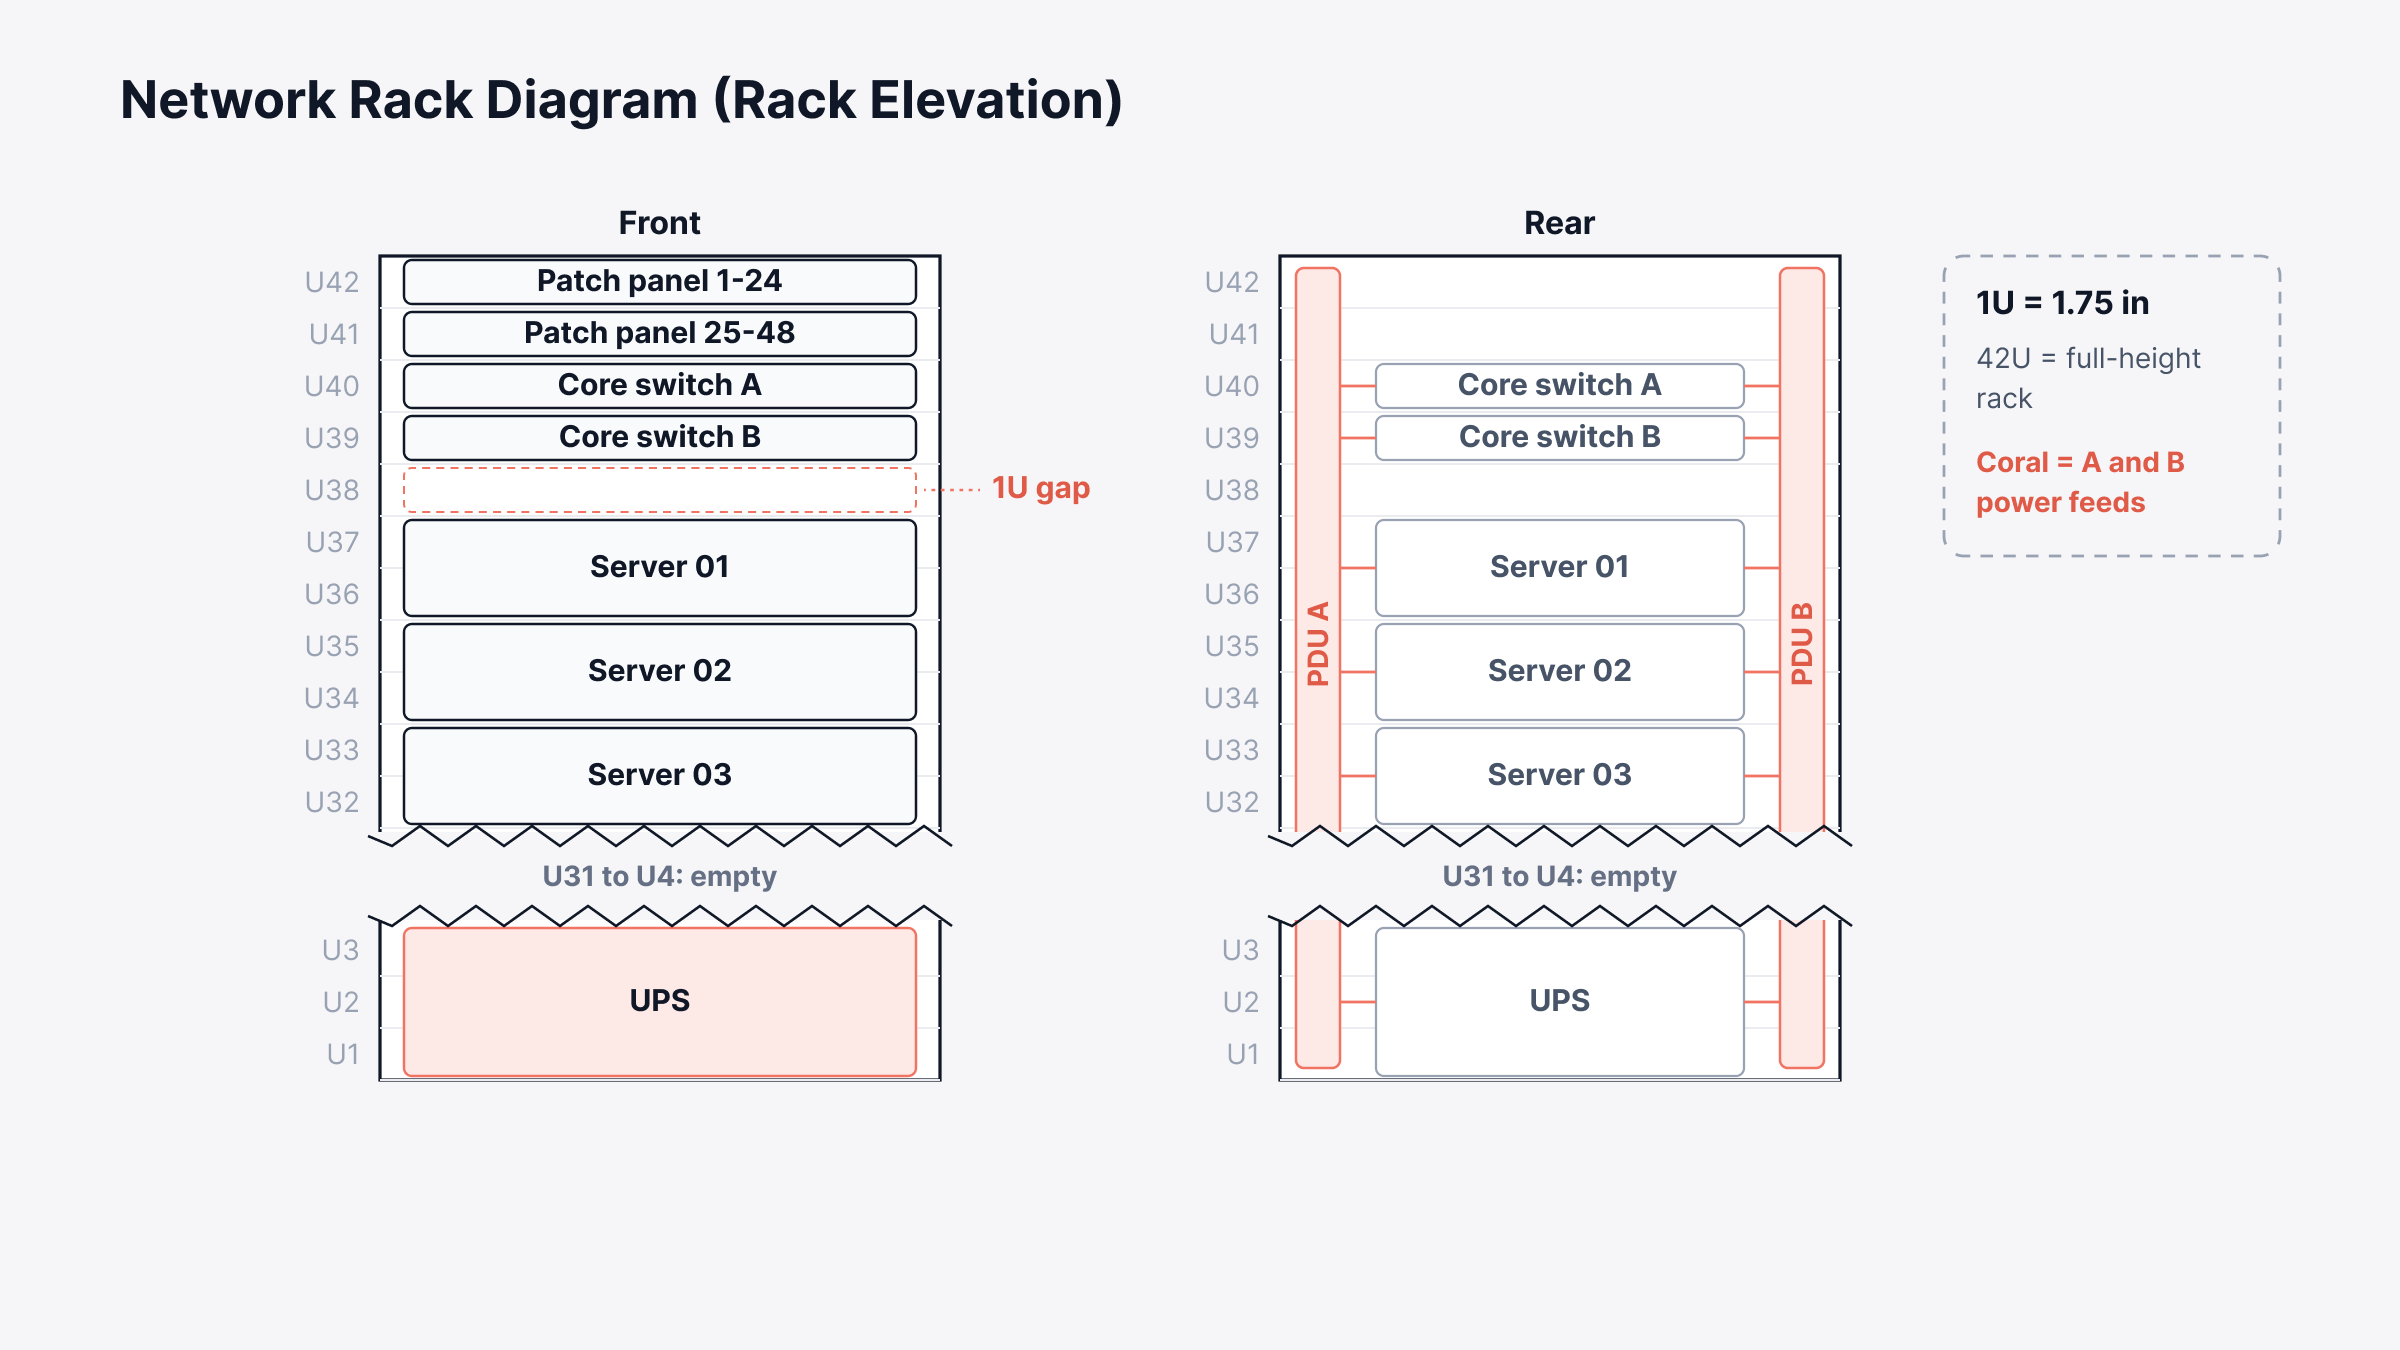
What to label: The U position and hostname of every device, its A and B power feeds, and the port range on each patch panel.
Common mistake: Drawing only the front. Remote hands working from the back of the rack need the rear view, or they end up guessing which power cord belongs to which server.
3. Enterprise Network Architecture Diagram
Almost every enterprise network architecture diagram we've seen uses the three-tier model of core, distribution and access, with the data center, WAN edge and internet edge hanging off the core.
Core and distribution are usually Layer 3 switches, and the access layer is the bit users actually touch, where laptops, phones and access points plug in.
Architects plan growth off this one. It's also the page leadership and auditors are most likely to see, so we'd keep it boringly clean.
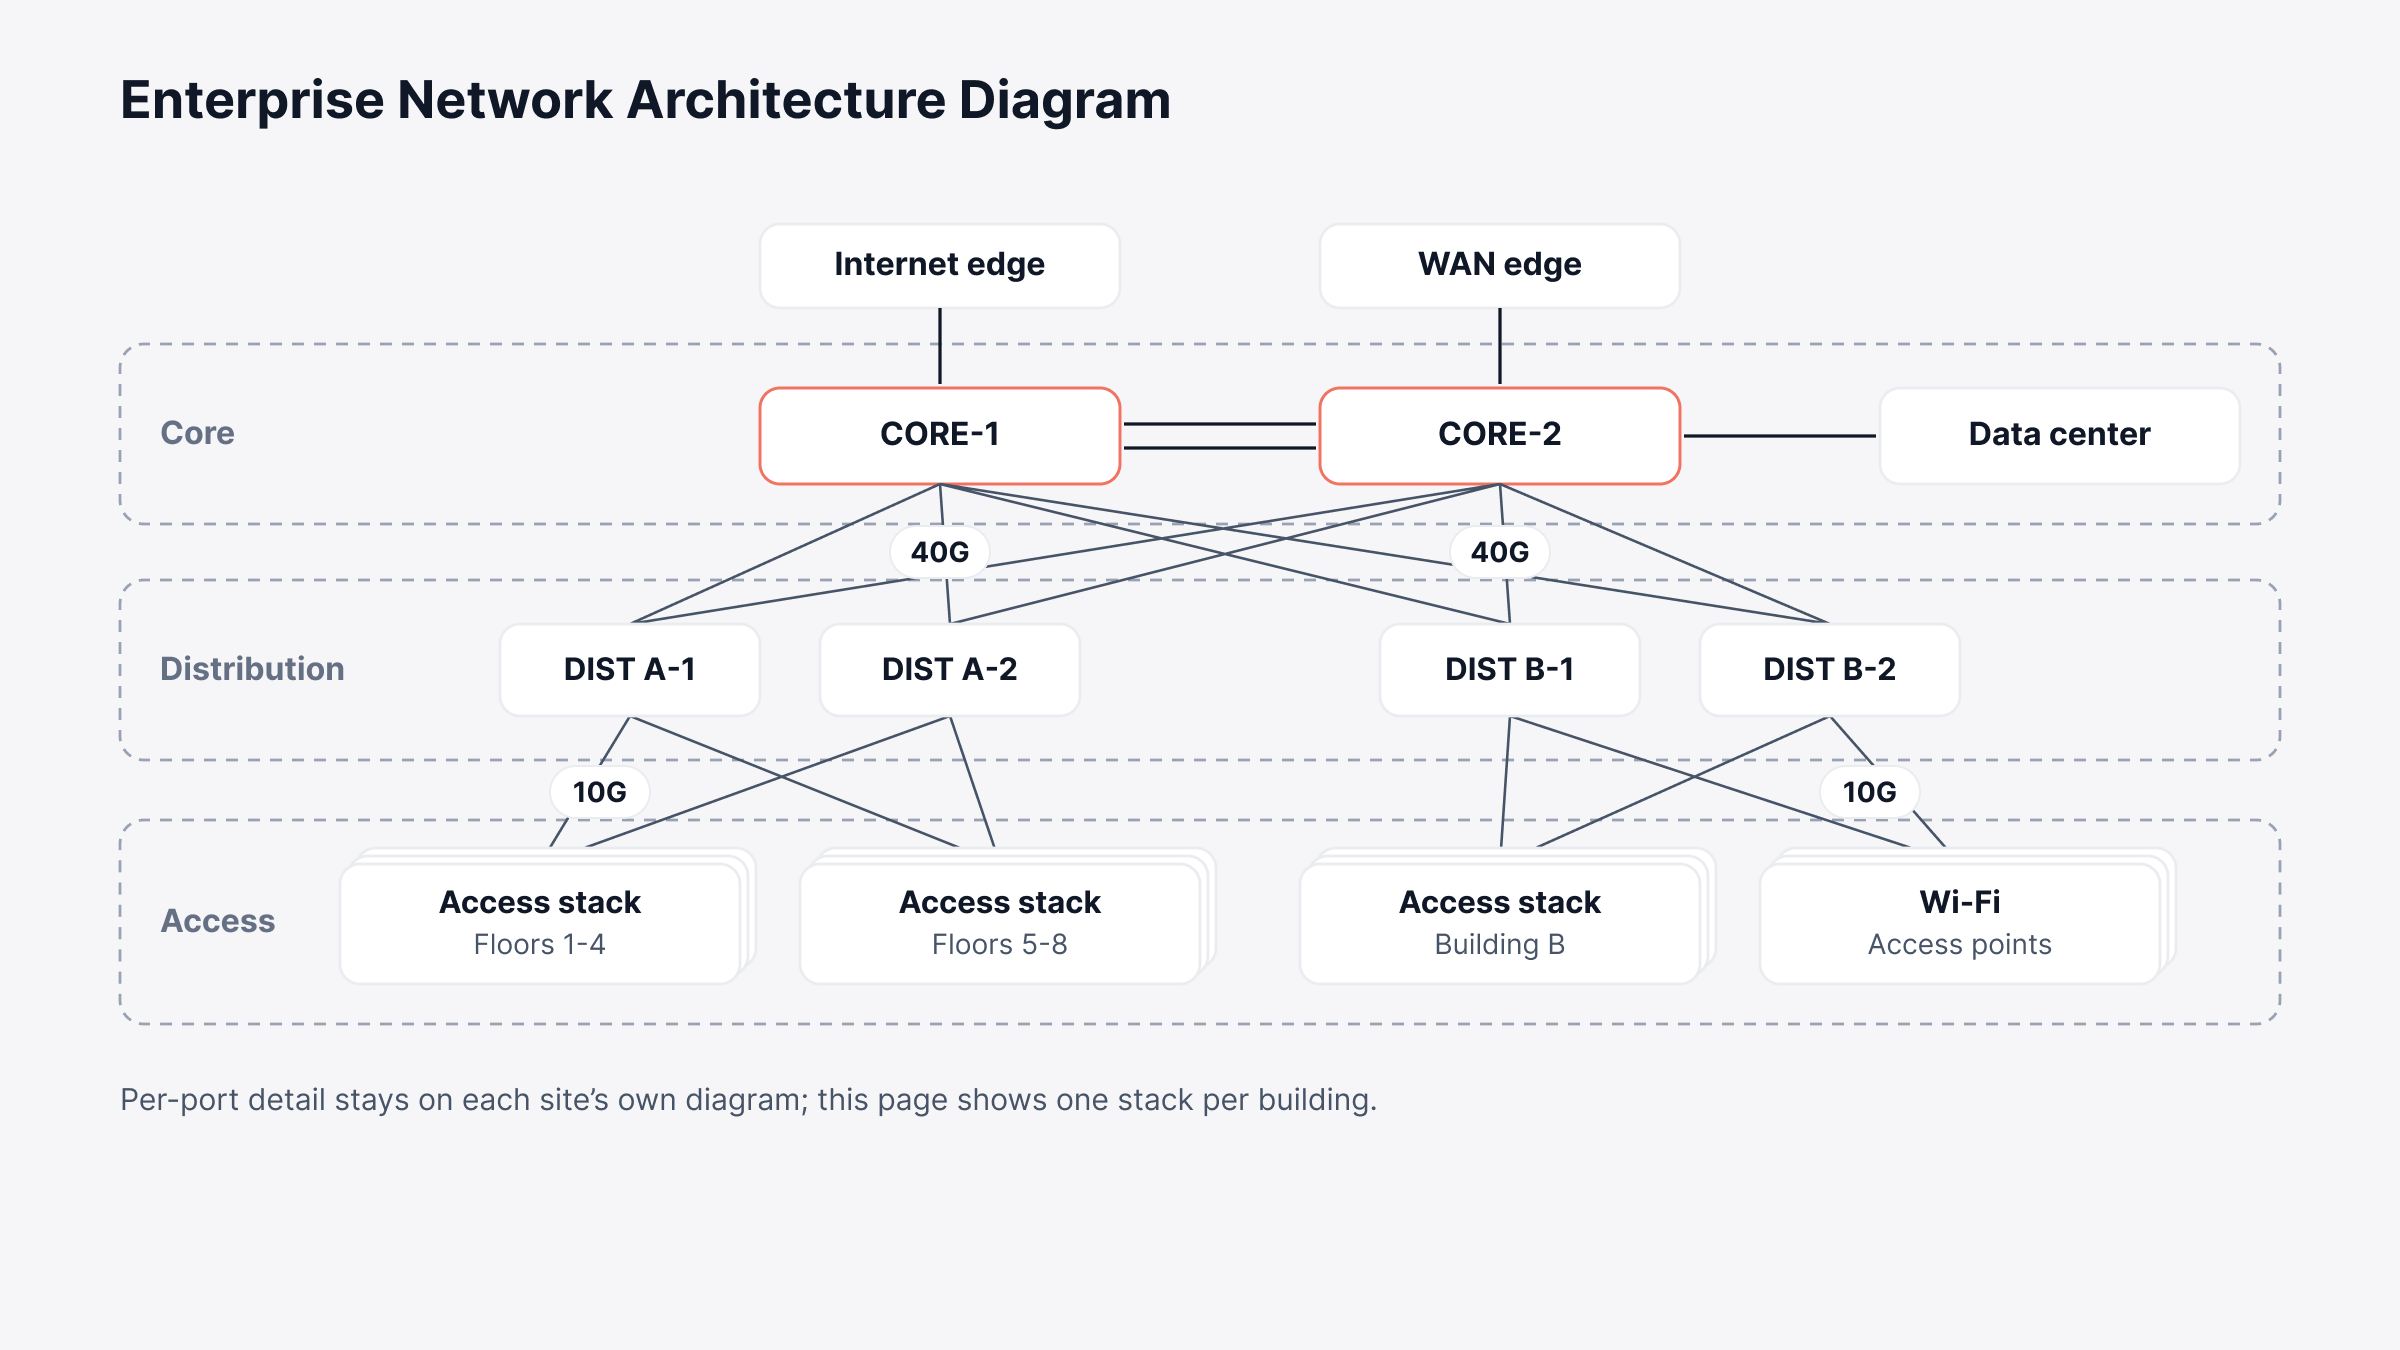
What to label: Device roles first, then the redundant pairs (CORE-1 and CORE-2, say) and the link speeds between tiers. Site or building names go on last.
Common mistake: Trying to fit every access switch on it. A company with 200 access switches is better off showing one stack per building here and keeping the per-port detail on each site's own diagram.
Logical Network Diagram Examples
Logical network diagram examples throw out the cables and follow the traffic. What's left is IP ranges, VLANs, routing and security zones. Two servers bolted into the same rack can end up at opposite ends of the page, since they're in different subnets.
4. Layer 3 Routing Diagram
On a Layer 3 diagram, each subnet is a box and each router or Layer 3 switch is a point joining those boxes, with the routing protocol written along the link.
It's where OSPF areas go, with area 0 as the backbone, along with BGP peers and their AS numbers and any static routes someone added during a past outage. Engineers tend to grab this page first when routing breaks.
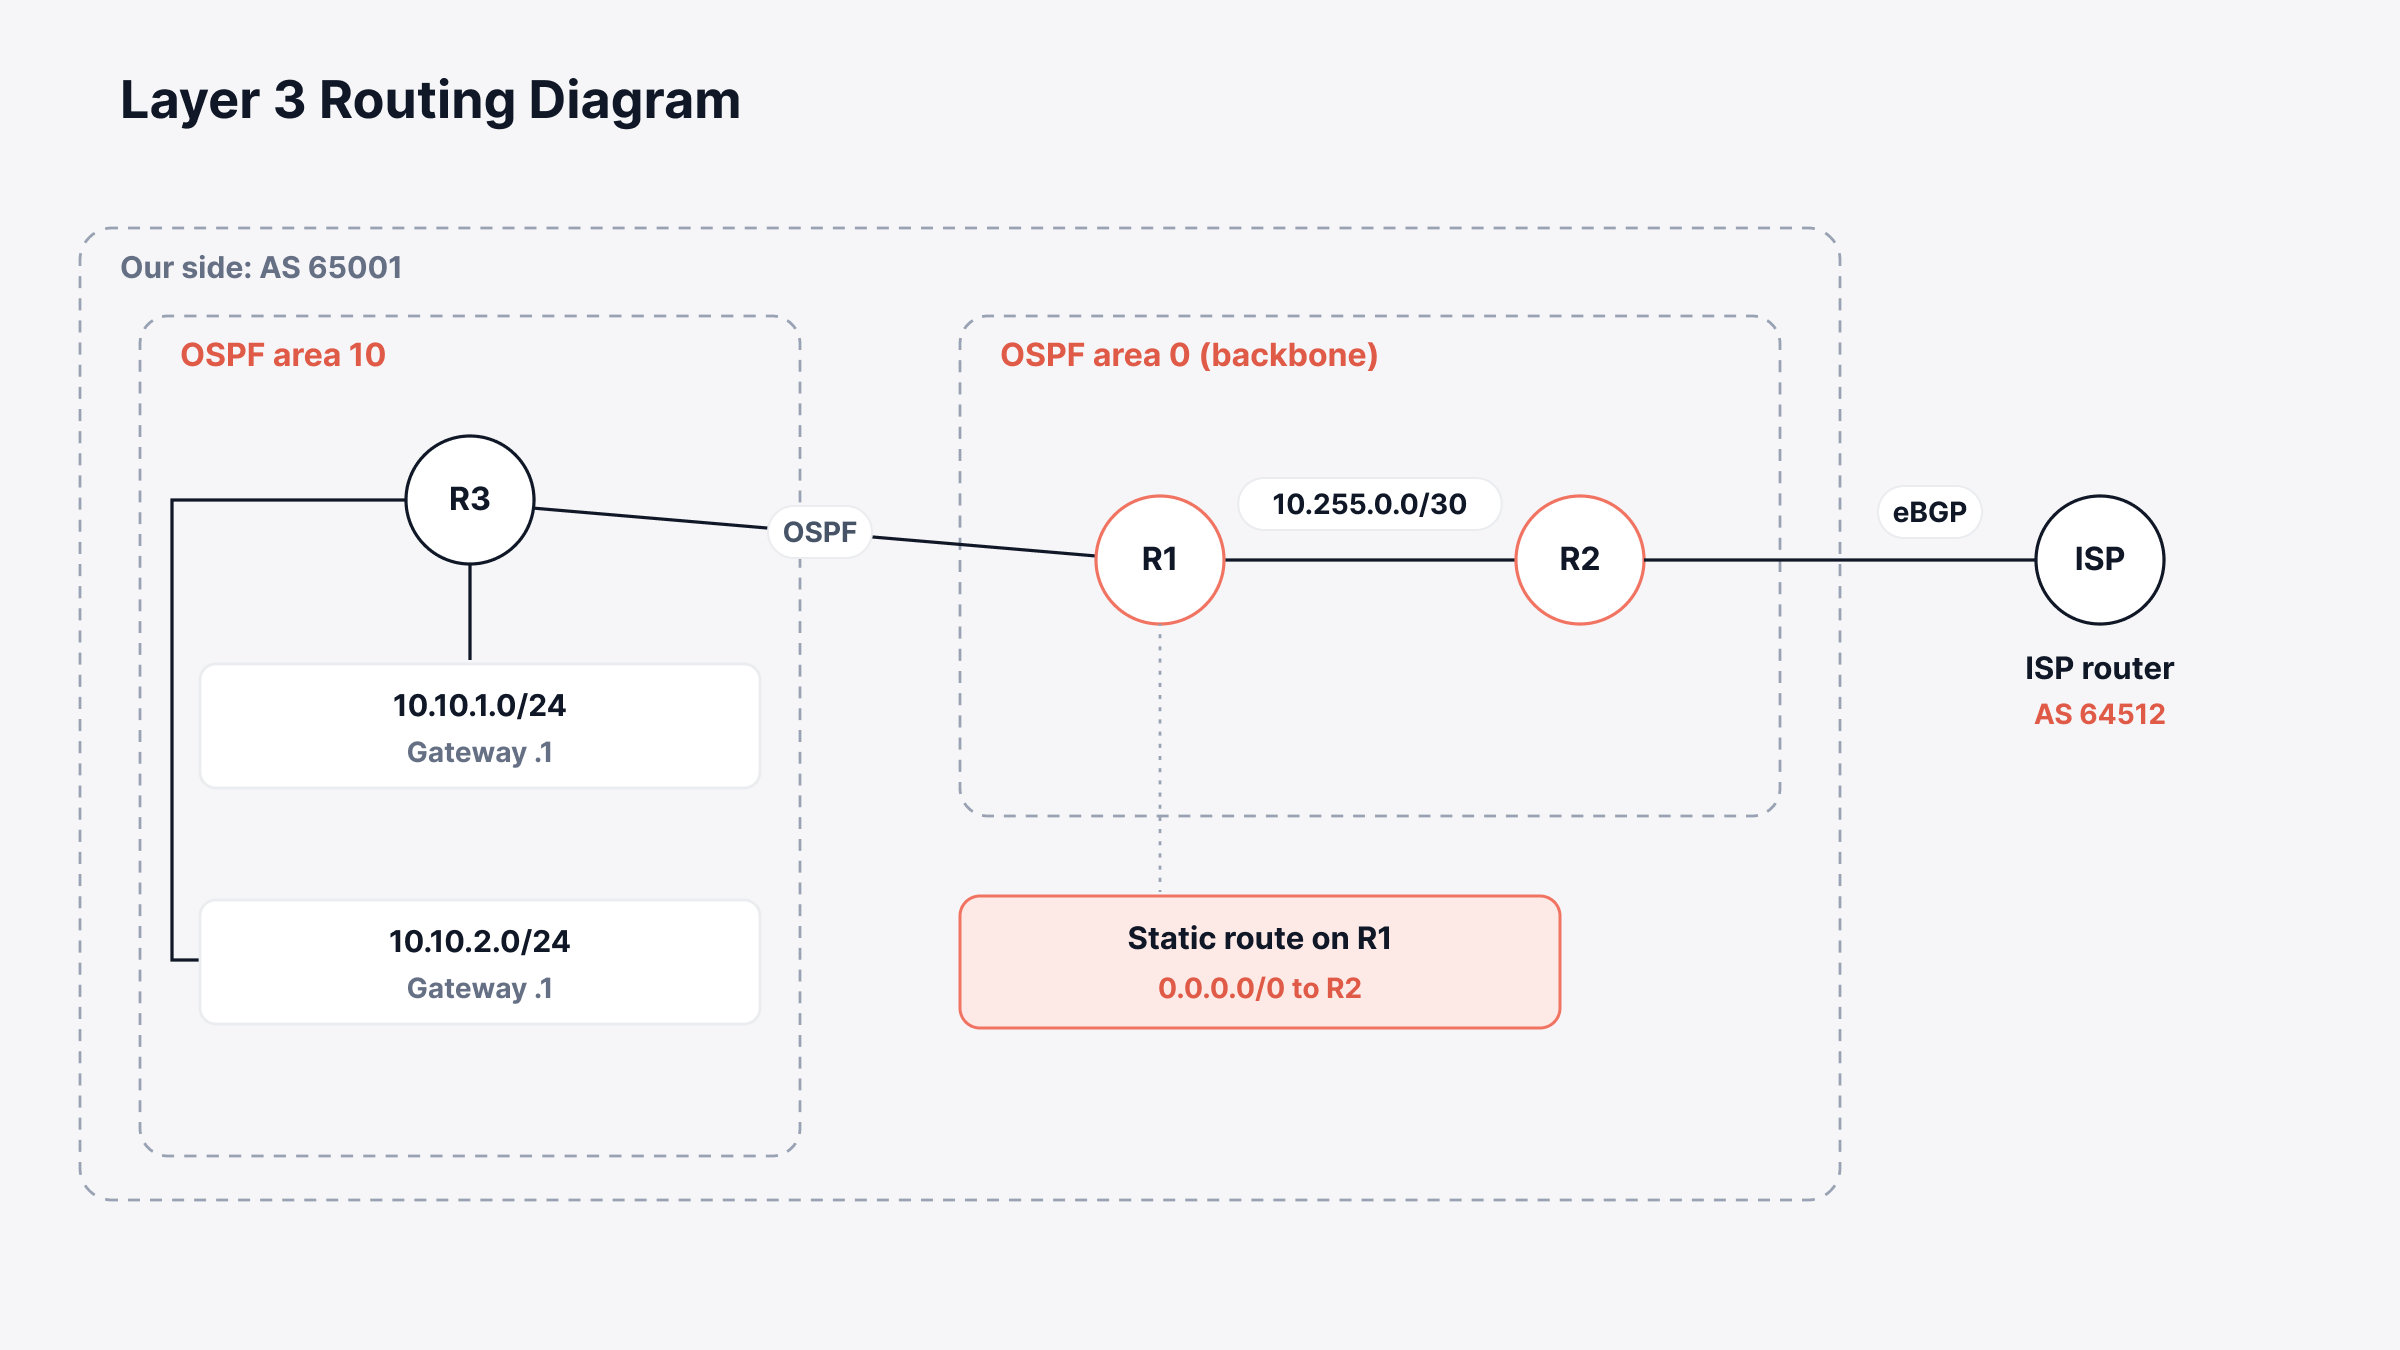
What to label: The CIDR range and gateway on every subnet, plus OSPF area numbers, BGP AS numbers and wherever static routes or redistribution come in. Overlapping ranges from rushed subnetting tend to surface on this page first, often to everyone's surprise.
Common mistake: Mixing in physical detail. Port numbers and cable runs belong on the physical diagram, and on this page they just bury the routing.
5. VLAN Diagram
Say you've put staff on VLAN 10, desk phones on 20 and guest Wi-Fi on 30. The VLAN diagram is where you write that down. It tells you which access port belongs to which VLAN and what each trunk is carrying.
Additionally, it also marks the one device doing the routing between them. Anyone splitting up departments, phones or guests should have one before the first port gets reassigned.
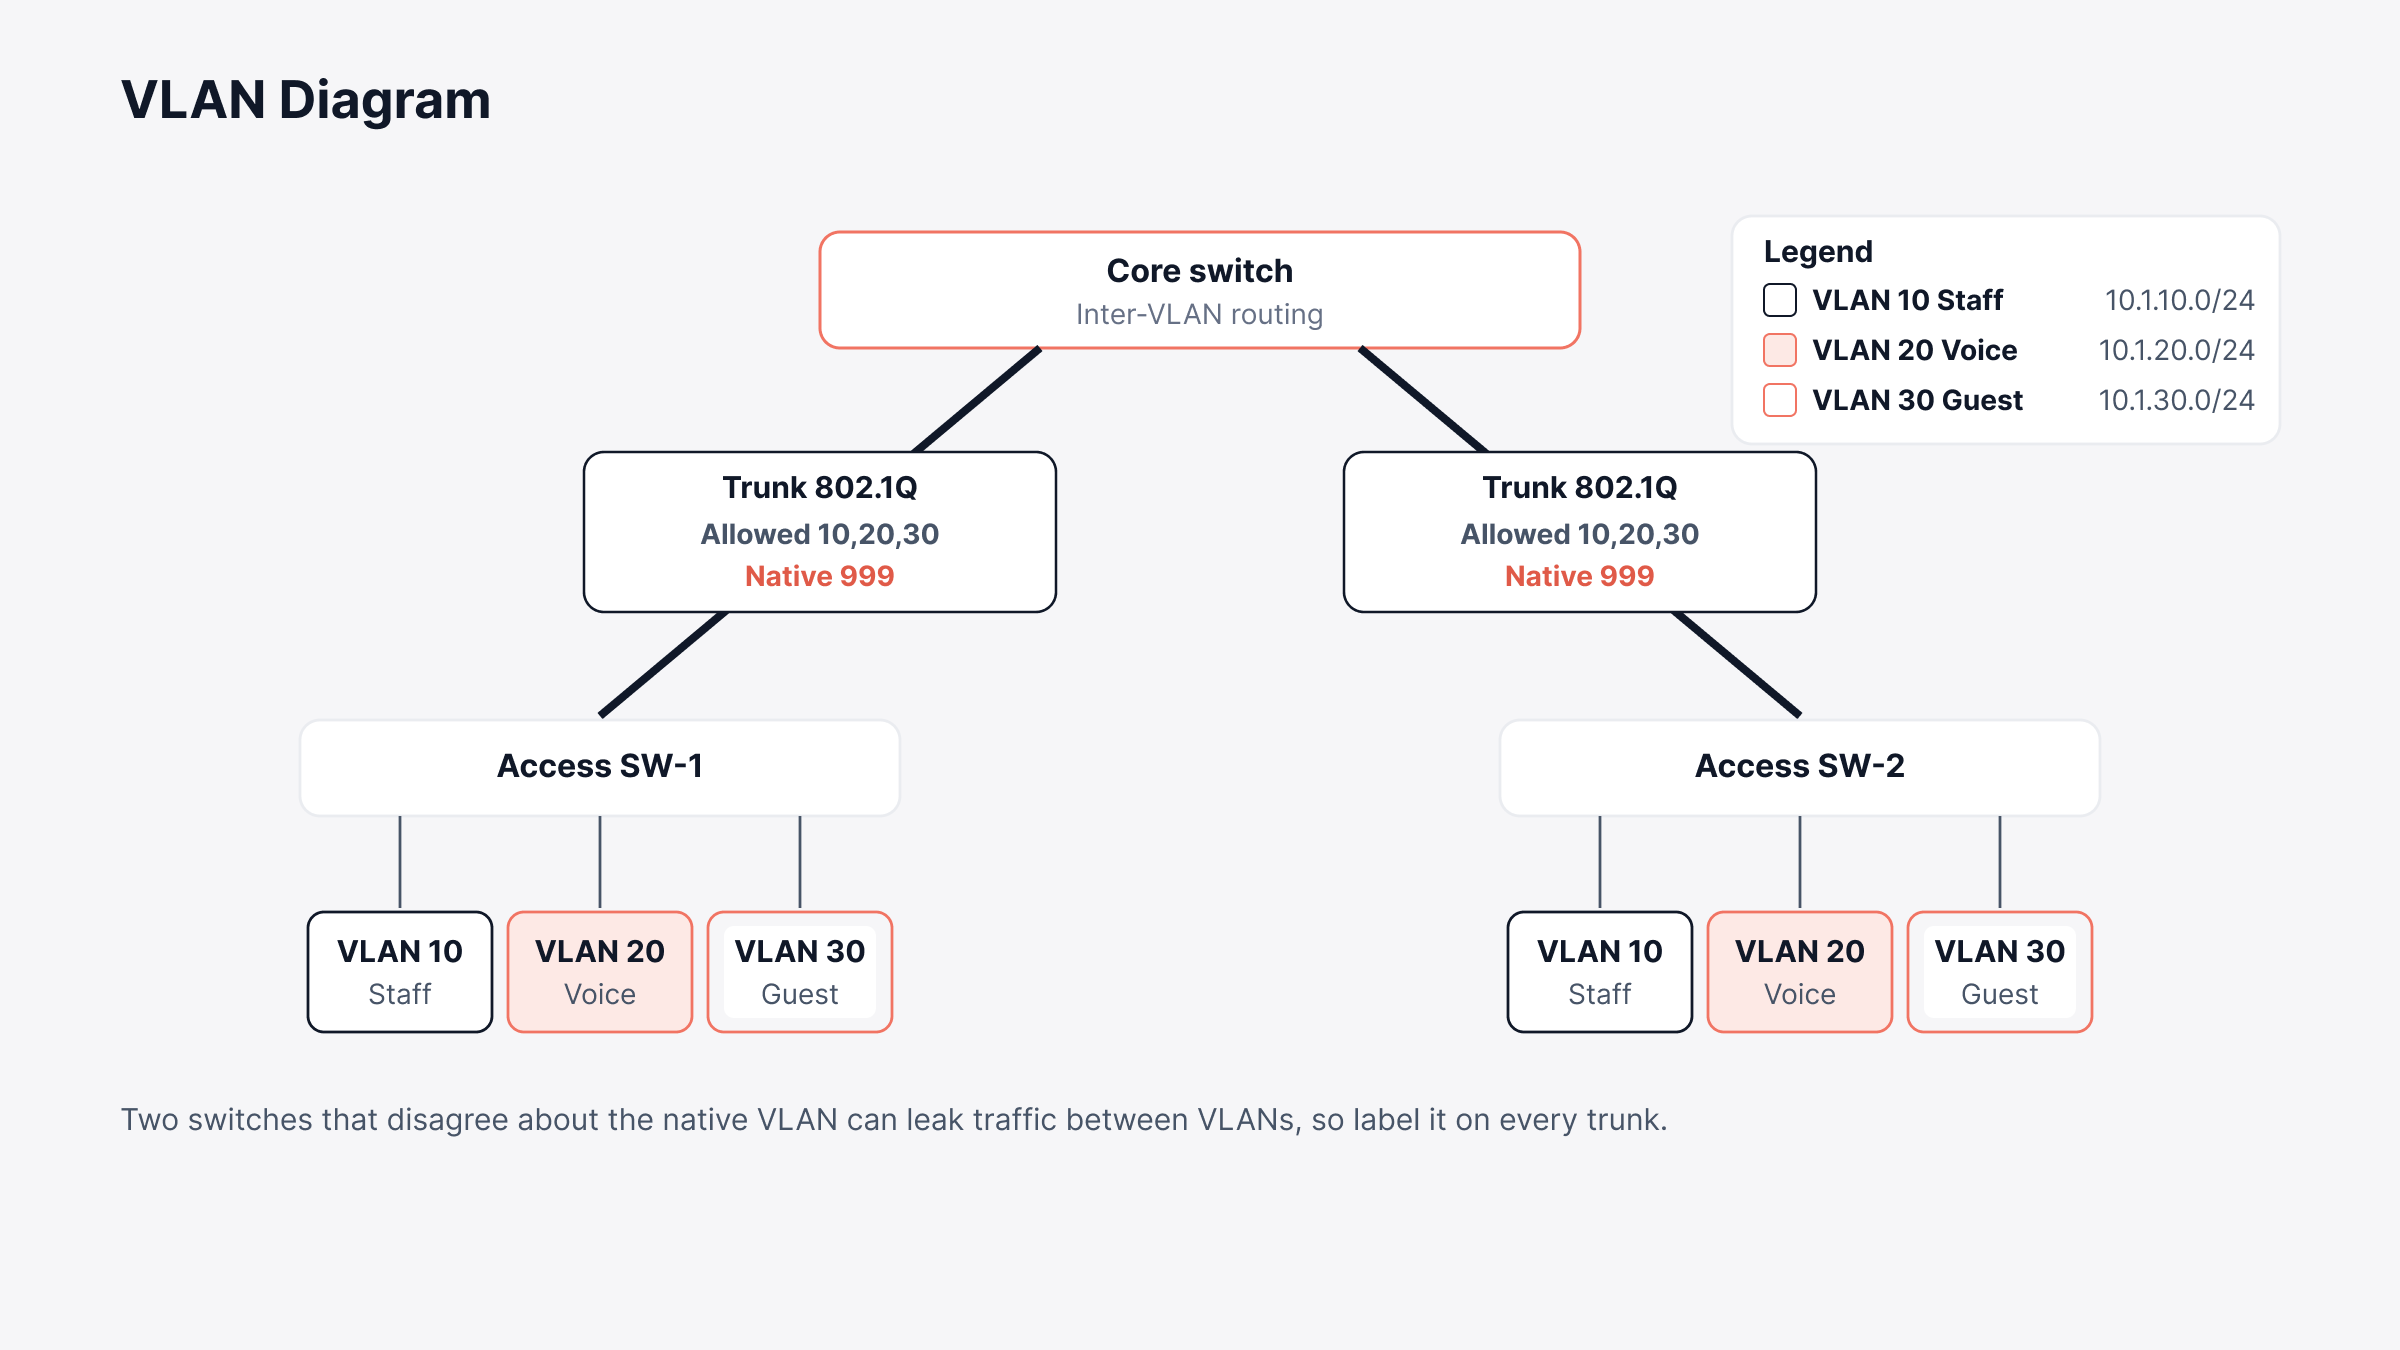
What to label: Each VLAN's ID, name and subnet go in the legend, the allowed list goes on every trunk, and the inter-VLAN router gets a clear tag.
Common mistake: Forgetting the native VLAN on trunks. Two switches that disagree about it can leak traffic between VLANs, which is a lot easier to catch on paper than in a packet capture.
6. Firewall and DMZ Security Zones Diagram
A security zones diagram groups systems by how far they're trusted. The DMZ holds whatever the internet can reach, like the web server and mail relay.
Internal systems hide behind a second firewall (sometimes just another interface on the same box), and admins get in through their own management network. Security teams check rules against it. Auditors use it to argue about scope.
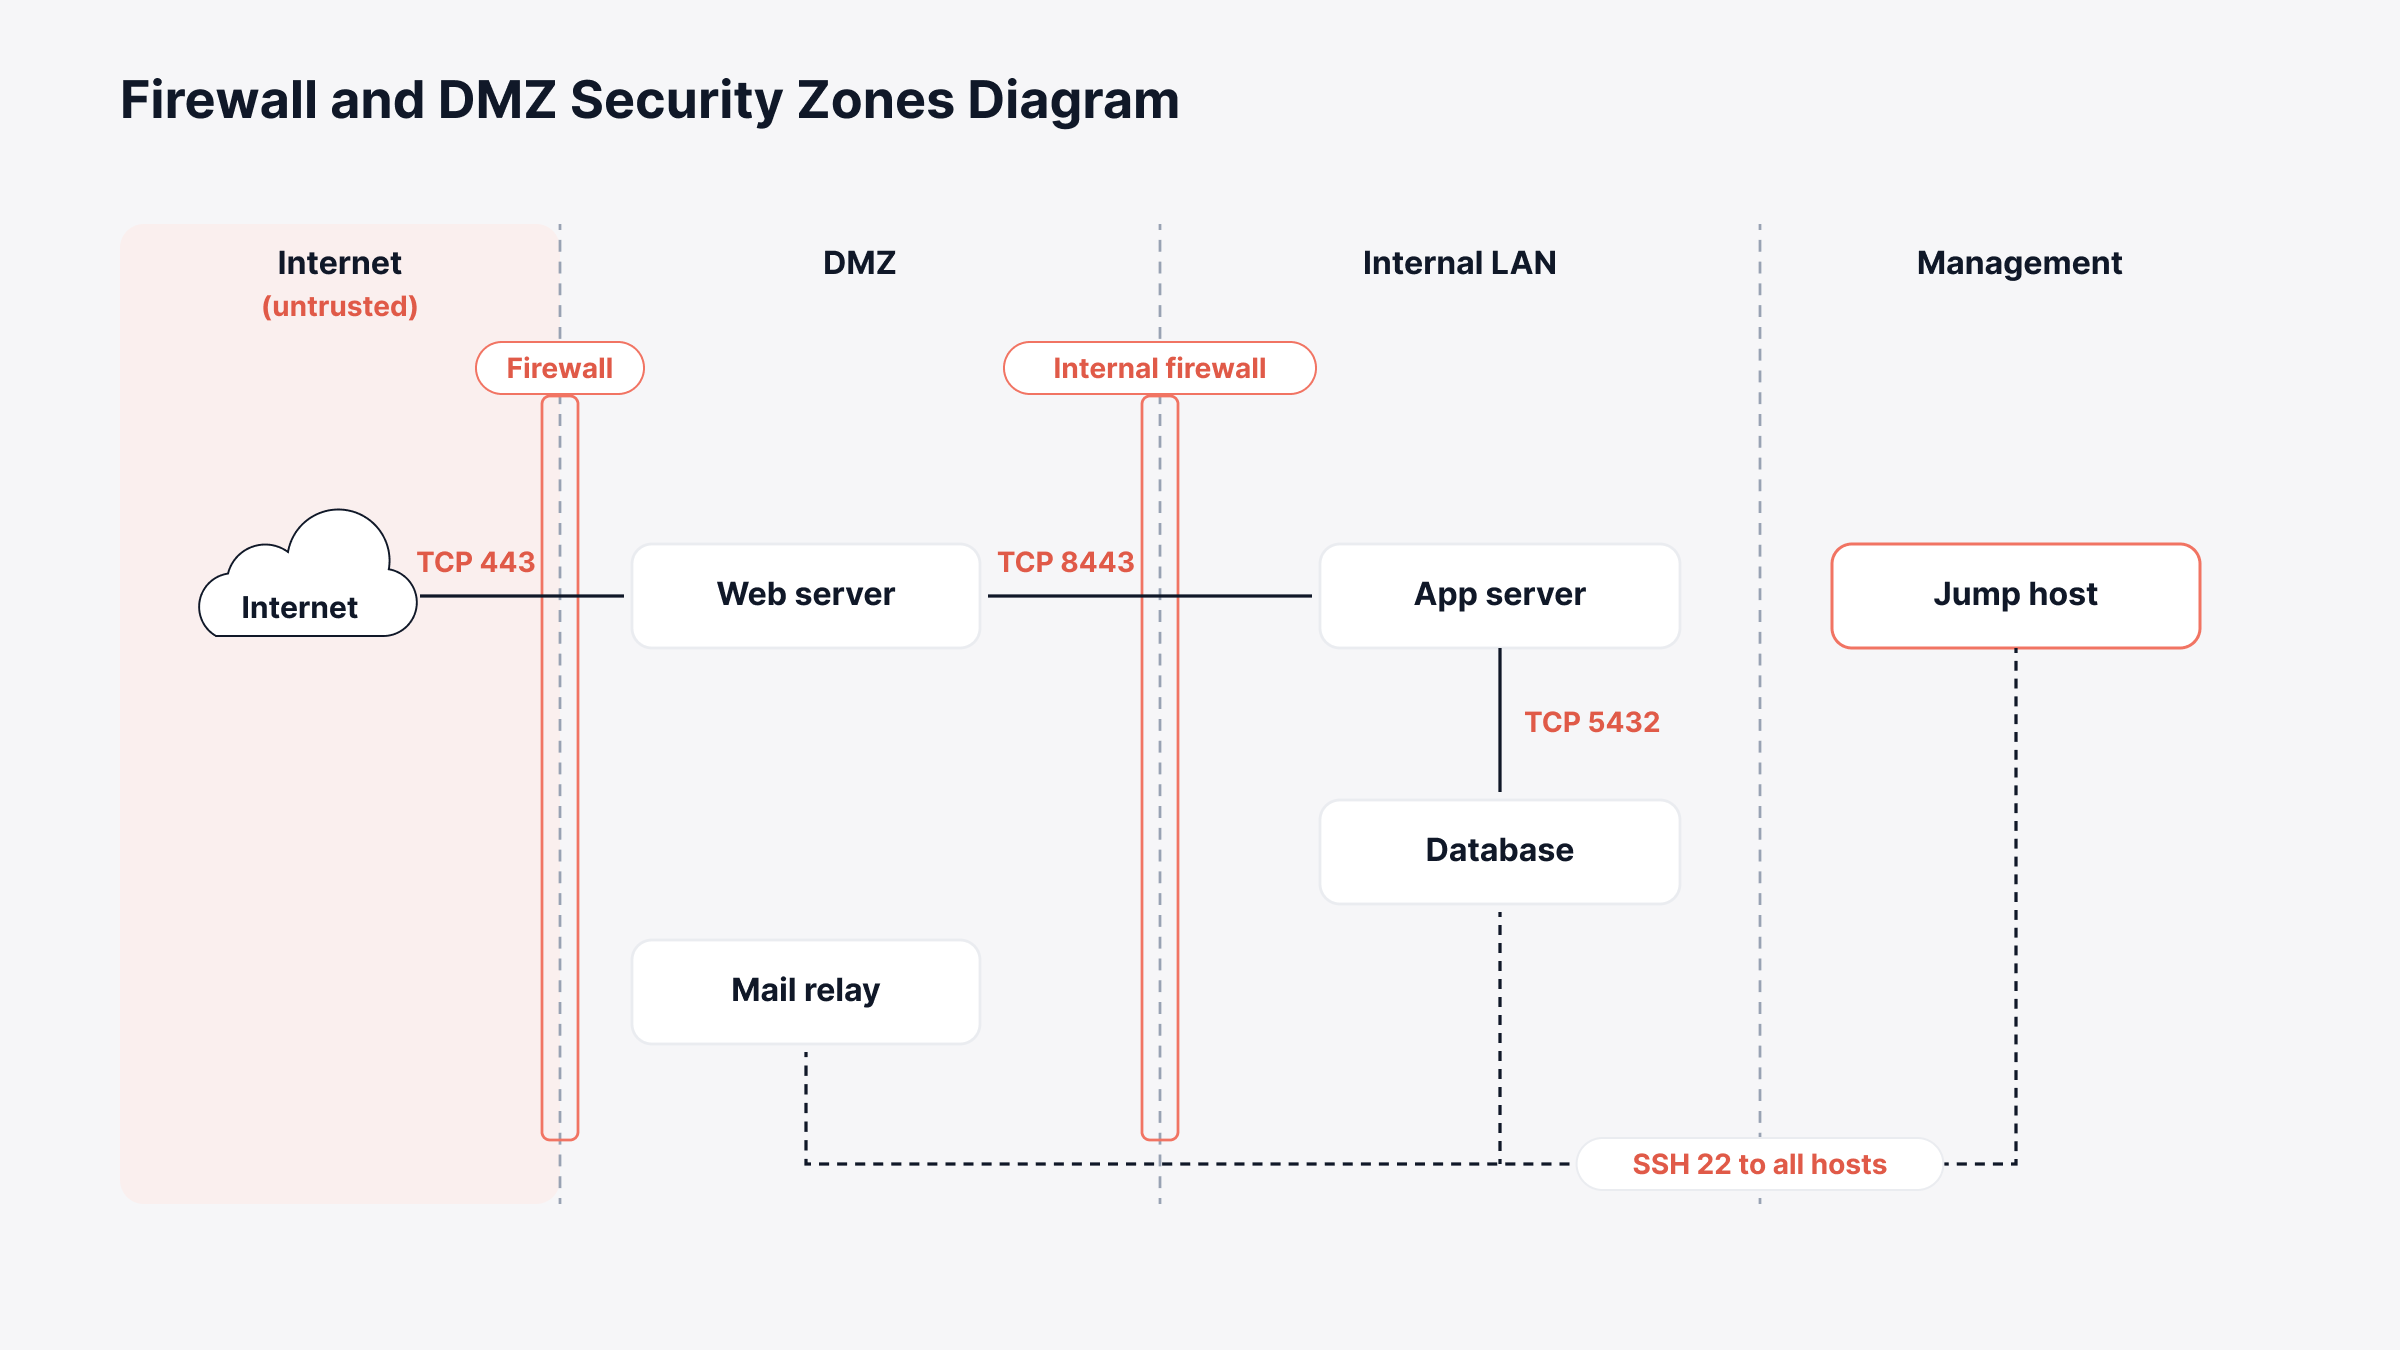
What to label: Zone names and firewall interfaces, plus every allowed flow and its port. Internet to the web server on TCP 443 only is the kind of line we mean.
Common mistake: Drawing the zones without the flows. Tidy boxes don't tell an auditor much. What they want to trace is every path that crosses a boundary.
Cloud and WAN Network Diagram Examples
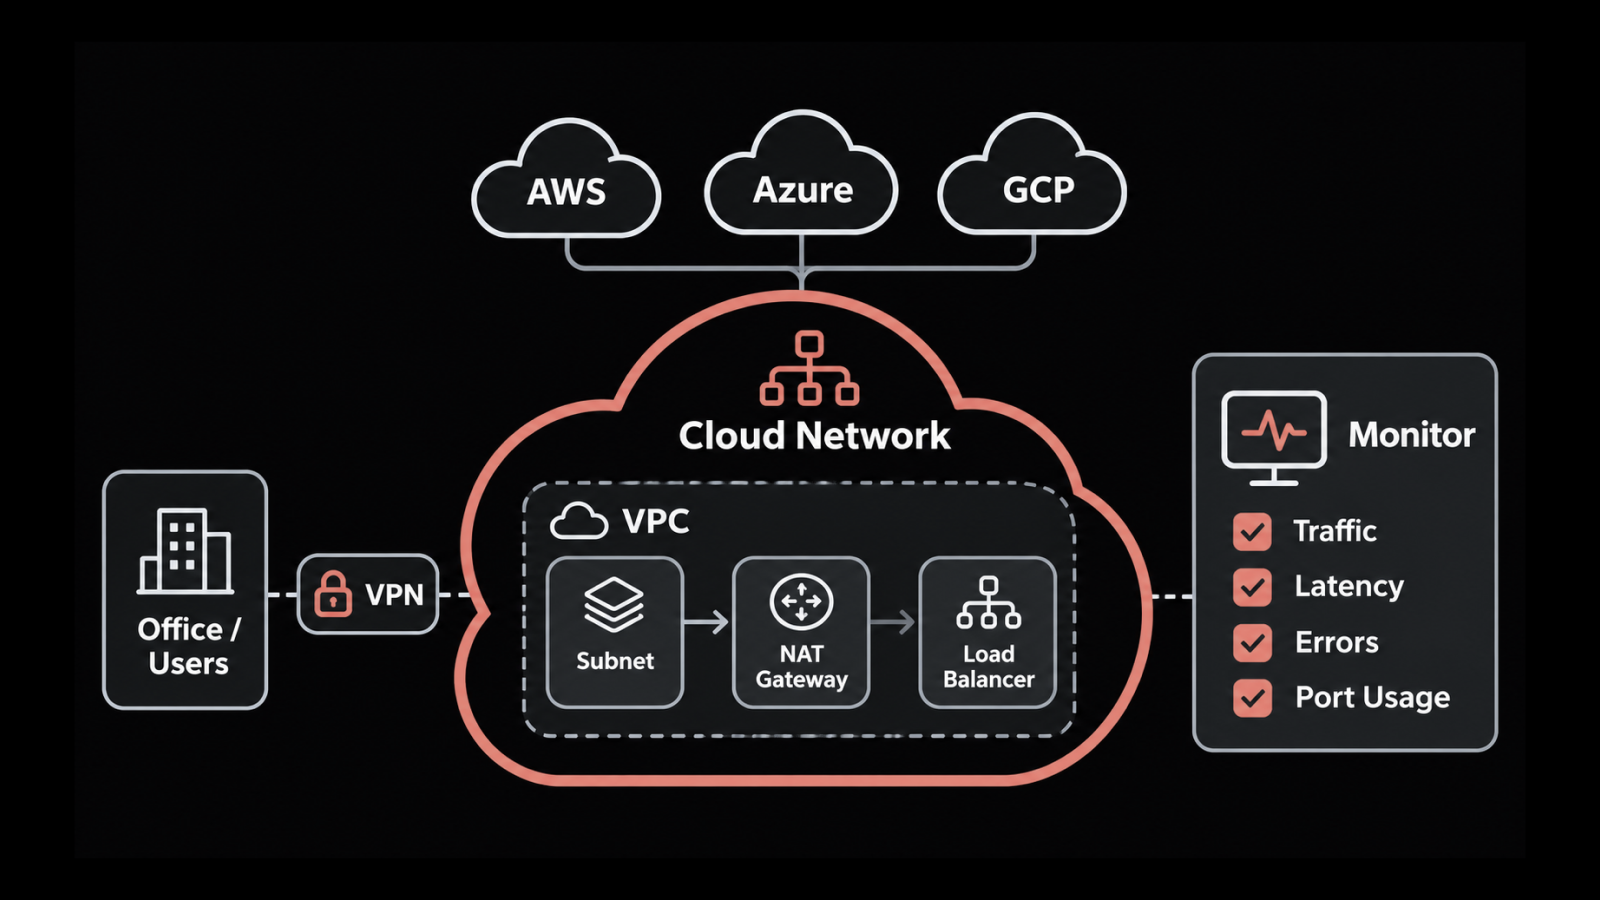
Cloud and WAN network diagram examples cover the parts of the network where you don't own the hardware, like a VPC in AWS or the broadband circuits between branch offices. With no rack to draw, they run almost entirely on logical detail.
7. Hybrid Cloud Network Diagram
The on-prem data center goes on the left, a cloud VPC on the right, and between them a site-to-site VPN or a private circuit like AWS Direct Connect.
That's a hybrid cloud diagram. Inside the VPC you'll draw public and private subnets in a couple of availability zones, an internet gateway, a NAT gateway and usually a load balancer.
Cloud and network teams usually draw it during a migration. The careful ones keep updating it afterward.
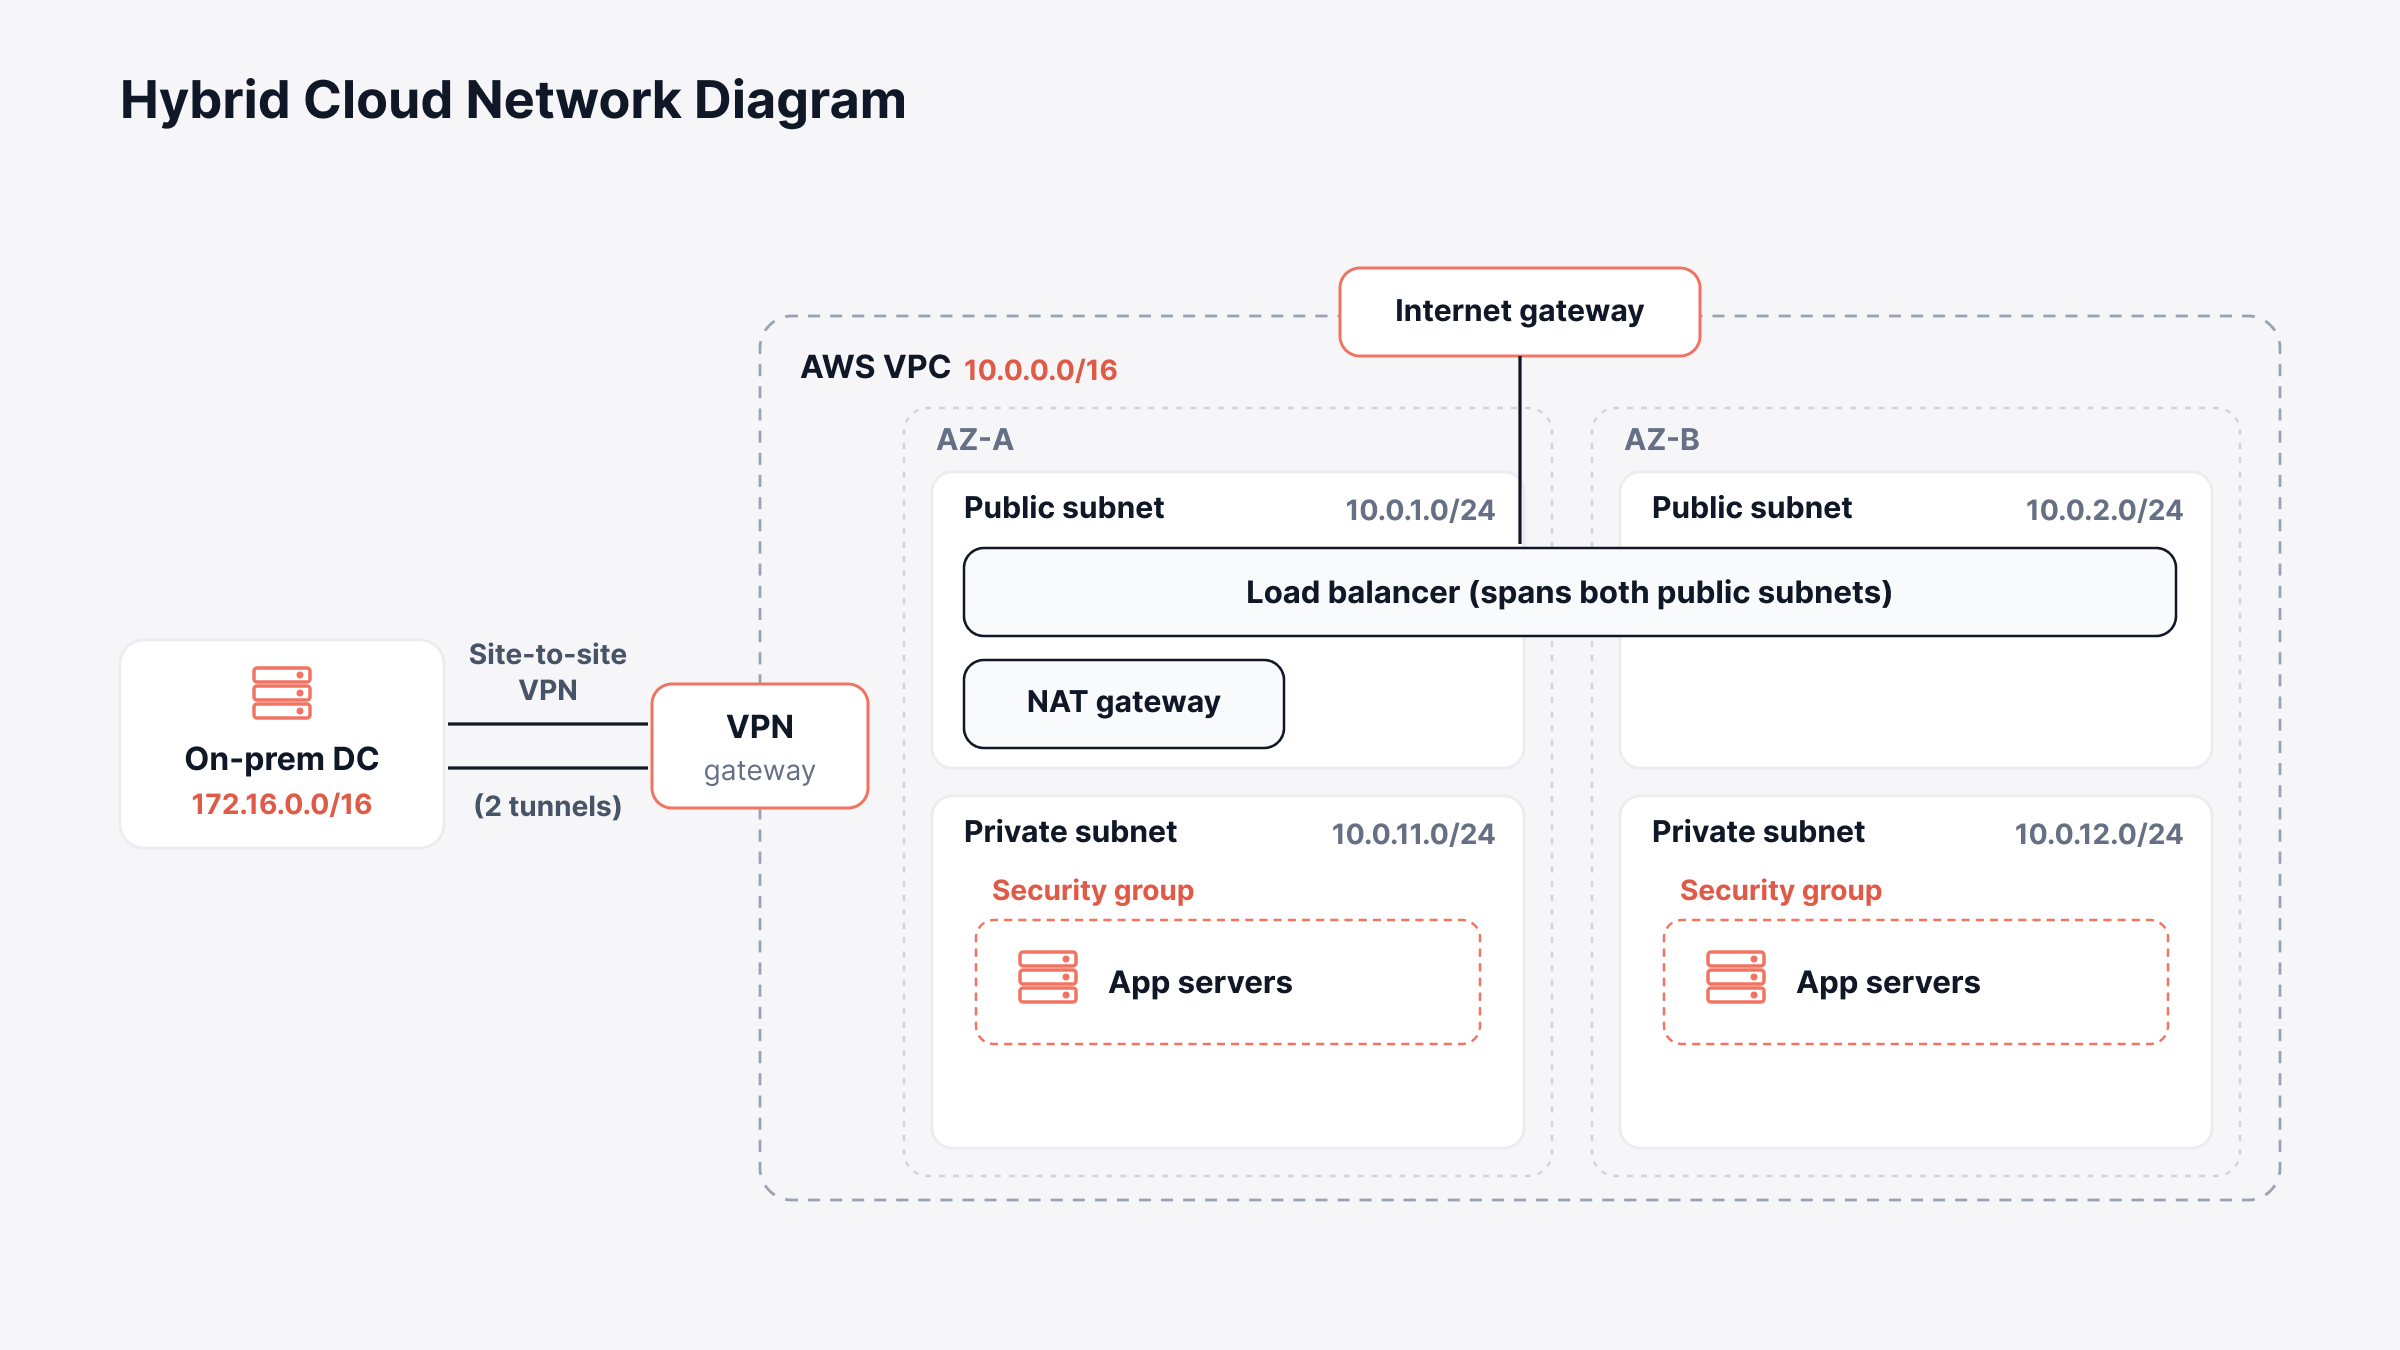
What to label: The VPC range and each subnet's range, which subnets are public, both VPN tunnel endpoints and the security groups on each tier.
Common mistake: Overlapping address ranges. If someone reused part of an on-prem range for the VPC, routes across the VPN stop working, and the cheapest place to notice is a page where both ranges sit next to each other.
8. Multi-Site SD-WAN Diagram
An SD-WAN diagram is really two drawings on top of each other. The bottom one is plumbing, meaning the MPLS, broadband or LTE links at each branch, data center and cloud on-ramp.
The top one is the overlay tunnels, with a controller off to the side pushing policy to every edge box. Teams with dozens of sites live by it, because the overlay hides most of the WAN and nobody remembers which branch is still hanging off a single broadband line.
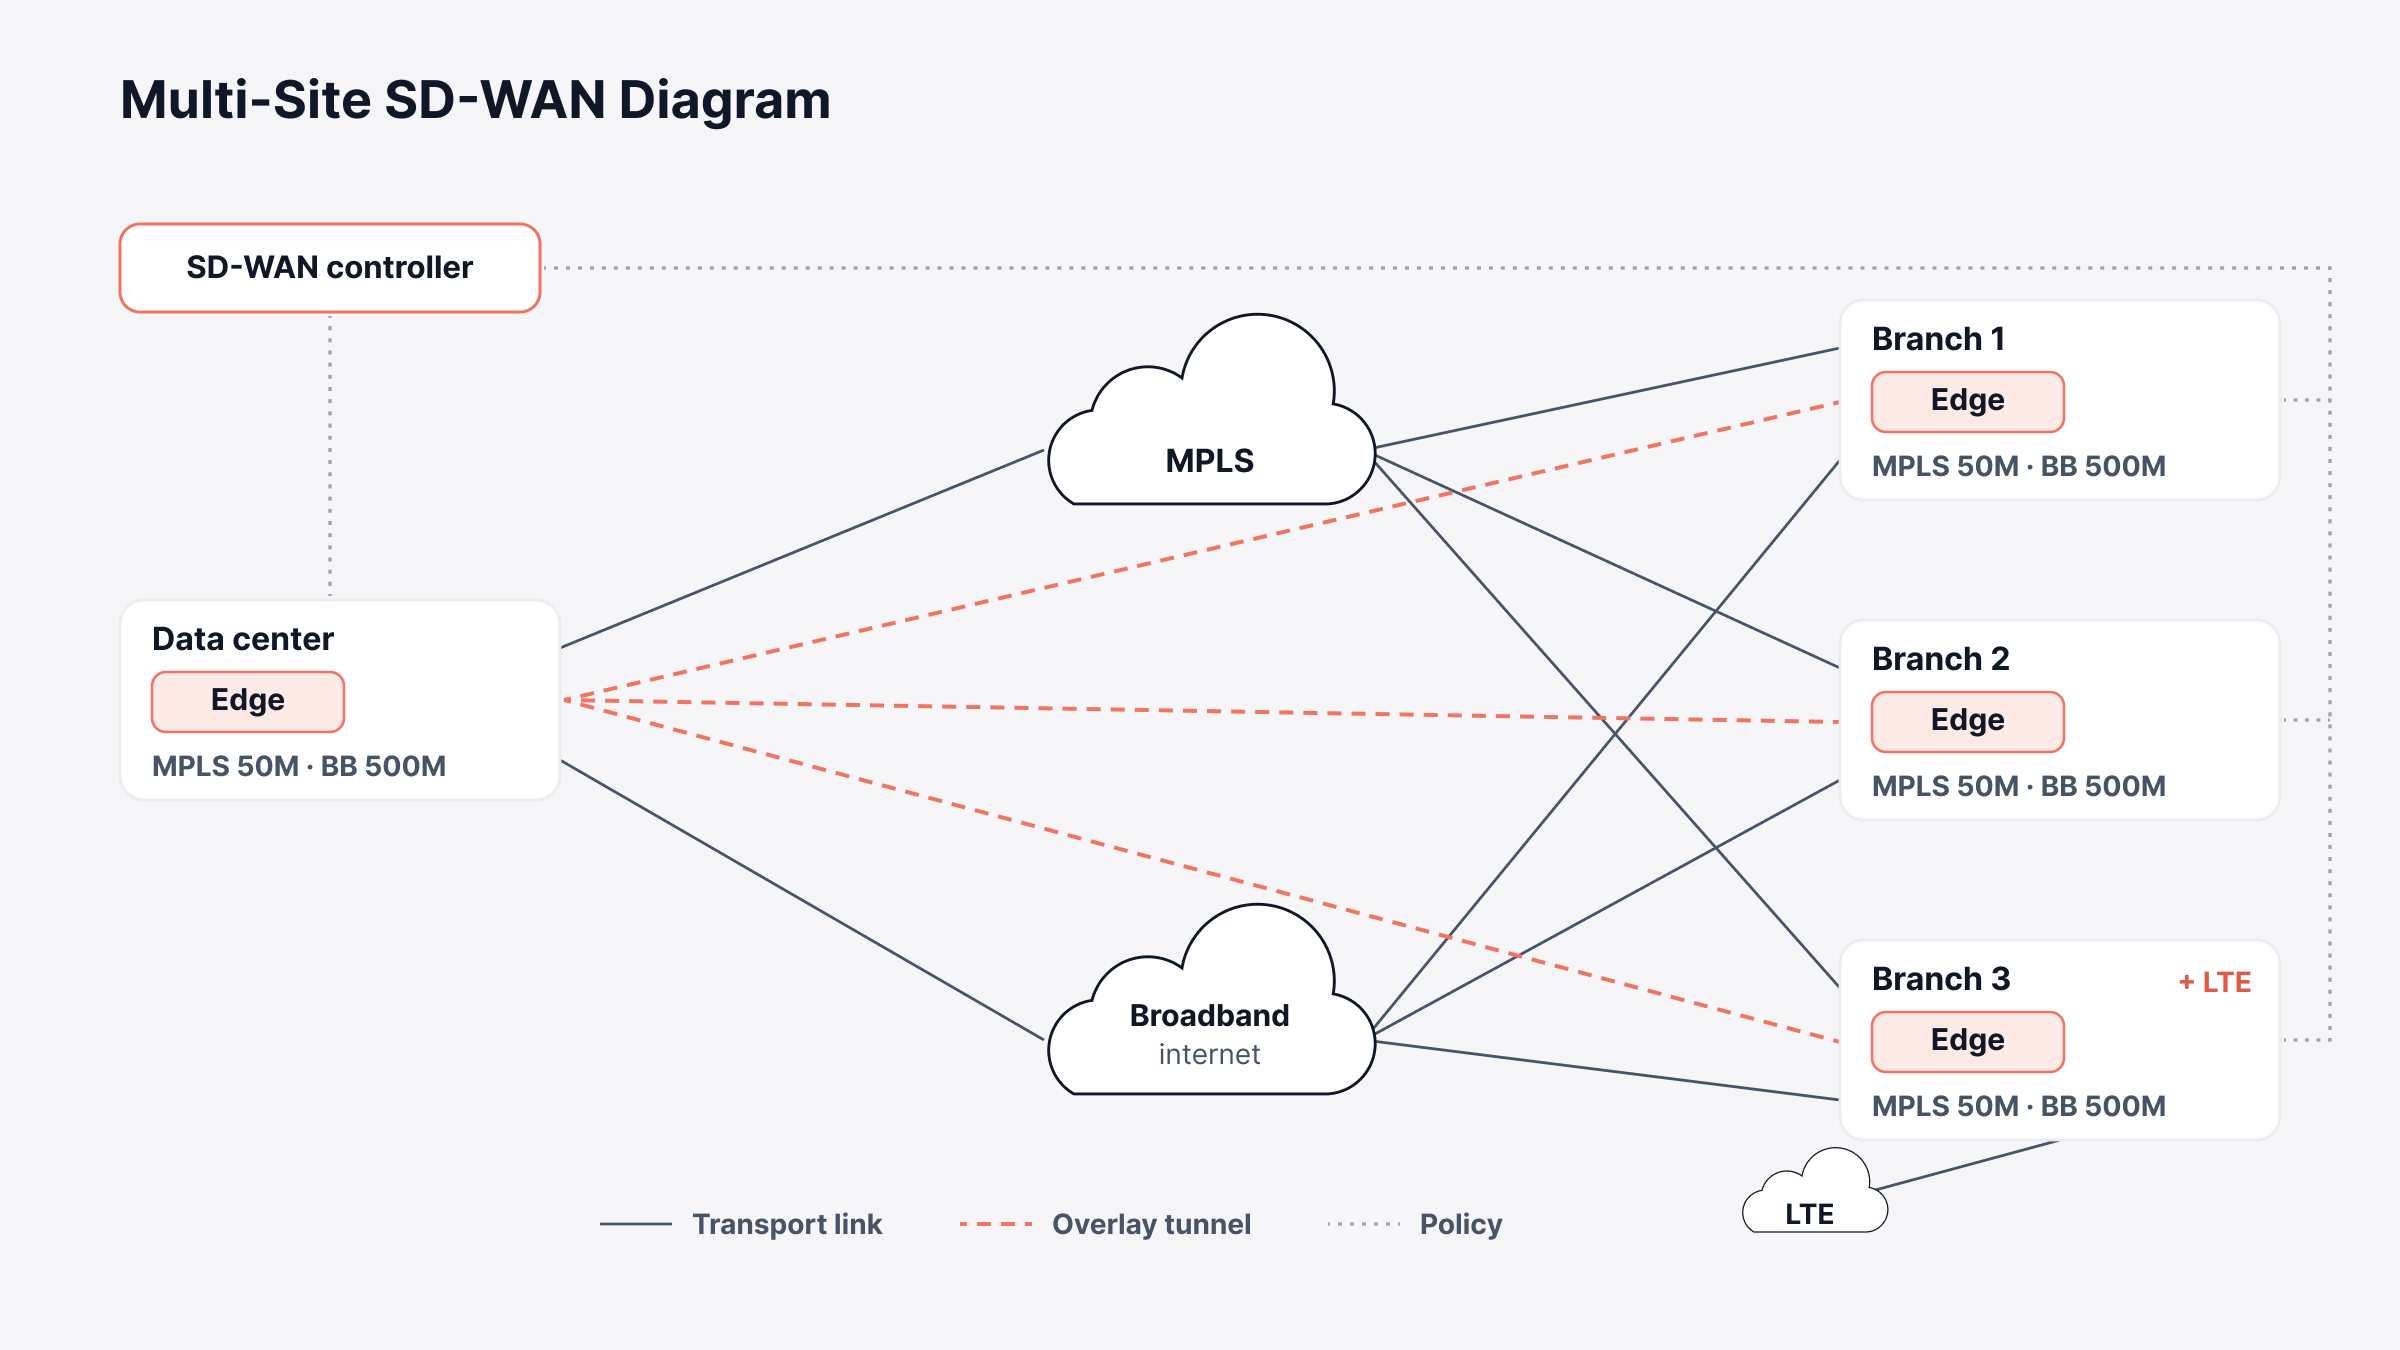
What to label: The transport type and speed on each link (MPLS 50M, BB 500M) and the edge device at every site. Then mark which tunnels exist and where each site breaks out to the internet.
Common mistake: Drawing transport links and tunnels with the same line. We use solid for managed links and dashed for tunnels, which is a common convention and also the way ObserveOps draws SD-WAN fabrics.
How to Draw a Network Diagram in 5 Steps
To draw a network diagram, begin with an actual device inventory, settle on one diagram type for one reader, and finish with labels and a date. Here's the order we'd go in:
Figure out who's going to read it, and the one question it has to answer for them.
Pull the device list from network discovery, since memory and last year's spreadsheet both miss things.
Choose physical or logical, and keep the two on separate pages.
Use one icon set and one line style per link type, then add the labels from the matching example above.
Put a date and an owner on it, and store it somewhere change tickets can link to.
Most people drawing by hand reach for Visio or draw.io. Network mapping tools go the opposite way and build the map from discovery data, which is where the next section picks up.
What Does a Discovered Topology Map Add to a Hand-Drawn Diagram?
A discovered topology map adds the three things hand-drawn diagrams lose first: links that are actually right, port-level labels and a recent date. Here's how ObserveOps builds one, going by the settings in our topology documentation.
1. Separate Layer 2 and Layer 3 Views From One Scan
Discovery starts from a seed device you pick. The Topology Scanner asks it who its neighbors are, asks each of those the same thing, and keeps going until no new devices show up.
A core or distribution switch makes the best seed because it can see the most. Layer 2 links come out of CDP, LLDP or switch port mapping, and Layer 3 links out of OSPF, BGP or IS-IS.
A Layer 3 toggle on the canvas shows or hides the routing devices. With it off, the canvas is a plain switching map, and with it on you get something close to the routing diagram in example 4, both pulled from that same scan.
2. Overlays for IP Addresses, Protocols and Interface Names
Three overlays add the labels people skip when drawing by hand. Show Node IP Address puts the IP under each hostname. With Show Link Protocol on, each link gets LLDP, CDP, BGP or OSPF printed on it, handy when a protocol you didn't expect shows up.
Then Show Interface Names labels both ends of a link with the port, which is how you end up seeing GigabitEthernet0/1 on one switch and GigabitEthernet1/2 on the next.
Clicking a link opens its interface names, status and in and out traffic. Since nodes are colored by health, the same map doubles as a status view during an incident.
3. Scheduled Scans and XML Snapshots Keep the Map Current
Scans can run once, daily, weekly or monthly, and our docs suggest low-traffic hours so the protocol queries stay light on the devices being asked.
Export As XML saves the current map to a file. That gives you a dated snapshot for an audit, or a copy to import into whatever documentation tool you already use.
4. Saved Views per Site, Plus Cloud and SD-WAN Maps
Create Topology View saves a filtered map by tag, group, IP or IP range, so a single scan can feed a Data Center North view and a separate Branch Offices view. Cloud, virtualization and SDN maps skip the scan entirely.
Once polling starts, ObserveOps maps AWS accounts by region, Azure subscriptions by resource group, vCenter and ESXi hosts with their VMs, and Cisco Catalyst SD-WAN and ACI fabrics, where solid lines mean controlled connections and dashed lines mean tunnels.
Hand-Drawn Gap | ObserveOps Setting | Closest Example |
Switching and routing mixed on one page | Layer 3 toggle | Layer 3 routing diagram |
Missing IPs and port names | Show Node IP Address, Show Interface Names | Enterprise architecture diagram |
No idea which protocol built a link | Show Link Protocol | Layer 3 routing diagram |
Diagram older than the network | Topology Scanner schedule, Export As XML | All of them |
One giant map nobody can read | Create Topology View with filters | Enterprise architecture diagram |
Tunnels drawn like circuits | SDN tab line styles | Multi-site SD-WAN diagram |
How ObserveOps Fits Into Your Network Diagrams
ObserveOps is the observability side of our unified observability and ITSM platform, and dynamic topology mapping is one piece of it. Because it's self-hosted, the scanner runs on your own servers and queries your devices over SNMP and the discovery protocols. ObserveOps Infinity is the current edition.
There's one limit worth planning around. A device appears on the map only if it's already set up as a monitor and supports at least one discovery protocol, which means unmanaged switches and patch panels never show up and the rack diagram in example 2 stays a hand-drawn job.
Draw One Diagram for Each Question Your Team Asks
We've found that the best network diagrams answer one question for one reader, and the 8 examples above cover most of the questions that come up, from which cable a technician should pull to which flows an auditor needs to trace.
Our pick for a first diagram is the Layer 3 routing one, since routing problems are the hardest to explain when nobody is looking at the same picture. If an audit is on the calendar, though, the security zones diagram should come first.
Put a date and a name on whatever you draw. Diagrams without an owner tend to go stale after a few change windows. Discovery can keep the device and link layer honest, and our roundup of network documentation software covers where to keep the diagrams once they're drawn.
FAQs
What should a basic network diagram include?
It should show every router, switch, firewall, server and access point, the links between them and the internet connection. We'd add hostnames, IP addresses and the date it was drawn too, since the next person has to decide whether to trust it.
What is the difference between a physical and a logical network diagram?
A physical diagram is about stuff you can touch, like which device is in which rack and which port connects to which. A logical one mostly ignores cables and follows data through subnets, VLANs, routing and security zones.
What is a network diagram in project management?
Project managers use the term for a chart of tasks and the dependencies between them, as in PERT charts or the critical path method. It has the same name as the IT kind, but there isn't a router or switch anywhere on it.
How often should a network diagram be updated?
Update it any time a change touches routing, VLANs, firewalls or site links, and give the whole thing a proper review every quarter. A daily or weekly discovery scan covers the device and link layer in between.
Author
Ramya Shah
Technical Writer
Ramya Shah is a technical content writer with a computer engineering background and roots in automotive journalism. He covers IT Service Management, observability, IT operations, and AI-driven automation. An early adopter of AI-assisted writing workflows, he turns complex IT processes into clear, engaging content optimized for search and answer engines (AEO), lifting content output and organic visibility.