10 Best Network Mapping Tools Compared
Every network mapping tool draws a picture. What matters is whether that picture is still true next week, after somebody swaps a switch in your network.
According to EMA's Network Management Megatrends 2026, only 32 percent of teams are completely satisfied with the tools they use to monitor and troubleshoot their networks.
In this blog, you will:
Compare 10 tools: On discovery protocols, refresh model and what the map connects to.
See real pricing: From free and open source up to five figures a year.
Read the honest cons: Including ours.
Match a tool to your estate: Using a decision guide instead of a feature count.
What Is Network Mapping?
Network mapping is the process of discovering the devices on a network and the connections between them, then rendering that as a diagram that keeps itself current.
The category splits into two jobs, which is why vendors sell network discovery and mapping tools as one bundle. A scanner sweeps an address range and reports what answers, so you learn what exists.
Network topology mapping tools go further. They read neighbor tables and routing protocols to work out what plugs into what, so you learn how the network is shaped.
Most teams need the second. Scanning is a subset of it, and the tools below split fairly cleanly along that line. If you want the underlying theory of shapes and arrangements, our guide to network topology covers it.
How We Evaluated These Tools
Mapping features look identical on a feature page. We compared these ten on four things that change what a tool is worth during an incident.
Discovery depth: Which protocols the tool reads. SNMP and ping find devices. CDP, LLDP and routing protocols like OSPF and BGP are what produce an accurate Layer 2 and Layer 3 map.
Refresh model: Whether the map rebuilds on a schedule, on demand, or only when someone remembers to click.
What the map is tied to: A drawing alone is documentation. A map carrying live device health, alerts and traffic is an operations tool.
Cost predictability: Per device, per sensor, per node or flat, and what happens to the bill when the estate grows.
Ratings come from G2 and Gartner Peer Insights. Pricing comes from each vendor's own published pages, and quote-based means the vendor publishes a model with no price attached.
The 10 Best Network Mapping Tools Compared
The table below sets the ten side by side on the four criteria above.
Tool | Best For | Discovery Protocols | Map Refresh | Tied To | Starting Price |
Motadata ObserveOps | Map on one platform with metrics, flows and tickets | SNMP, ICMP, CDP, LLDP, OSPF, BGP, IS-IS | Scheduled rediscovery | Monitoring, alerts, ITSM | Quote-based |
Auvik | MSPs and multi-site networks | SNMP, CDP, LLDP | Continuous | Monitoring, config backup | Quote-based |
SolarWinds NTM | A dedicated mapper with Visio export | SNMP, WMI, CDP, LLDP, ICMP | Scheduled scan | Standalone, or Orion modules | From $1,977 |
ManageEngine OpManager | On-premises estates on a tight budget | SNMP, WMI, CLI | Scheduled scan | Monitoring, ManageEngine suite | From $245 |
Paessler PRTG | Mixed estates that want one sensor model | SNMP, WMI, NetFlow, ping | Auto-discovery schedule | Monitoring, custom dashboards | $200/month, billed annually |
LogicMonitor | Hybrid estates wanting maps inside observability | SNMP, SSH, WMI, cloud APIs | Continuous | Monitoring, alerts, forecasting | Quote-based |
Domotz | Small networks and flat pricing | SNMP, ICMP, mDNS | Continuous | Monitoring, remote access | $35/collector/month |
NetBrain | Large enterprises needing path analysis | SNMP, CLI, SSH, cloud APIs | Scheduled benchmark | Automation runbooks, path analysis | Quote-based |
Nmap | Free scanning and port discovery | ICMP, TCP, UDP scanning | Manual run | Nothing; output is a scan | Free |
Zabbix | Open-source shops that want monitoring with maps | SNMP, ICMP, IPMI, agent | Discovery rules, manual layout | Monitoring, alerting | Free |
Detailed Overview of the Top 10 Network Mapping Tools
Each entry below covers what the tool maps, how the map stays current, and where it stops. Eight of the ten are automated network mapping tools that rebuild the topology on their own. The other two wait for you to start the run.
1. Motadata ObserveOps
Best for: Teams that want the topology map, the metrics behind it and the ticket that comes out of it on one platform.
Rating: G2 4.6/5, Gartner Peer Insights 4.6/5
Pricing: Quote-based. ObserveOps Infinity is metered per monitored device, with flow, log, NCCM, APM and RUM available as add-ons priced per source, never per gigabyte.
ObserveOps builds its map from protocol data, not from a drawing anyone maintains. Auto-discovery starts with SNMP and ICMP to find what is out there.
It then reads CDP and LLDP neighbor tables for the Layer 2 picture, and OSPF, BGP and IS-IS route tables for Layer 3. Scheduled rediscovery keeps the map current as branches and cloud extensions get added.
The platform underneath is what separates it from a dedicated mapper. Metric monitoring, flow analysis, log management and configuration management sit on the same system, so a node on the map opens onto the data that explains it.
Topology dependencies also drive alert correlation. A failing distribution switch shows up as one root-cause alert instead of thirty downstream ones, and Motadata reports a 60 percent drop in false positives from that suppression.
It all runs as part of a unified observability and ITSM platform. The ticket that follows an outage carries the same topology context.
Star ratings only tell you so much. It helps to check out a team’s review that runs ObserveOps for network mapping among other tasks.
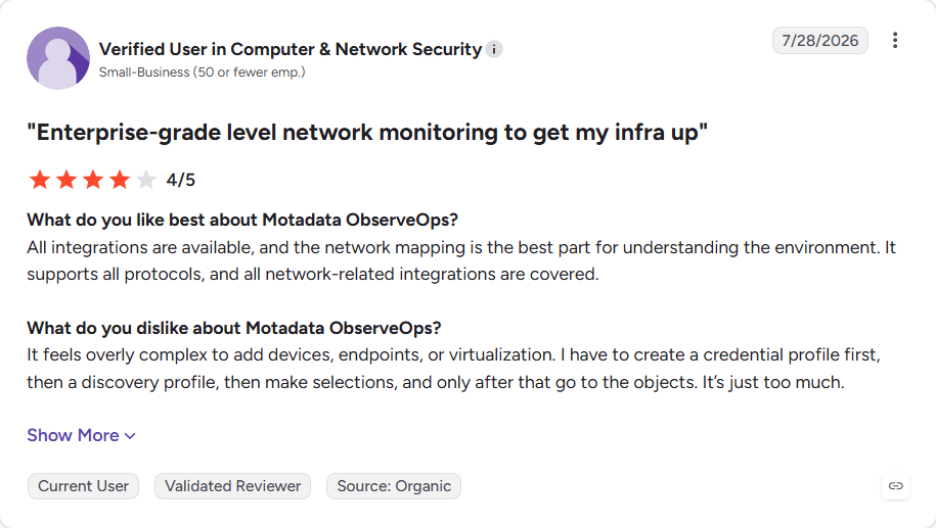
Read more ObserveOps reviews on G2.
Pros
- The map is part of a monitoring platform, so you are not reconciling two tools
- Per-source licensing on flow and log add-ons keeps the bill predictable as data volumes grow
- Six deployment modes, including fully on-premises for regulated estates
Cons
- The licensing model is published but the prices are not, so budgeting starts with a sizing conversation
- The Infinity edition reached general availability in August 2026, so its field track record is shorter than the incumbents here
- If all you need is a diagram to hand an auditor, a full observability platform is more than the job requires
2. Auvik
Best for: MSPs and IT teams running many sites who want maps without managing a server.
Rating: G2 4.5/5, Gartner Peer Insights 4.6/5
Pricing: Quote-based, priced per billable device.
Auvik is cloud-hosted network management with mapping at its center. A collector on each site discovers devices over SNMP, CDP and LLDP, and the topology updates continuously as things change.
Maps carry live device health and traffic. Configuration backup runs alongside, so a device's map entry links to its config history.
Service providers come for the multi-tenant console, since one login covers every client network. Pricing scales per device on a quote, so model it before you commit on a large estate.
Pros
- Fast setup, often mapping a site within an hour
- Strong multi-site and multi-tenant handling
- Configuration backup and traffic analysis included
Cons
- No published price list, and per-device costs add up across large estates
- Cloud-only, which rules it out for fully air-gapped networks
- Coverage beyond the network layer is thinner than a full observability platform
3. SolarWinds Network Topology Mapper
Best for: Teams that want a dedicated mapper and exportable diagrams, with monitoring handled elsewhere.
Rating: G2 4.3/5, Gartner Peer Insights 4.4/5
Pricing: From $1,977 as a perpetual licence.
Network Topology Mapper is one of the few tools here built only to map. A single scan over SNMP, WMI, CDP, LLDP and ICMP produces multiple views covering both Layer 2 and Layer 3.
Exports go to Visio, PNG and PDF. For compliance documentation and audit packs, that export path is the reason teams buy it.
Scans run on a schedule and detect changes between runs. Scope is the catch, because NTM documents the network without monitoring it.
Most teams pair it with SolarWinds Observability or another platform. Our Motadata vs SolarWinds comparison covers how the wider stacks differ.
Pros
- Purpose-built for mapping, with mature multi-layer discovery
- Visio, PNG and PDF export for documentation and audits
- Perpetual licence, so no annual renewal
Cons
- Mapping only, so no live health or alerting on the map itself
- Windows-only installation
- Another SolarWinds module to license if you also want monitoring
4. ManageEngine OpManager
Best for: On-premises networks that need monitoring and mapping at the lowest entry price here.
Rating: G2 4.5/5, Gartner Peer Insights 4.4/5
Pricing: Standard edition from $245 for 25 devices.
OpManager discovers devices over SNMP, WMI and CLI. It builds topology and business views that update as devices are added or removed. Layer 2 maps come from the discovery data, and the maps carry device status so they double as a NOC view.
The price and the surrounding catalog are the draw. If you already run ServiceDesk Plus or ADManager, OpManager slots into the same ecosystem.
That breadth costs setup time, which reviewers consistently raise on larger deployments. See our Motadata vs ManageEngine comparison for the platform-level differences.
Pros
- Lowest published entry price of the commercial tools here
- Monitoring, mapping and alerting in one product
- Integrates with the wider ManageEngine suite
Cons
- Setup and tuning take longer than cloud-hosted rivals
- Interface feels dated next to newer platforms
- Add-on modules are needed for flow, config and application coverage
5. Paessler PRTG
Best for: Mixed estates that want one licensing model across network, server and application checks.
Rating: G2 4.6/5, Gartner Peer Insights 4.6/5
Pricing: PRTG 500 at $200 per month, billed annually.
PRTG monitors everything through sensors, and mapping is a designer on top of that data. Auto-discovery finds devices over SNMP, WMI and ping.
You then build interactive maps by dragging live sensor objects onto a canvas. The result sits closer to a custom dashboard than an auto-generated topology, which suits teams who want a specific view of a specific site.
Model the sensor licensing carefully, since each monitored aspect consumes one. Our breakdown of PRTG pricing works through how sensor counts translate into device counts, and the Motadata vs PRTG comparison covers the platform differences.
Pros
- One sensor model covers network, server, cloud and application checks
- Highly customizable maps and dashboards
- Free tier for up to 100 sensors
Cons
- Maps are hand-built, not auto-generated topology
- Sensor counting makes costs hard to predict as the estate grows
- Managing thousands of sensors gets unwieldy
6. LogicMonitor
Best for: Hybrid estates that want topology maps inside a wider observability platform.
Rating: G2 4.5/5, Gartner Peer Insights 4.5/5
Pricing: Quote-based, priced per monitored resource.
LogicMonitor is SaaS observability with automated network discovery and dynamic topology mapping across on-premises, cloud and SD-WAN environments.
Maps show device relationships and dependencies. The platform holds metrics, logs and alerts together, so the topology doubles as the context for root cause work.
Dependency data drives alert correlation, so a single upstream failure collapses a wall of downstream alerts. The trade is setup effort. Reviewers consistently note that thresholds and integrations need tuning before the signal-to-noise ratio settles.
Pros
- Maps sit beside metrics, logs and alerts in one platform.
- Broad device and cloud coverage out of the box.
- Scales comfortably into large hybrid estates.
Cons
- No published pricing, and per-resource costs climb at scale.
- Alert thresholds and integrations take time to tune.
- SaaS delivery limits its fit for air-gapped networks.
7. Domotz
Best for: Small networks, and anyone who wants a flat monthly price instead of a quote.
Rating: G2 4.8/5, Gartner Peer Insights 4.6/5
Pricing: $35 per collector per month, or $1.50 per managed device per month in bundles of ten.
Domotz runs a lightweight collector on each network that discovers devices and draws topology continuously. Remote access, power management and diagnostics sit alongside the map, which is why MSPs use it for smaller client sites where a full platform would be overkill.
Pricing here is the clearest on this list, with no tiers and no feature gating. The limits show up at scale and depth, because Domotz targets visibility and remote hands over deep performance analytics.
Pros
- Published flat pricing with no feature gating
- Deploys in minutes with no firewall reconfiguration
- Remote access and power control built in
Cons
- Analytics are shallower than enterprise platforms
- Collector-per-network model adds up across many small sites
- Limited Layer 3 and routing protocol discovery
8. NetBrain
Best for: Large enterprises that need path analysis and repeatable troubleshooting across a complex estate.
Rating: G2 4.4/5, Gartner Peer Insights 4.5/5
Pricing: Quote-based, positioned at the enterprise end of this list.
NetBrain builds a live model of the network instead of a picture of it. Discovery over SNMP, CLI and cloud APIs produces Layer 2 and Layer 3 topology, including overlay and underlay relationships. The model refreshes on a scheduled benchmark, so each run captures the current state.
Path analysis is what NOC teams actually buy it for. You pick a source and a destination, and it calculates the hop-by-hop path through the live configuration.
That turns a long CLI session into a single query. No-code runbooks then automate the diagnostic steps around it.
Pros
- Path analysis and impact assessment go deeper than any other tool here.
- Automation turns tribal troubleshooting knowledge into shared runbooks.
- Built for scale, with large multi-vendor estates in mind.
Cons
- Enterprise pricing puts it out of reach for small and mid-sized teams.
- Implementation is a project, not an afternoon.
- Considerable overkill if you only need a current diagram.
9. Nmap
Best for: Free scanning when you need to know what is answering on a subnet.
Rating: G2 4.6/5, Gartner Peer Insights not rated
Pricing: Free and open source.
Nmap is the original network mapper, and its name is why most searches for the term land there. It sweeps address ranges, identifies live hosts, fingerprints operating systems and enumerates open ports. For security auditing and quick inventory checks, nothing else is as fast to reach for.
Be precise about where it stops. Nmap reports what exists at an address, not how devices connect, and its output is a result file, never a maintained map.
Zenmap adds a GUI and a basic topology view. Reading a switch's neighbor table is still outside its job.
Pros
- Free, scriptable and available everywhere
- Unmatched for port and service discovery
- Huge community and script library
Cons
- Scans a range without charting how devices interconnect
- Output is a point-in-time result with no refresh
- Command-line first, with a learning curve for new users
10. Zabbix
Best for: Open-source shops that want monitoring, alerting and maps without a licence.
Rating: G2 4.3/5, Gartner Peer Insights 4.5/5
Pricing: Free and open source, with paid support subscriptions available.
Zabbix is a mature monitoring platform with network maps built in. Discovery rules find devices over SNMP, ICMP, IPMI and its own agent, and auto-registration adds them with no manual entry.
Maps then show those hosts with live status. You can link a map element to a trigger, so the diagram reflects real state.
Map layout is the honest limitation. Zabbix expects you to place and connect elements yourself, so it never derives topology from neighbor tables the way a dedicated mapper does.
You get control and zero licence cost. The price is the hours it takes to build and maintain the layout.
Pros
- No licence cost at any scale.
- Monitoring, alerting and maps in one open-source package.
- Commercial support available when you want it.
Cons
- Map layouts are built by hand, not derived from neighbor tables.
- Initial configuration takes real time and expertise.
- You own the server, the database and the upgrades.
What Should You Look for in a Network Mapping Tool?
The must-have features of network mapping tools come down to five criteria. They separate a tool you will still be using in two years from one that becomes another stale diagram.
1. Discovery That Reads Neighbor Tables
A tool that only pings a range gives you an inventory, never a topology. Look for CDP and LLDP at minimum, and routing protocol discovery if you run more than one Layer 3 domain. That gap is the single biggest difference between a scanner and a mapper.
2. Automatic Refresh You Do Not Have to Trigger
Ask how the map updates and what happens between updates. Automatic network topology mapping tools rebuild on a schedule, which covers most estates. Manual refresh leaves the map accurate on the day someone remembers, which is the problem you set out to solve.
3. Live State on the Map, Beyond Structure
The most useful visual network mapping tools carry live device health. That turns thirty downstream alerts into one root cause at a glance. Without it, you cross-reference a drawing against a separate dashboard during the exact minutes you can least afford to.
4. Coverage Beyond the Switch Closet
Most estates now span on-premises, cloud and virtualized infrastructure. Check whether cloud resources and virtual machines appear on the same canvas or in a separate tool, because network visualization that stops at the physical layer leaves half the estate undrawn.
5. Deployment That Matches Your Estate
Check what the tool runs on before you shortlist it, because platform rules out more candidates than features do.
Windows: SolarWinds NTM and OpManager both install on Windows Server. Network mapping tools for Windows shops are well covered.
Linux: Nmap and Zabbix are the obvious Linux network mapping tools, and both run happily on a small VM.
Open source: Nmap and Zabbix are the two open source network mapping tools here, with community support in place of a contract.
Cloud-hosted: Auvik, Domotz and LogicMonitor need no server of your own. Cloud-based network topology mapping tools suit teams with no appetite for another appliance.
6. Licensing That Survives Growth
Model the bill at twice your current size before you sign. Per-sensor and per-node models climb steeply, and the cost of adding the next site should never be the reason a map goes unmaintained.
Which Network Mapping Tool Is Right for Your Team?
Match the tool to your situation, not to a feature count.
Your Situation | Start With | Why |
You already run separate tools for monitoring, logs and tickets | Motadata ObserveOps | The map, the telemetry behind it and the resulting ticket sit on one platform |
You manage many client networks | Auvik | Multi-tenant console built for that workflow |
You need exportable diagrams for an audit | SolarWinds NTM | Purpose-built mapper with Visio and PDF export |
Budget is the binding constraint and you are on-premises | ManageEngine OpManager | Lowest published entry price with monitoring included |
You run a large multi-vendor estate and troubleshoot paths daily | NetBrain | Hop-by-hop path analysis and automation runbooks |
Your sites are small and you want a published price | Domotz | Flat monthly pricing with no quote and no feature gating |
You need an answer in the next ten minutes | Nmap | Free, fast and already installed on most admin machines |
Whichever way you lean, run the trial against a real site, never a lab. The gap between tools shows up in how they handle the messy parts of an estate.
These gaps could be an unmanaged switch, a device that does not speak LLDP, or the VLAN nobody documented.
Two questions settle most shortlists. Does the map refresh without anyone remembering to trigger it, and does it carry live state or only structure? A tool that answers yes to both will still be in use in two years.
Pick the Right Network Mapping Tool for Your Business
The tools on this list differ less in what they can draw than in what keeps the drawing true a month later. Discovery depth and refresh model decide that. Both are easy to test in a trial and expensive to fix after you buy.
No single tool wins outright. A dedicated mapper produces better documentation, an open-source stack costs nothing but your time, and a platform earns its place only if you were going to consolidate monitoring anyway.
The outcome worth avoiding is a third diagram nobody trusts. Tie the map to the system that already knows when a device changes, whether that means your monitoring platform or a scheduled scan, and network documentation stops being the task that never gets done.
FAQs
What is the difference between a network mapper and a network scanner?
A scanner such as Nmap sweeps an address range and reports which hosts and ports answer. A mapper reads neighbor tables and routing data to work out how devices connect, then renders that as a topology. Most teams end up running both.
What are the best free network mapping tools?
Nmap and Zabbix lead the free network mapping tools. Nmap handles scanning, and Zabbix covers monitoring with maps. Both are open source, and each trades money for time, since you run the infrastructure yourself.
How often should a network map be refreshed?
Daily is right for most estates, and weekly is the minimum where change is slow. In ObserveOps, the topology scanner runs on a schedule you set, so the map reflects last night's changes instead of last quarter's.
Can network mapping tools map cloud infrastructure?
Some can. Cloud-based network topology mapping tools vary widely here. Motadata ObserveOps builds a separate cloud and virtualization topology covering AWS, Azure, hyper-converged and SDN components, while tools built only for Layer 2 discovery stop at the switch closet.
Is Motadata ObserveOps a good network mapping tool?
It fits teams who want the map attached to the data that explains it. Discovery covers Layer 2 and Layer 3, the map refreshes on a schedule, and topology dependencies feed alert correlation. If you only need an exportable diagram, a dedicated mapper weighs less.
Author
Ramya Shah
Technical Writer
Ramya Shah is a technical content writer with a computer engineering background and roots in automotive journalism. He covers IT Service Management, observability, IT operations, and AI-driven automation. An early adopter of AI-assisted writing workflows, he turns complex IT processes into clear, engaging content optimized for search and answer engines (AEO), lifting content output and organic visibility.