What Is a Network Topology Diagram? Types, Examples and How to Build One That Stays Current
Most network diagrams are accurate exactly once: the day they are finished. The network keeps changing, the drawing does not, and the gap shows up during the next outage.
According to the Uptime Institute Annual Outage Analysis 2026, failure to follow established procedures remains the leading driver of human-error outages.
A wrong diagram is how a right procedure hits the wrong port. The fix is a network topology diagram that matches the live network topology.
In this blog, you will:
Define the network topology diagram: And separate it from physical and architecture drawings.
Learn what a network architecture diagram shows: Zones, tiers, trust boundaries.
Build one in five steps: From audience to verified date.
Keep it current: With conventions that slow decay and discovery that ends the redrawing.
By the end, you will know which diagram to draw by hand and which to leave to discovery.
What Is a Network Topology Diagram?
A network topology diagram is a visual map of the devices on a network and the connections between them. It shows which switch, router, firewall and server links to which, and by what path.
The definition is the easy part. The harder question asks what the diagram is for, because the answer changes what belongs on it.
A diagram drawn to win budget approval needs three boxes and an arrow. A diagram drawn for an on-call engineer at an unusual time needs interface names and IP addresses, plus the path traffic takes when the primary link drops.
Both count as network diagrams. Neither works in the other's place.
Before drawing anything, answer one question: who opens this, and what decision are they making? The three most common answers are troubleshooting an outage, planning a change, and onboarding someone new.
Diagrams built without a named audience end up serving none of them. Companies pile up folders of Visio files nobody trusts that way.
What Are the Different Types of Network Diagram?
Three types cover almost every practical need. Mixing them is the most common reason a diagram becomes unreadable, and we see it on most first drafts. The table below separates them.
Type | Shows | Answers the question | Primary audience |
Physical | Cabling, ports, racks, device locations | What plugs into what, and where is it? | Field and data center engineers |
Logical (topology) | Subnets, VLANs, routing, traffic paths | How does traffic get from A to B? | Network engineers, on-call |
Architecture | Zones, tiers, services, trust boundaries | How is this system designed? | Architects, security, leadership |
A physical diagram describes reality as it is cabled. It carries rack and room identifiers, device models, port numbers and media types.
Its value is that someone can walk into a room holding it and find the right cable.
A logical diagram is the one most people mean by topology diagram.
It ignores where things physically sit and shows how traffic actually flows, such as VLANs, subnets, gateways, routing boundaries and firewall policies.
Two servers in the same rack may sit in different security zones, and only the logical diagram shows that.
An architecture diagram sits one level higher again, and it differs enough to deserve its own section.
What Is a Network Architecture Diagram?
A network architecture diagram shows the overall design of a network: its tiers, zones, trust boundaries and the services that run across them.
Where a topology diagram shows what connects to what, an architecture diagram shows how the system is structured and why.
The distinction confuses people because the two overlap, and it took us a while to settle it ourselves. We use one test. If removing a device from the drawing would change the design's shape, it belongs in the architecture diagram.
If it would just remove one box from a list, it belongs in a topology or physical diagram. Architecture diagrams leave out individual devices in favor of the roles they play.
A typical enterprise network architecture diagram includes:
Zones and trust boundaries: Internet edge, DMZ, internal and management, with the firewall policy points between them drawn explicitly.
Tiers: Usually core, distribution and access, or spine and leaf in a data center design.
Site and WAN structure: How branches reach the core across the WAN, and which transports carry which traffic.
Redundancy as intent: Two links between tiers say this path is designed to survive one failure, without naming the interfaces.
External dependencies: Cloud regions, SaaS platforms and carrier handoffs.
Cloud and hybrid environments make the architecture diagram more valuable. A VPC, its subnets, its peering relationships and its route tables have no physical form anyone can photograph. The drawing is the only representation that exists.
The common failure is scope creep. An architecture diagram that starts listing switch hostnames has quietly become a topology diagram with the wrong name.
It now goes out of date at the speed of the access layer instead of the speed of the design.
What Should a Network Topology Diagram Include?
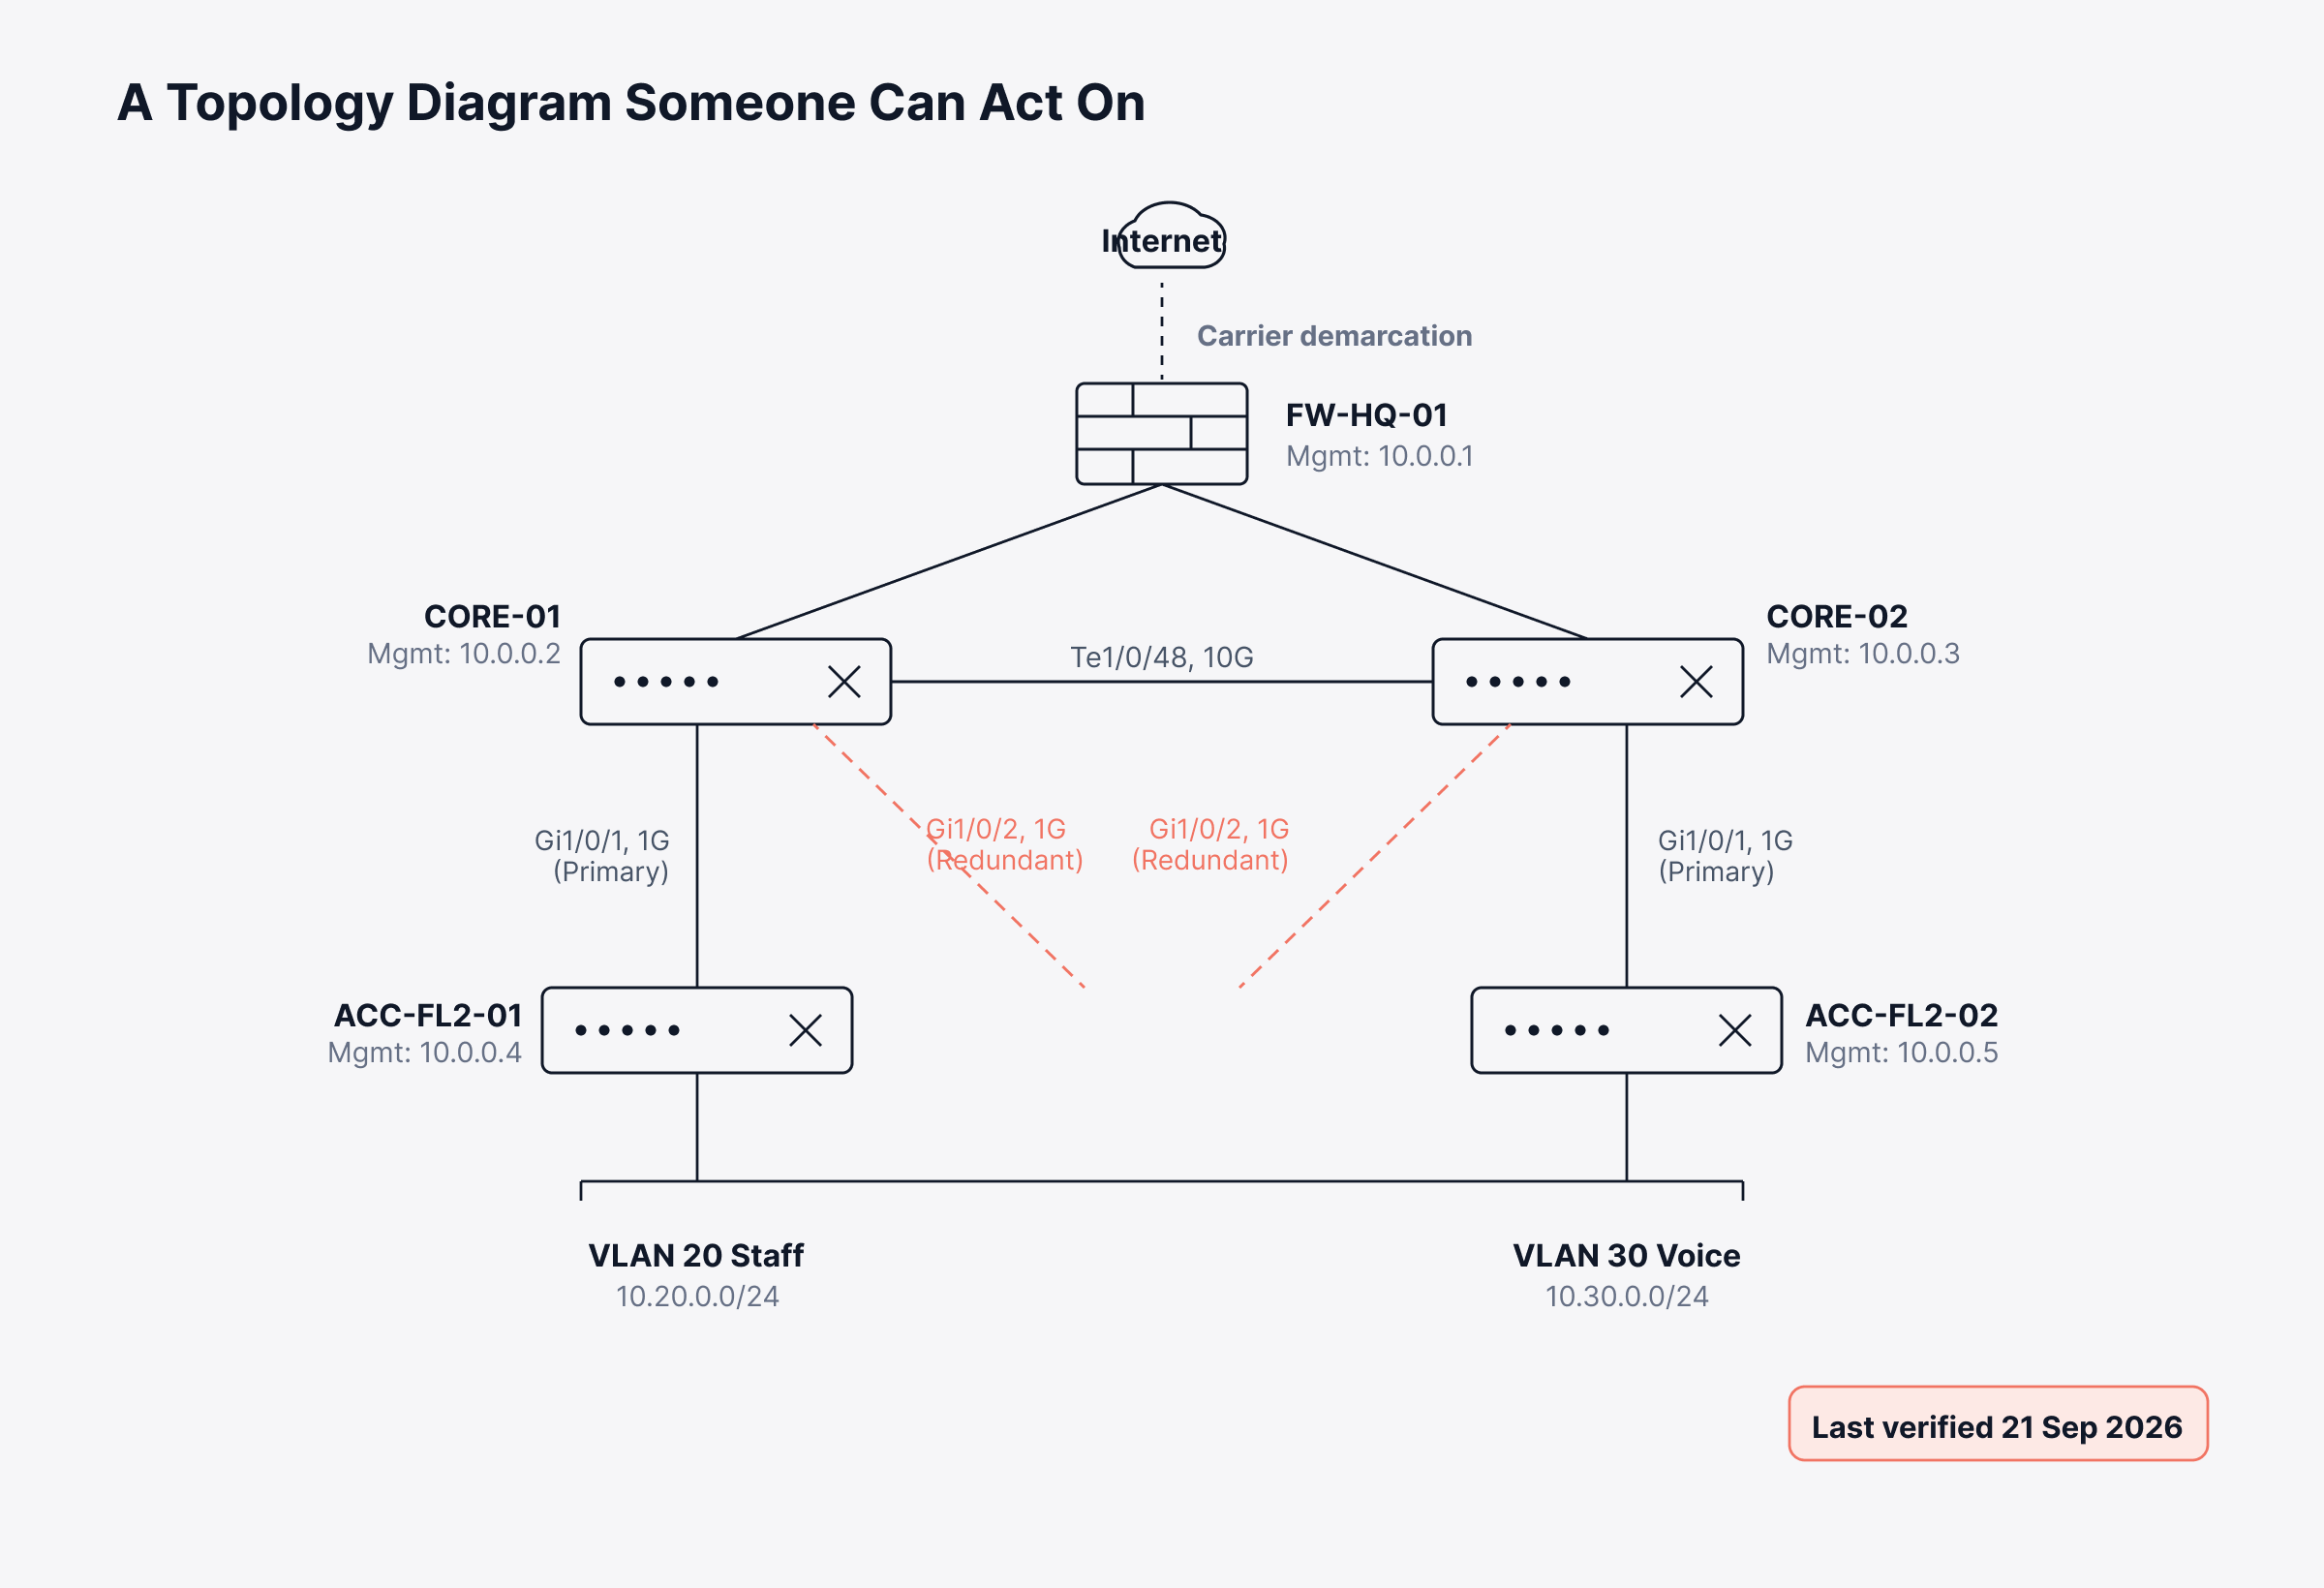
A network topology diagram earns its place when someone can act on it without opening another system.
For a topology diagram used in operations, include the following:
Device hostnames: Matching what appears in monitoring and in DNS, never friendly nicknames.
Management IP addresses: So an engineer can connect without a lookup.
Interface identifiers on each link: Because the link to the core is not actionable at odd times.
Link speeds and media: Where capacity questions get settled.
VLAN IDs and subnets: On each segment.
Redundant paths: Clearly distinguished from primary ones.
Demarcation points: Marking where your responsibility ends and a carrier's begins.
A last-verified date: Which matters more than everything above it.
Leave out anything you are not willing to maintain. Every field on a diagram is a promise to update it. An out-of-date detail does more harm than an absent one, because people believe it.
How Do You Create a Network Topology Diagram?
Building a topology diagram runs in five steps, and the first two decide whether the result gets used or filed.
1. Name the Audience and the Decision
Write down who opens this diagram and what they are trying to decide. An on-call engineer, a change approver and a new hire need three different drawings. Pick one, and let the other two reference it.
2. Inventory the Network From Discovery, Not Memory
Run a network discovery against the live estate and use its output as the device and link list. Memory and the previous diagram both lie.
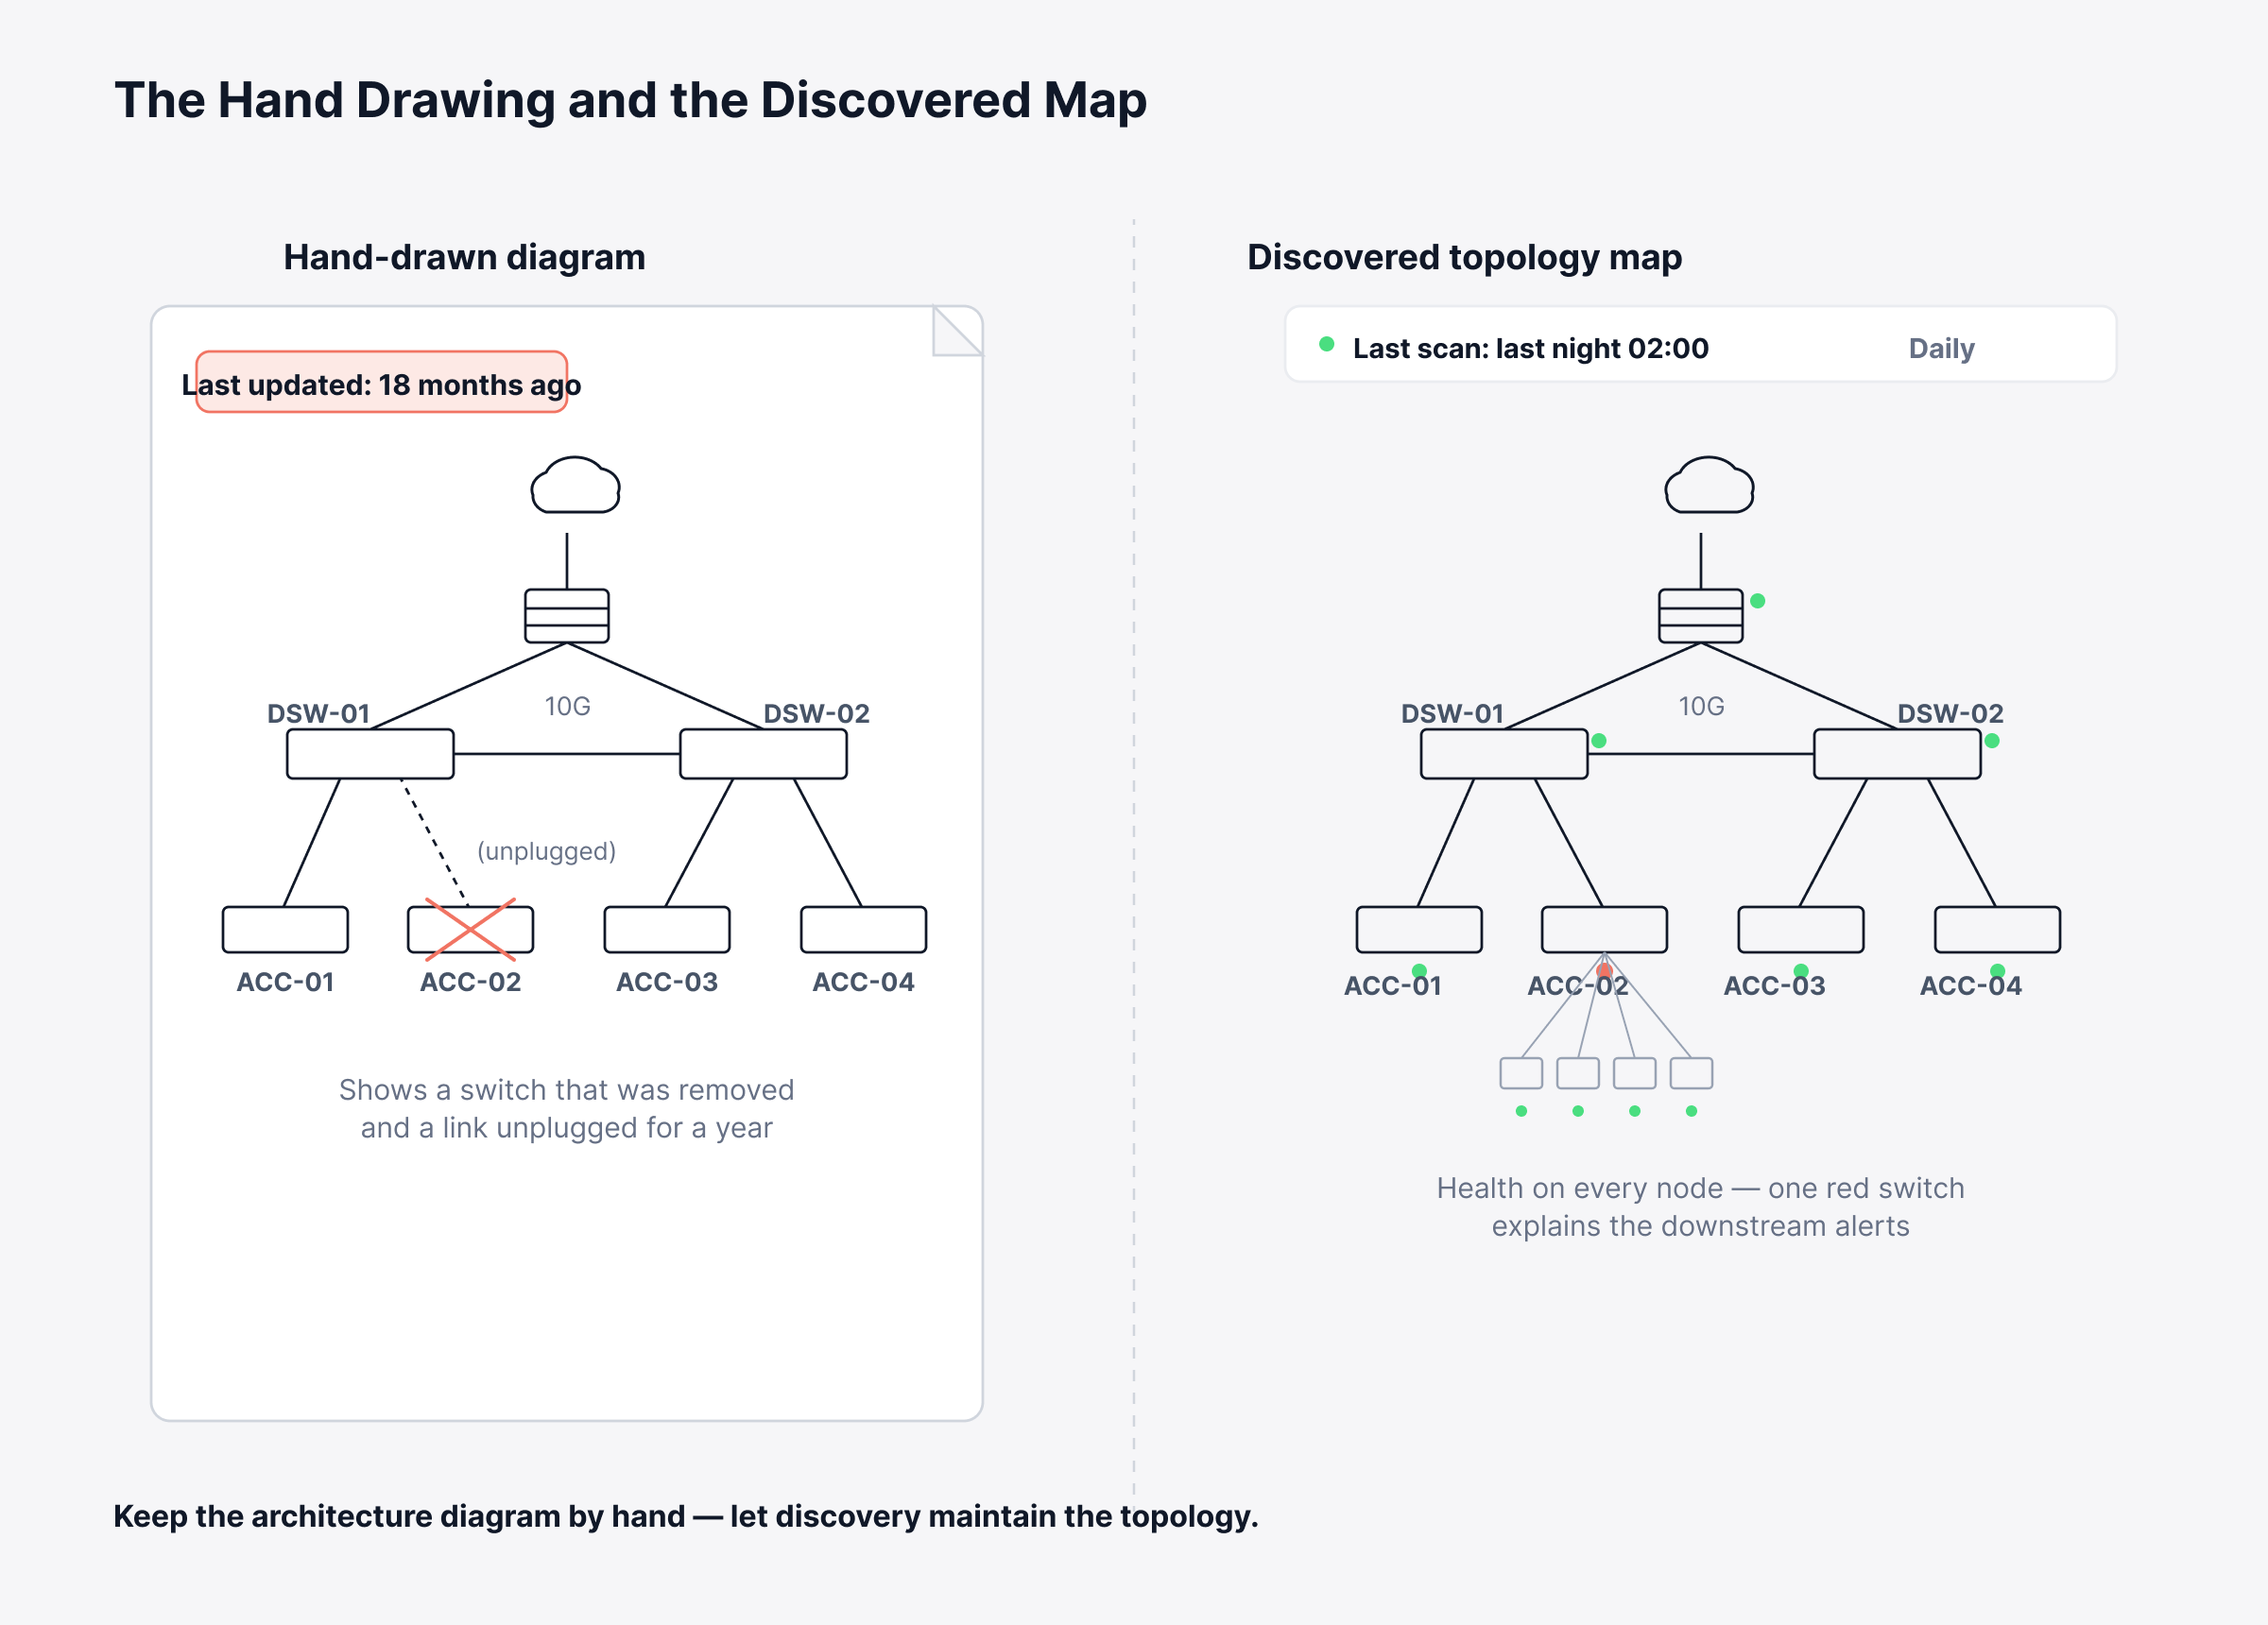
On one 40-site assessment we ran, discovery turned up 14 switches nobody had recorded. The old drawing also showed two uplinks that had been unplugged for a year.
3. Choose the Type and the Layout
Pick physical, logical or architecture from the table above, and commit to one per drawing.
Lay the logical diagram out north to south, with the internet edge at the top and the access layer at the bottom. Most engineers read that direction fluently.
4. Draw It With the Fields From the Checklist
Add hostnames, management addresses, interface identifiers, link speeds, VLANs, redundant paths and demarcation points, and nothing you are unwilling to keep current.
Diagramming tools such as Visio, draw.io and Lucidchart all handle this; the tool matters far less than the discipline.
5. Stamp It, Store It and Tie It to Change
Add the last-verified date and store the file in source control or one documented location with a change history.
Then make the diagram update a required step on every network change ticket. A change is not complete until the drawing reflects it.
What Conventions Make a Diagram Readable?
Diagrams fail on presentation as often as on content. Five conventions do most of the work, and we apply all five to every drawing we review.
Use one icon set: Whether you use vendor stencils or generic shapes matters far less than using the same ones everywhere. A router should look identical across every drawing your team produces.
Give color one job: Color that means security zone on one diagram and device status on the next means nothing on either. Pick one meaning, put it in a legend, and never overload it.
Label the links, not only the boxes: The connection is usually what you are investigating. An unlabeled line throws away the most useful information on the page.
Keep one diagram to one purpose: A drawing that needs both rack positions and routing boundaries should be two drawings that reference each other.
Version it like code: A diagram in someone's local Visio folder is not documentation. A diagram with a change history is.
Why Do Network Diagrams Go Stale?
Networks change and documents do not. Understanding that one mechanism separates diagrams that last from diagrams that do not.
A switch gets replaced during an emergency at midnight, and updating the drawing is not on the change ticket.
A new VLAN gets added for a project and documented in the project's own notes. A branch migrates to a different circuit, and the carrier's reference number changes on the invoice, not on the diagram.
None of these are negligence. They are what happens when the documentation lives outside the workflow that changes the network.
The staffing picture makes it worse. According to EMA's Network Management Megatrends 2026, 52 percent of network teams say hiring and keeping people with network expertise remains a significant challenge. The diagram is the first task a short-staffed team drops.
Two things reliably slow the decay. The first is making diagram updates part of the change process, so a change is not complete until the drawing reflects it.
The second is reducing how much of the diagram you maintain by hand in the first place. Automated discovery earns its place there.
How Do You Keep Network Diagrams Current With Automated Discovery?
The most durable diagrams are the ones nobody has to redraw. A hand drawing shows the network at one point in time. A discovered topology map queries the network and renders what is actually there.
Motadata ObserveOps builds these maps from a scheduled topology scan. You nominate one or more entry point devices. The scanner traces outward from them to work out which devices connect to which, using the discovery protocols you configure.
Layer 2 discovery with CDP and LLDP is the default starting point, and additional protocols can be added for mixed-vendor environments.
Scans run on their own schedule (once, daily, weekly or monthly), separate from normal metric polling. They can notify a user or mailbox when a run completes.
What that produces differs from a static drawing in three ways that matter operationally.
It reflects the current state: A scan run last night shows the switch that was swapped at midnight, whether or not anyone updated a Visio file.
It carries health, not only structure: Nodes carry live status, so a single red distribution switch explains thirty downstream alerts as one fault instead of thirty. That collapses the first and slowest step of root cause analysis.
It spans more than the physical network: Alongside the network view, the dynamic topology map covers cloud, virtualization, SDN and hyper-converged infrastructure. VMs and their hosts, or cloud resources and their account and region, appear on the same canvas.
For change planning, the same map traces blast radius before the work starts. If a path you intend to reconfigure carries traffic for a system you had not considered, the map tells you in advance. A risky change becomes a planned one.
Running the network on a unified observability and ITSM platform closes the loop further. The change ticket and the topology it affects sit on the same system.
Automated maps do not replace architecture diagrams. Design intent, trust boundaries and the reasoning behind a topology are human artifacts, and no scanner infers them.
What discovery replaces is the tedious, error-prone layer: the inventory of what currently exists and how it is presently connected.
Keep the architecture diagram by hand and let discovery maintain the topology. Reserve custom views for the focused canvases each team needs, such as an on-call engineer seeing only the production database tier and its switches.
Where to Start This Week
Pick the diagram your on-call team opens most and audit it against a discovery run. Count the devices the drawing is missing and the links it shows that no longer exist. That count is the argument for changing how the diagram gets maintained.
Then split the work. Redraw the architecture diagram by hand once, with a named audience and a verified date, and hand the topology layer to discovery.
The architecture drawing changes a few times a year and deserves the effort. The topology changes every week and does not.
Draw the Design by Hand and Let Discovery Draw the Rest
A network topology diagram is worth exactly as much as its accuracy on the day someone needs it. Accuracy comes from tying the drawing to the workflow that changes the network, or from letting the network draw itself.
The trade-off is that discovery cannot capture intent. Zones, trust boundaries and the reasons behind a design still need a human hand and a review cycle, so the architecture diagram remains work you own.
Split the two that way and the on-call engineer opens a map that matches the network. The change approver sees the blast radius before approving, and network documentation stops being the task everyone skips.
FAQs
What is the difference between a network diagram and a network topology diagram?
The terms are used interchangeably in practice. Where a distinction is drawn, network diagram is the broader category covering physical, logical and architecture drawings. Topology diagram refers to the logical one showing devices and the connections between them.
What is the difference between network architecture and network topology?
Architecture is the design: the zones, tiers and structural decisions, along with the reasoning behind them. Topology is the arrangement: which devices exist and what connects to what. Architecture explains why the network looks the way it does, and topology records how it currently looks.
How do I create a network topology diagram?
Name the audience and inventory the network from a discovery run. Choose one diagram type, draw it with hostnames, addresses, interface identifiers and VLANs, then stamp a verified date and store it with a change history. Discovery tools can generate the topology layer automatically.
How often should network diagrams be updated?
Any diagram maintained by hand should be reviewed at every significant change and audited at least quarterly. Discovered topology maps in ObserveOps can be scheduled daily or weekly, which removes the question for the parts of the network they cover.
What should a network topology diagram include?
At minimum, include hostnames matching DNS and monitoring, management IP addresses, interface identifiers, link speeds, and VLAN and subnet details. Mark redundant paths and demarcation points, and add the date it was last verified.
Author
Ramya Shah
Technical Writer
Ramya Shah is a technical content writer with a computer engineering background and roots in automotive journalism. He covers IT Service Management, observability, IT operations, and AI-driven automation. An early adopter of AI-assisted writing workflows, he turns complex IT processes into clear, engaging content optimized for search and answer engines (AEO), lifting content output and organic visibility.