Log Processing: What Happens to a Log Line Before You Can Search It
A log line arrives as plain text and leaves as a record you can query. Six steps sit between those two states. Each one adds something useful, and each one costs you time, CPU, or storage.
Most teams never look at that chain until a search comes back empty.
Here is what log processing does to an event, step by step:
Six steps turn a raw line into a searchable record.
Every step changes what the record carries, and one of them can delete it.
Processing runs in the hot path, so latency is a real budget.
Most failures here are silent, and you find them mid-investigation.
By the end you can look at your own chain. You will know what each step buys you.
What Happens to a Log Line Before You Can Search It?
Six steps turn a raw log line into a searchable record. The event arrives, gets parsed, normalized, enriched, filtered, and finally indexed.
Take one authentication failure from a Linux host. It reaches the pipeline looking like this:
Aug 27 14:03:11 web-04 sshd[2841]: Failed password for admin from 10.4.2.19 port 54122
That line is readable. It is not queryable, because nothing in it is a field yet. You cannot count it, alert on it, or join it to anything.
The table below follows the same event through all six steps.
Step | What Changes | What the Record Carries Afterward |
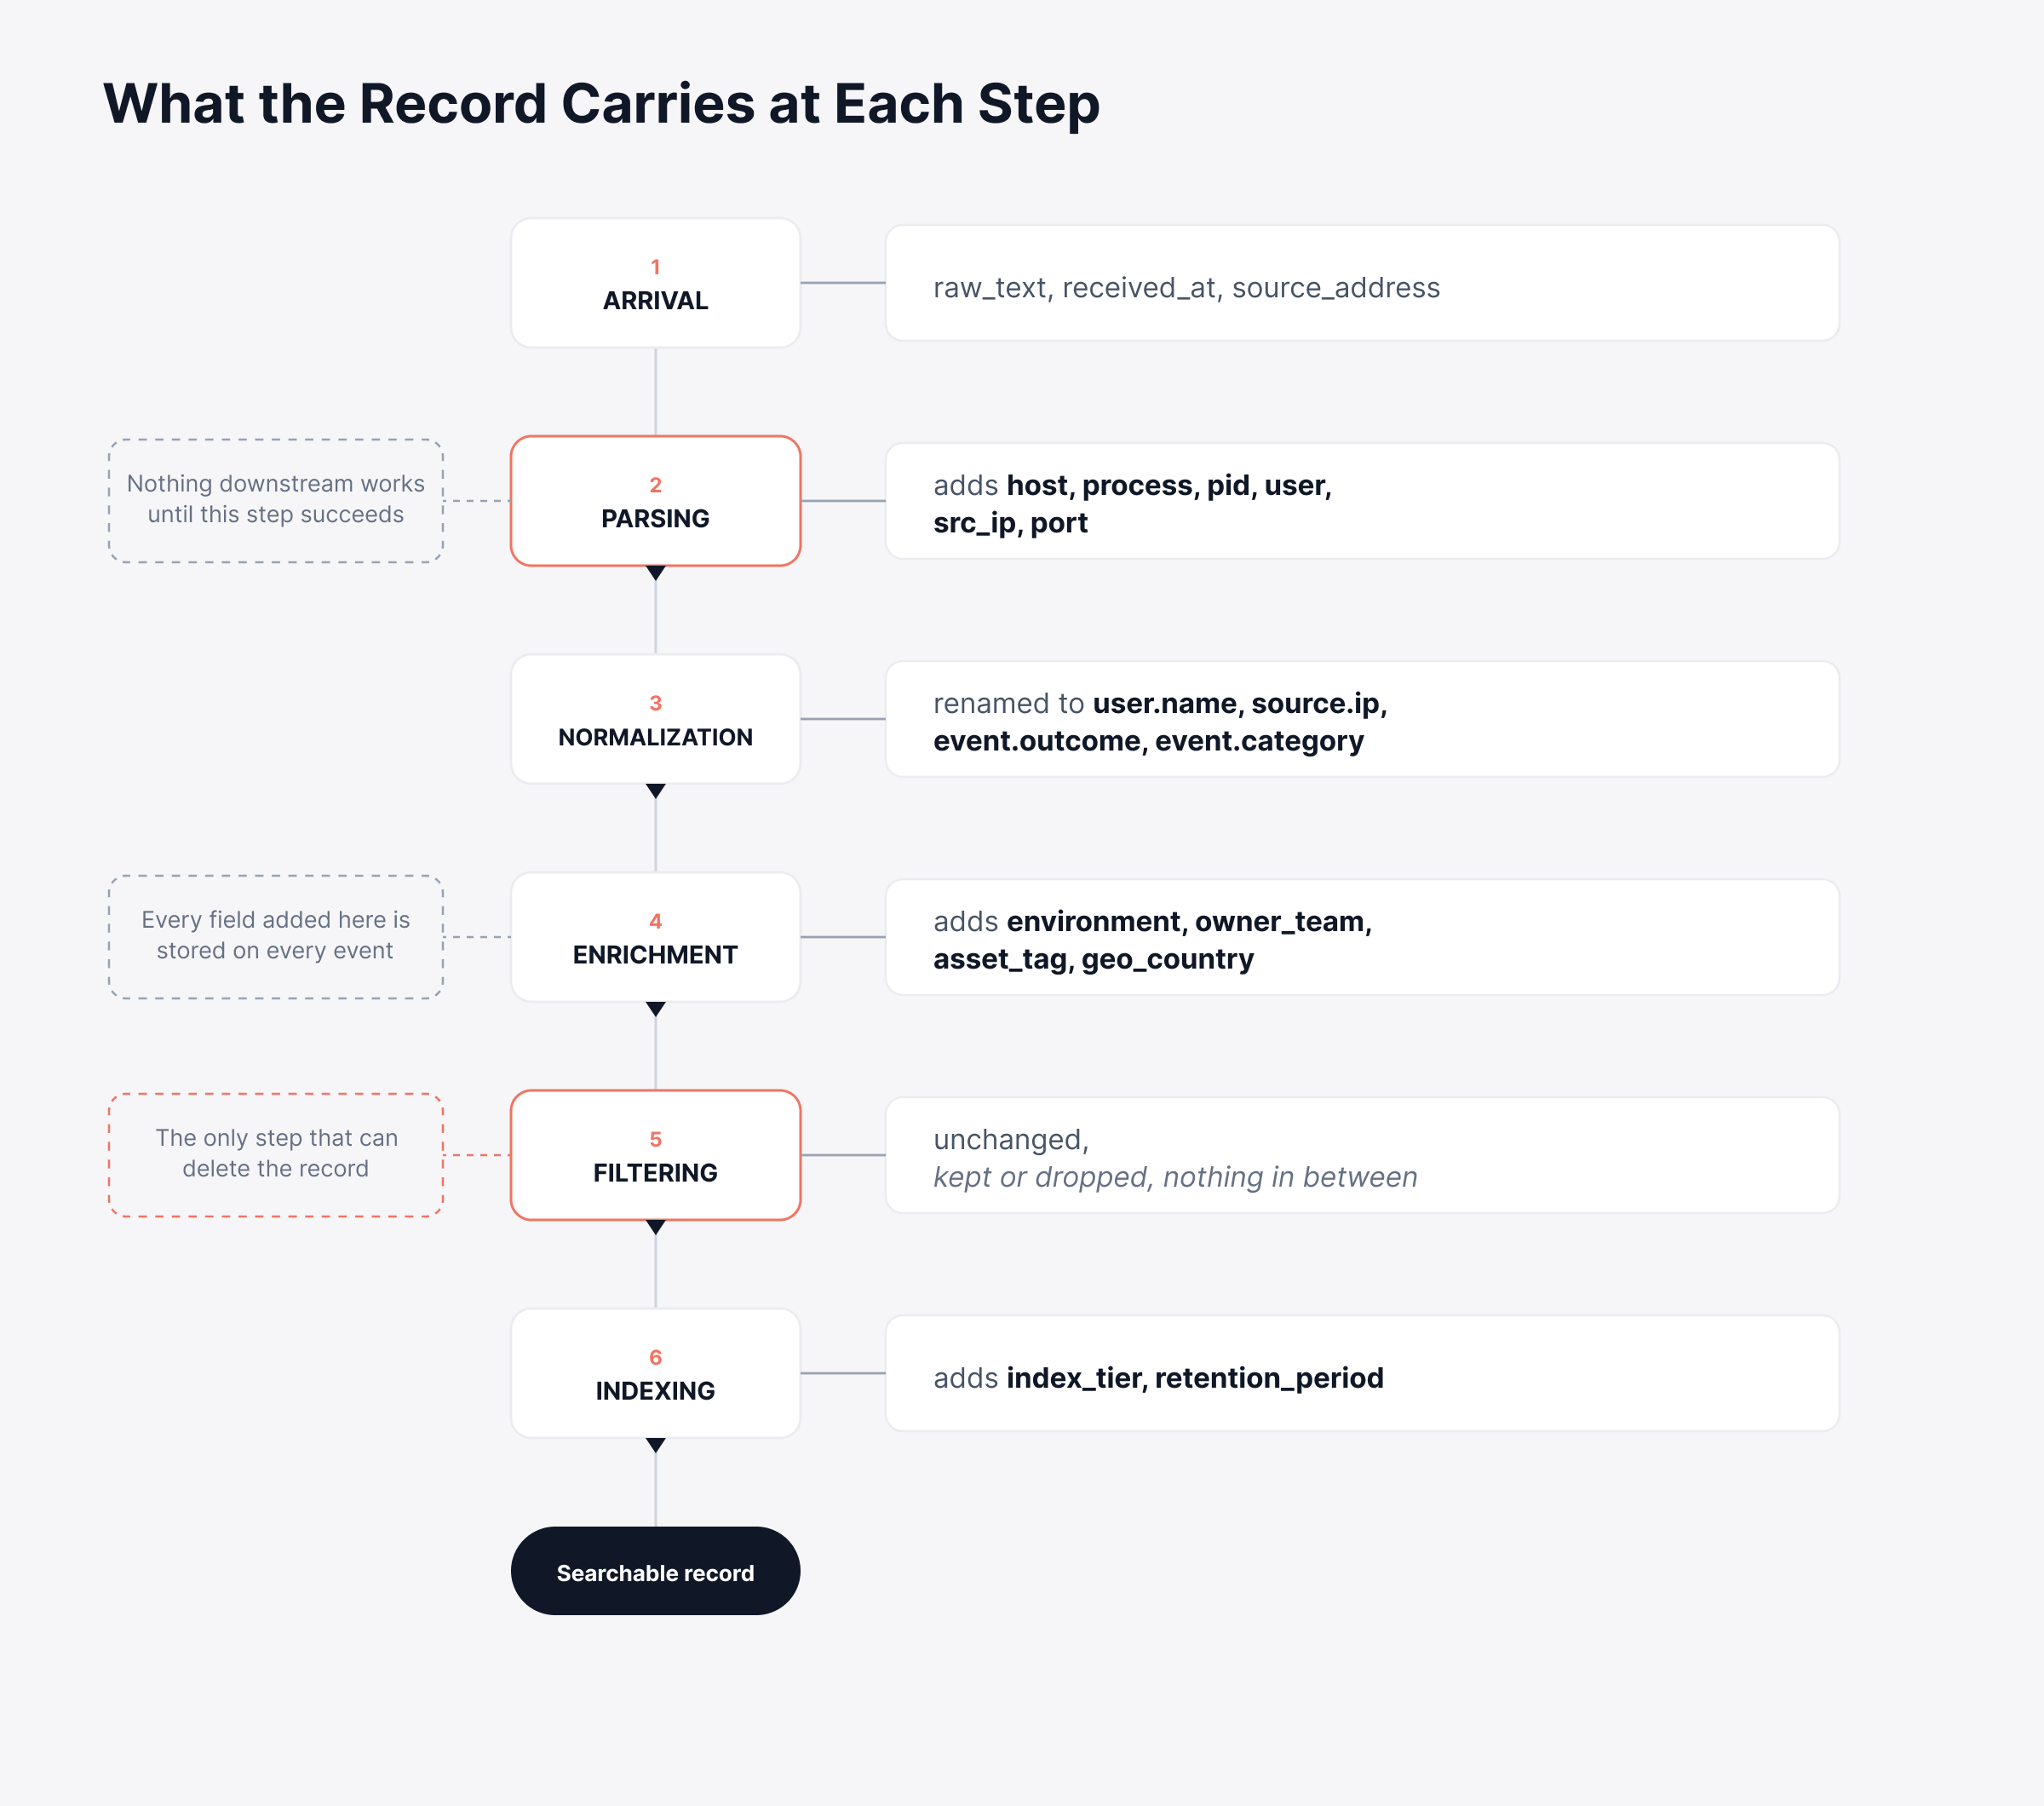
1. Arrival | Nothing yet. Transport attaches receipt metadata. | Raw text, a receipt time, and a source address |
2. Parsing | Named fields get pulled out of the text. | host, process, pid, user, src_ip, port |
3. Normalization | Field names map onto one shared schema. | user.name, source.ip, event.outcome, event.category |
4. Enrichment | Context the source never had gets attached. | Adds environment, owning team, asset tag, location |
5. Filtering | The event is tested against a rule. | Unchanged if kept, and nothing at all if dropped |
6. Indexing | The record lands in a tier that sets its lifetime. | Adds an index tier and a retention period |
Five of the six carry a decision that is easy to get wrong, and they are not the ones people expect.
Normalization is often the step to fix first when a chain is already misbehaving. Parsing failures announce themselves as empty fields. Normalization failures look like working data, right until you try to join two sources.
The record grows at every step, and seeing it grow makes the point faster than a description does.
The mechanics of turning raw text into named fields belong to log parsing, which covers step two and how it differs from the two after it.
Two more things happen around steps four and five. Detection policies read the event and decide whether to raise an alert, which is the subject of log management policies.
Recurring values also get turned into series around the same point. That conversion is where logs and metrics stop being separate things.
What Does Each Processing Step Cost?
Every step runs on every event, in the hot path, before anything is stored. That makes cost the part worth measuring, and almost nobody measures it.
1. Latency
Processing sits between the event happening and the event being visible. A chain with six stages is slower than a chain with two. This rarely matters for a nightly report. It matters a great deal for an alert you want firing inside a minute.
2. CPU
Parsing is the expensive step, and regular expressions are the expensive part of parsing. A pattern that backtracks badly on one unusual line is costly. It can eat more CPU than the rest of the chain combined. We have seen a single greedy wildcard take a pipeline from comfortable to backed up.
3. Lookups
Enrichment usually means asking something else a question. That something is an asset database, a directory, or a geolocation table. Each lookup is a dependency. A slow one becomes the pipeline's slowest step rather than a background detail.
4. Storage
Every field enrichment adds is stored on every event. Attaching four context fields to a billion events a month is a real line on the bill. It is usually worth paying, and it stops being worth it the moment nobody queries the field.
5. Maintenance
This is the cost nobody budgets for. Every rule in the chain is something a person keeps correct as the sources change underneath it.
The trap is that all five costs are paid forever, on every event. The benefit only gets collected when someone runs the query. A stage that answers a question nobody asks is pure overhead.
Put a Number on the Latency Budget
Latency is the one worth putting a number on, even a rough one. Say an alert has to fire within sixty seconds of the event. Collection and transport might take five of those. Indexing and rule evaluation might take another ten.
Processing gets the remaining forty-five, and a chain that regularly overruns it makes the alert useless without anyone noticing.
So measure the gap between the event timestamp and the moment the record becomes searchable. That single number is the most honest report card the chain has.
According to the CNCF Annual Cloud Native Survey, 59% of organizations now report that much or nearly all of their development is cloud native. More services means more sources, and more sources means more rules to keep correct.
Where Should the Processing Chain Run?
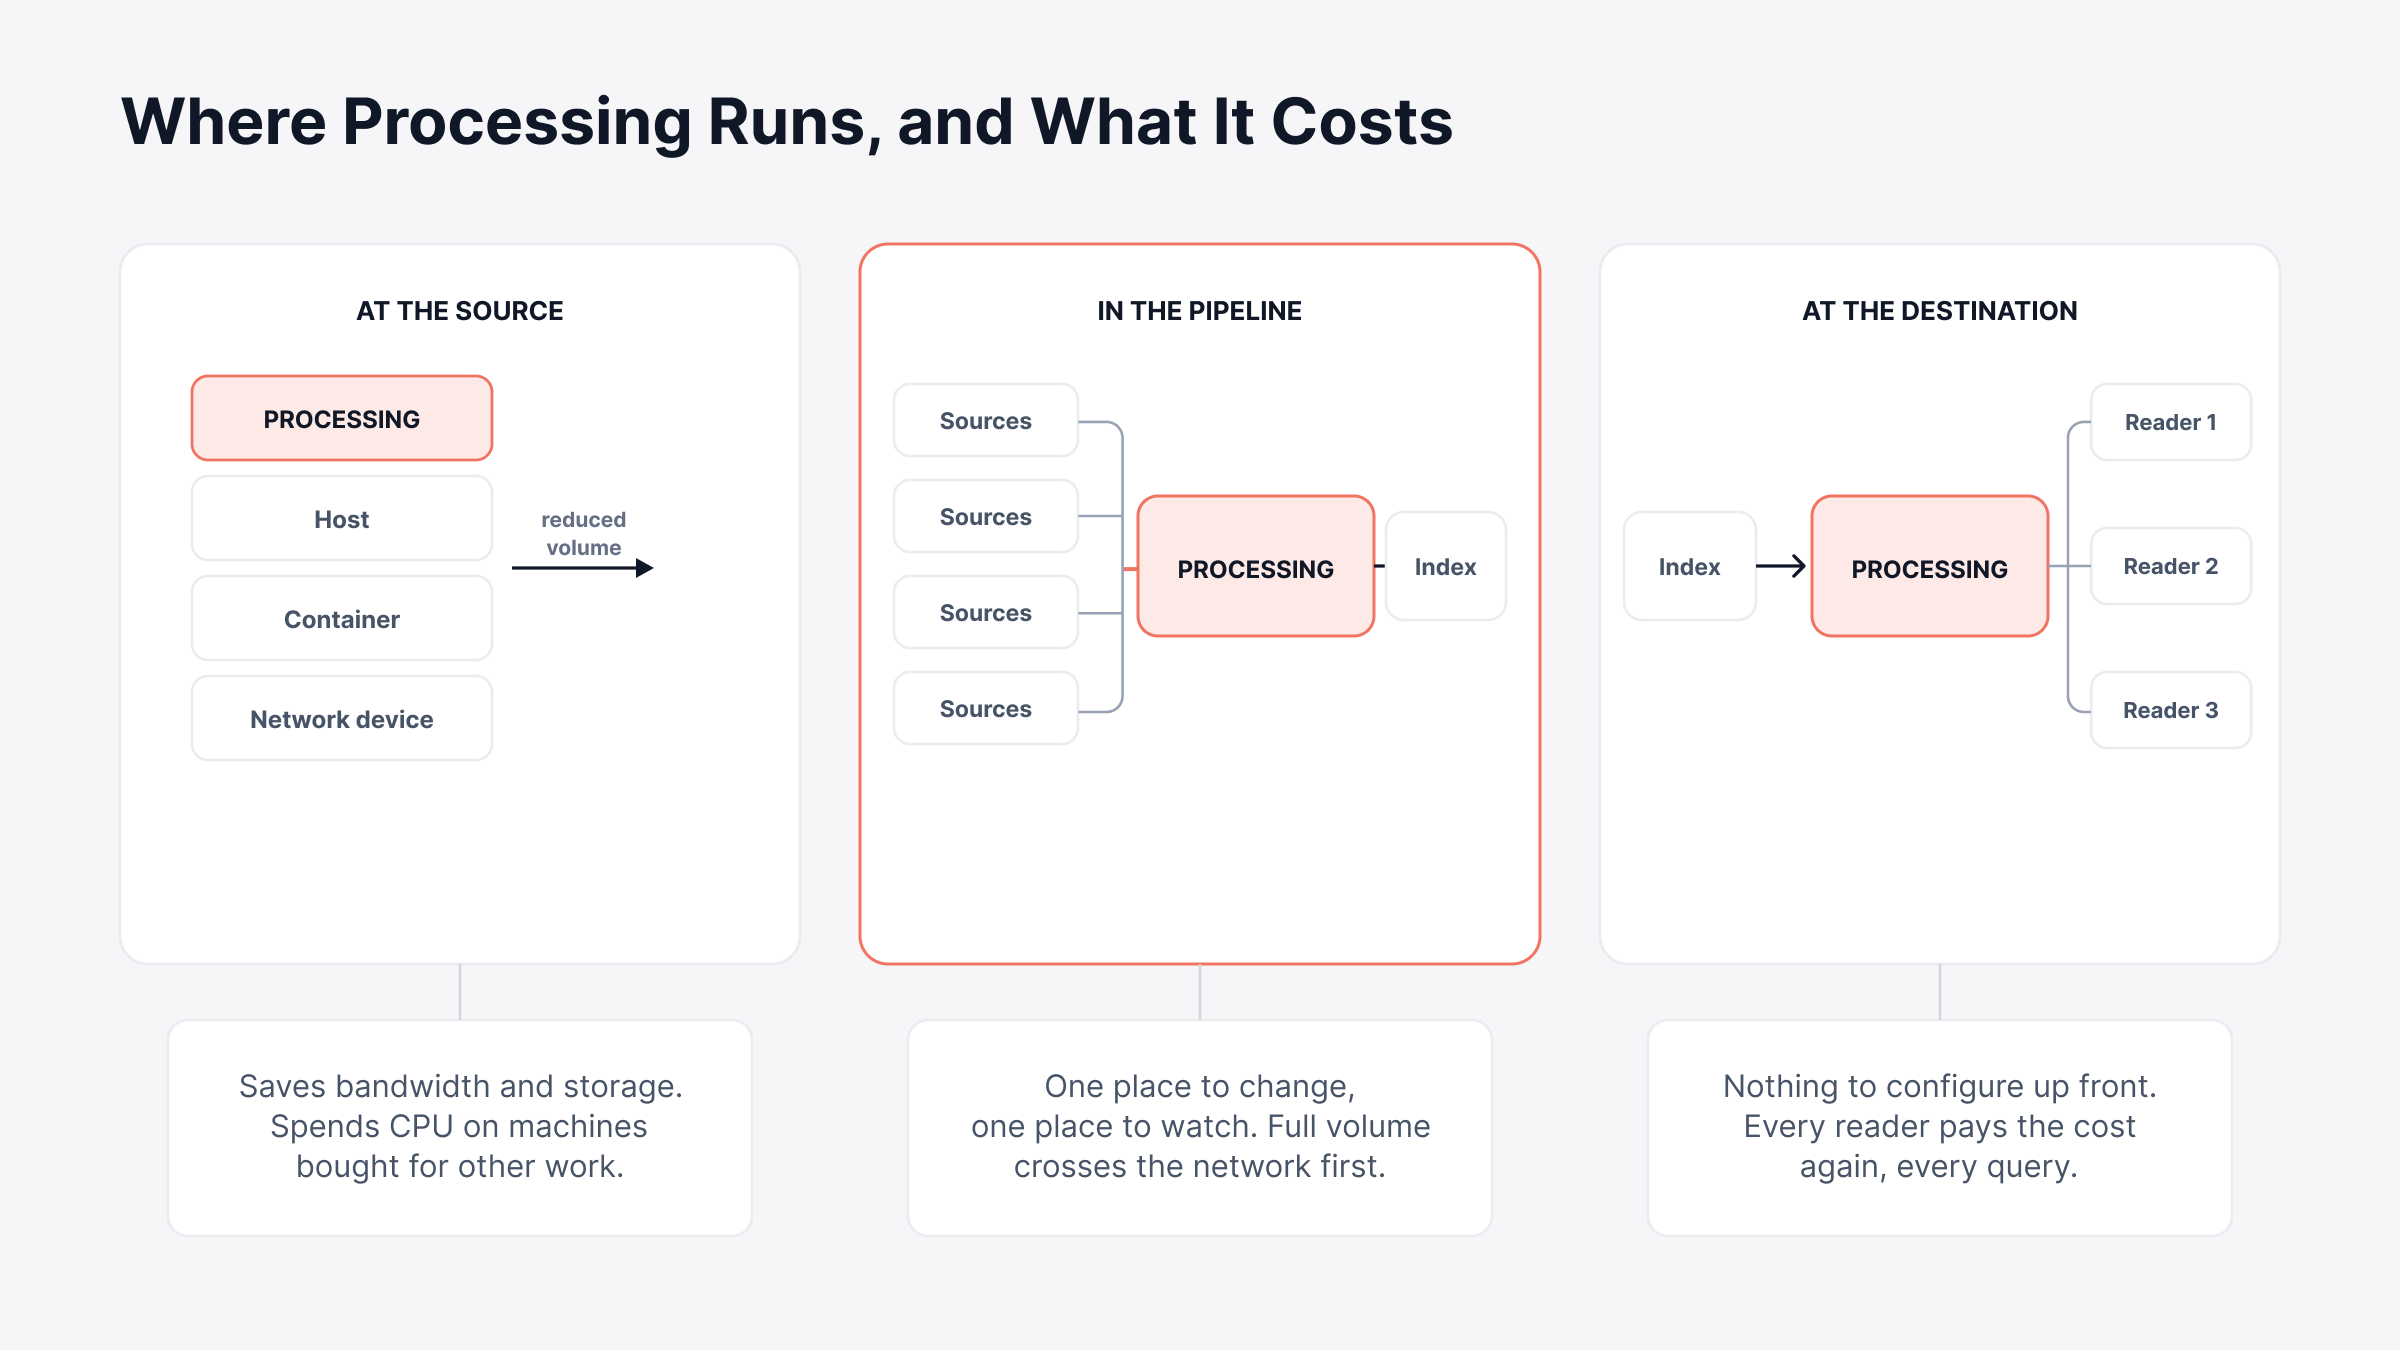
Processing can run in three places, and the choice moves cost around rather than removing it.
1. At the Source
Running it at the source is the cheapest option on paper. An agent trims and shapes events before they cross the network, so you pay less for transfer and less for storage. The bill moves to CPU on machines that were bought to do something else.
It also gets harder to operate as the estate gets more disposable. According to CNCF's 2025 survey results, 82% of container users now run Kubernetes in production.
A rule that lives on a container is gone when the container is, and debugging a parser across four hundred short-lived hosts is genuinely unpleasant.
2. In the Pipeline
Running it centrally is easier to reason about. One place holds the rules, and one change updates every source. You can also watch what the chain is doing.
The full volume crosses the network first, arriving before anything has been dropped. This is what drives the cost.
3. At the Destination
The third place is the one people forget, and it is the most expensive of the three. Some processing can happen at the destination, after storage.
Reformatting at query time means every reader pays the cost again, every time they ask. It is fine for a one-off investigation and it does not scale to anything routine.
Splitting the Work in Practice
Most estates end up splitting the work across the first two. Cheap, safe trimming happens at the source, such as dropping debug output that never leaves a development namespace.
Everything that needs judgment happens in the middle, where the rules are visible and reversible.
We would rather see a team start centrally and push work outward later. Starting at the edge means writing rules before you know what the data looks like.
Those are the rules that get copied everywhere before anyone notices they are wrong.
The three placements are easier to weigh side by side. The diagram below shows what each one saves and what it charges you instead.
What Breaks in Log Processing?
Processing failures share one trait. They are quiet, the pipeline keeps running, and nothing alerts.
1. A parser stops matching
A developer adds a field or changes a date format. The pattern that worked yesterday returns nothing today. The events still arrive and still get stored, but they arrive with no fields. No query finds them, and no policy fires on them.
2. The order gets rearranged
Each step depends on the one before it. Enrichment cannot attach context to a field parsing never created. Masking applied after routing sends the raw value somewhere else first.
3. Processing falls behind
When events arrive faster than the chain handles them, something has to hold the backlog. A small in-memory buffer starts discarding within seconds. A disk-backed queue rides it out and catches up afterward. A queue that fills quietly is worse than one that errors, because the first thing you lose is any record that you lost something.
4. Reference data goes stale
Enrichment is only as good as the table it reads. An asset database nobody has updated in a year attaches the wrong owner to every event, and the data looks perfectly healthy while it does it.
5. A sensitive value slips through
A debug statement prints a whole object, and a token lands in the index. Masking in flight prevents that. Masking at query time only hides it. The value is already stored, and another query still reaches it.
The fix for all five is the same, and it is cheap. Keep sample events from every source as fixtures, then run them through the chain whenever a rule changes. We have watched teams discover a three-week-old parser break this way, in about four minutes.
How Do You Decide What Belongs in the Chain?
Start from the questions you need answered, not from the transforms a tool happens to offer.
Write down what you need to ask: List the questions you expect during your next incident and your next audit. Everything downstream exists to answer those.
Work backward to the fields: Each question needs specific fields to exist. That tells you what parsing has to extract and what enrichment has to attach.
Add only the steps those fields need: A transform producing a field nobody queries is overhead on every event. Cut it and see who complains.
Decide what never needs to land: Log filtering before storage is the only kind that reduces cost. Keep authentication and audit events out of the drop rules entirely.
Pick the tier before the period: The tier an event routes into carries its own retention, so those are one decision rather than two. Sorting by source or severity is what stops audit evidence and debug output sharing a lifetime.
Test it with real events: Run captured samples from every source through the chain before it goes live. Repeat that after every rule change.
We would rather see four stages that earn their place, than ten stages that nobody can explain. Every chain we have looked at carries at least one orphan rule, still running because the person who added it left.
Where the Rules Should Live
Where those rules live matters as much as what they do. Rules spread across collectors, an alerting tool, and a storage setting break independently. One format change then takes out whichever piece its owner happens to be on leave for.
Running them as a single configured flow is what an observability pipeline does. Three things change once the stages sit together:
One place to change: Each transform gets configured once and applies to every event arriving after it.
One change that carries: A parser edit flows through detection, metrics, indexing and forwarding with nothing to reconcile by hand.
One place to look: When a rule stops working there is a single config to open, rather than four owned by four people.
That is also where log data stops behaving like a separate estate. It starts reading like the rest of a unified observability platform. An event then sits next to the metric or the trace around it.
None of this removes the work. It moves the rules somewhere they can be changed together. That is a smaller promise than removing them, and a more honest one.
The wider architecture question, meaning where logs land and how much you centralize, belongs to log aggregation rather than to the chain itself.
Judge the Chain by the Questions It Can Answer
Log processing is easy to describe and easy to get wrong, because every step looks reasonable on its own. The test is not whether the chain is complete. It is whether the fields it produces answer the questions you will actually ask.
The awkward part is timing. You have the least evidence about those questions on day one. Day one is also when the schema gets chosen. Most teams rewrite it once, after real queries have proved what was missing.
That rewrite is cheaper when the rules sit in one place. Six months in, the chain decides whether an investigation takes ten minutes or an afternoon. The same question, asked wider, is how a telemetry pipeline works.
FAQs
What is the difference between log processing and log parsing?
Parsing is one step inside processing. It pulls named fields out of raw text. Processing is the whole chain around it, covering normalization, enrichment, filtering, and indexing as well.
Does log processing happen before or after logs are stored?
Most of it happens before storage, which is the only point where dropping an event saves money. Some processing runs after, such as filtering a search result, but by then the data is already stored and indexed.
How much latency does log processing add?
It depends on the chain, and parsing is usually the slowest step. The figure worth measuring is the delay between an event happening and it becoming searchable, since that sets how fast your alerts can fire.
Can you reprocess logs that are already indexed?
It is rarely possible, and never cheap. Most platforms apply processing rules on arrival, so a rule fixed today does not repair yesterday's records. That is why keeping sample events as fixtures matters more than it sounds.
Author
Ramya Shah
Technical Writer
Ramya Shah is a technical content writer with a computer engineering background and roots in automotive journalism. He covers IT Service Management, observability, IT operations, and AI-driven automation. An early adopter of AI-assisted writing workflows, he turns complex IT processes into clear, engaging content optimized for search and answer engines (AEO), lifting content output and organic visibility.