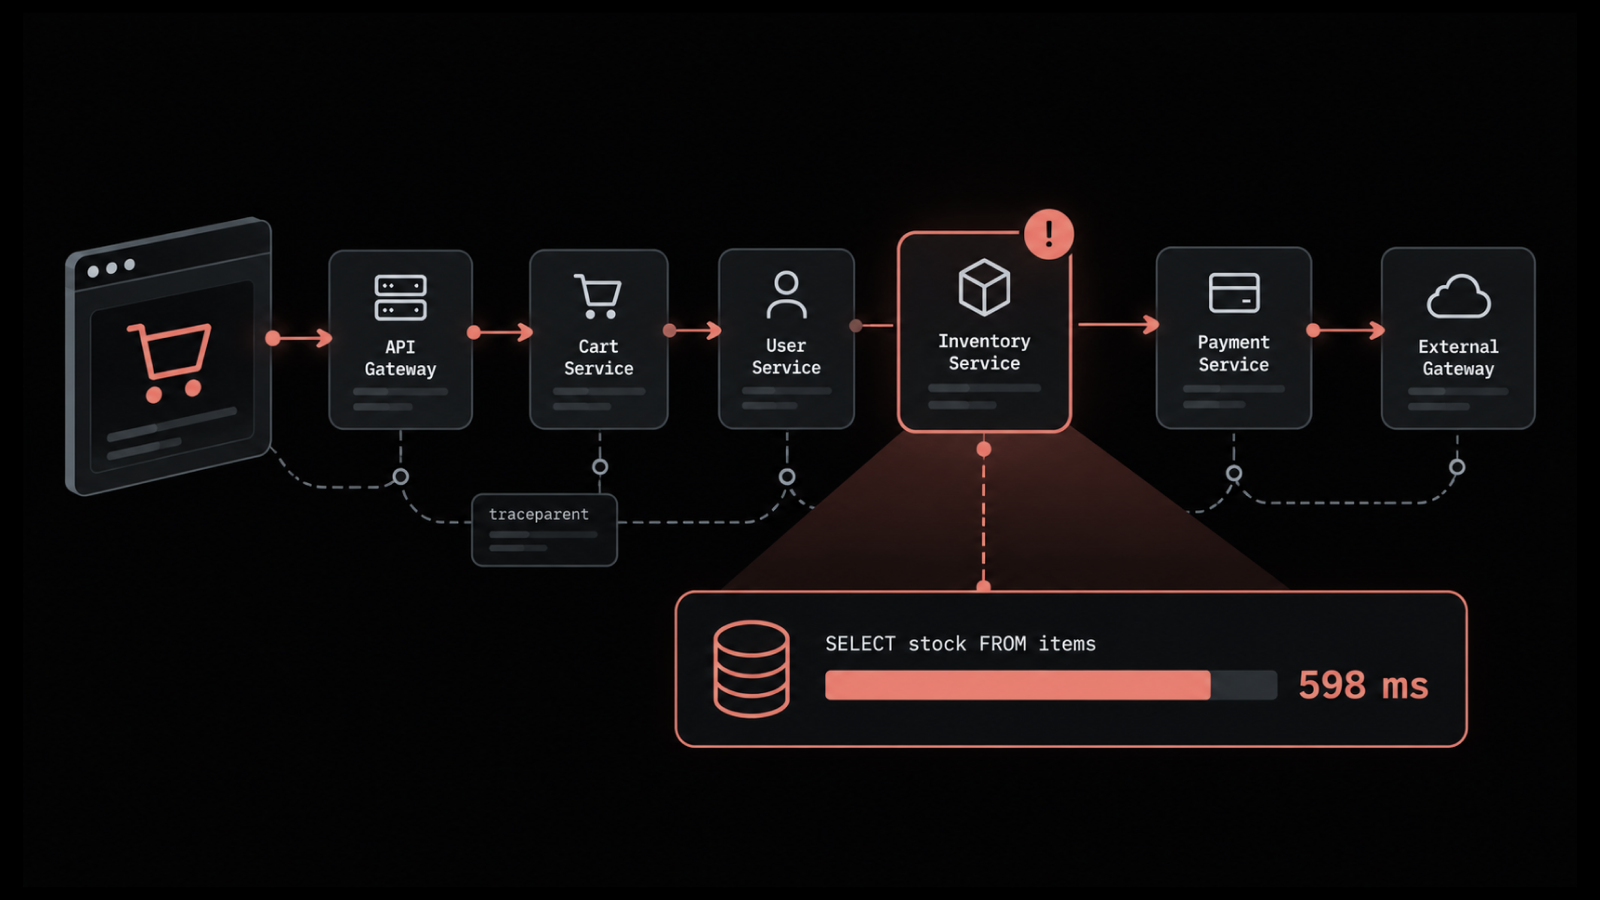
How Does a Telemetry Pipeline Work?
Telemetry passes through several stages before anyone can use it. Searching it, charting it, and alerting on it all come later. Each stage makes one decision about the data. Their order separates a pipeline that saves money from one that adds a hop.
Most teams meet this layer late, usually after a monitoring bill jumps.
Here is how a telemetry pipeline works, stage by stage:
Five stages carry every signal from its source to its destination.
Processing is the stage that decides what the data is worth.
Metrics, events, logs, and traces each strain a different part of the flow.
Logs bring problems the other three do not, mostly volume.
A pipeline needs health checks of its own.
By the end you can map your own telemetry flow against the five stages, and see which one is costing you.
How Does a Telemetry Pipeline Work?
A telemetry pipeline works in five stages: collect, normalize, process and enrich, route, and store or export.
Signals enter at the first stage. Every stage after that either shapes the data, decides its fate, or moves it somewhere.
The five stages hold for open-source collectors, a vendor platform, or scripts from 2019. Only the tooling underneath changes.
The map below shows what each stage does and what it asks you to decide. The last column covers how logs behave at each point.
Stage | What Happens | The Decision You Make | How Logs Differ Here |
1. Collect | Agents, receivers, and pollers gather signals from apps, hosts, containers, and network gear | Which sources report, and by what method | Syslog, Windows Event Log, agents, forwarders, and agentless polling all land here |
2. Normalize | Different formats are mapped onto one field set with consistent names and timestamps | Which schema everything downstream agrees with | A parser pulls fields out of raw text before naming can start |
3. Process and Enrich | Events are filtered, sampled, masked, and given context they never carried | What each event is worth keeping, and what it is missing | Volume makes this the stage that sets the bill |
4. Route | Each shaped stream is sent to the destination that fits it | Which tool receives which subset | Security events go to a SIEM, operational events to monitoring |
5. Store or Export | Data lands in a storage tier, or leaves for a system you do not own | How long it lives, and what it costs to keep | A tier carries its own filter and its own retention period |
1. Collect
Collection is where signals enter the pipeline. Agents sit on hosts, receivers listen on ports, and pollers call cloud APIs on a schedule. Method matters less than coverage.
Coverage is where most designs fall short, because the legacy systems nobody wants to touch are the ones that quietly stop reporting. We have watched a rollout look finished for months. Then an audit asks for the one box nobody onboarded.
2. Normalize
Normalization makes different sources agree on what to call the same thing. A firewall writes src_ip, an application writes client, and a load balancer writes remote_addr.
Until those three become one field, no query joins them and no correlation works. Log normalization does this job for log data specifically.
3. Process and Enrich
Processing is where the pipeline earns its keep. Events get filtered, sampled, and masked here.
They also pick up context they never carried. A server does not stamp its own owner or environment onto a line it writes.
4. Route
Routing decides which destination receives which data. Forwarding and routing get used interchangeably, though they answer different questions. Forwarding is the act of sending data onward.
Routing picks which destination receives what. One pipeline commonly feeds a SIEM, a monitoring platform, and a cheap archive at once. Each gets a different slice.
5. Store or Export
Storage is where cost becomes visible. Data lands in a tier. That tier sets how fast you can search it and how long it survives.
Export covers whatever leaves for a system you do not own, such as a customer's own SIEM.
What Each Signal Type Does to the Pipeline
Metrics, events, logs, and traces all travel the same five stages. Each one strains a different part of them.
1. Metrics
These arrive small and regular. A CPU reading is a number, a timestamp, and a few labels. The cost of a metric is rarely the metric itself.
It is the cardinality that gets you. Attach a unique container ID as a label, and a hundred series quietly become a hundred thousand.
According to the CNCF Annual Cloud Native Survey, 82% of container users now run Kubernetes in production. That is up from 66% in 2023, and ephemeral containers are exactly what turns a label into a cardinality problem.
2. Events
These carry the lowest volume and the highest value per record. A deployment, a failover, or a config change is worth keeping in full. Almost nobody has a reason to sample them.
3. Logs
This is where the volume problem lives. They arrive as unstructured text, in whatever shape a developer chose.
That gives the normalize stage real work to do before anything downstream can read them. Logs also carry the most bytes by a wide margin. So a filtering decision made at stage three shows up on the storage bill at stage five.
4. Traces
This is the one signal where dropping data is normal practice. Sampling a trace is accepted because the shape of a request path survives in a subset.
Try the same thing with authentication logs and you have destroyed evidence. We use that asymmetry as the dividing line whenever a team asks what it can safely sample.
What Happens Inside the Processing Stage
The processing stage runs a chain of transforms. Each one changes the event, drops it, or adds to it.
1. Parsing
This comes first for anything that arrives as text. A raw line becomes named fields. Until that happens, the rest of the chain has nothing to work with.
2. Filtering and sampling
Both cut volume, and they do different jobs. Log filtering drops records that match a rule, so what it removes is gone.
Sampling keeps a proportion of a set, so the shape survives and the detail does not.
Filtering suits health checks and debug chatter. Sampling suits high-volume traffic where the trend is the point.
3. Masking and redaction
These handle values that should never have been written down. That means a card number, a session token, or a home address. Doing this in flight means the value never reaches storage.
Hiding it at query time is a weaker promise. The value is already sitting in your index, and a different query can still reach it.
4. Enrichment
This runs the other direction, adding what the event never carried. It attaches asset tags, environment labels, hostname resolution, and location context while the record is still moving. Every downstream tool is then spared the same lookup.
5. Deriving new data
The last transform makes something that was not there before. A recurring value in a log line becomes a counter or a rate. That turns a million individual events into one series you can chart.
It is also where plenty of teams find their cheapest volume reduction, because the trend was the only part anyone looked at.
Order matters more than the list suggests. The whole chain is what log processing means once the signal is logs.
Masking after routing is worse than useless, because the sensitive value has already left the building.
Filter before detection and you have thrown away the events a policy needed to fire on. We have watched both mistakes pass a config review and surface months later.
Whichever platform runs the chain, check the order it applies transforms in. Motadata ObserveOps configures each transform once, then applies it to everything that arrives after.
A parser change carries through detection, metrics, indexing, and forwarding with nothing to reconcile.
What Changes When the Signal Is Logs
Logs put more pressure on a telemetry pipeline than metrics and traces combined. The reasons are structural rather than a matter of scale.
1. Volume: A single busy proxy can produce more log lines in an hour than a metrics agent produces samples in a week.
2. Shape: Metrics show up as numbers with labels, already structured. Logs show up as sentences a developer wrote on a Friday afternoon. The pipeline has to turn those into fields before a single query will run.
Parsing at ingest is therefore a defining decision for log data. It barely comes up for the other three signals.
3. Lifetime: Nobody needs a CPU reading from fourteen months ago. Plenty of teams need the authentication log from exactly that day. So log pipelines carry a tiering decision the other signals never force.
Those three pressures are why log aggregation gets designed as its own architecture problem.
What the pipeline hands over is only as useful as the tool reading it. A unified observability platform closes that loop, keeping pipeline and analysis together.
The Motadata observability pipeline is built for the log signal for these reasons. It runs ingestion, preprocessing, pipeline configuration, detection policies, metric generation, exclusion, indexing, and forwarding as one flow.
Exclusion sits after the policies and the metrics rather than at the front door. What gets dropped is decided once the rules that read the data are already in place.
How Do You Know the Pipeline Itself Is Healthy?
A telemetry pipeline needs monitoring of its own. Every tool downstream inherits its failures without saying so.
Four numbers cover most of it.
Throughput: What is arriving, and whether it matches what the sources think they are sending.
Lag: How far behind real time the pipeline is running.
Drop count: What never made it through. This is the dangerous one, because a pipeline that discards records does not usually raise an alert about it. The data is simply absent, and you find that out during the investigation that needed it.
Queue depth: Whether a slow destination is pushing pressure back upstream.
Buffering is the quiet dependency underneath all four numbers. When a destination slows, something has to hold events until it recovers.
A pipeline with a small in-memory buffer starts dropping within seconds of a slow SIEM. One with a disk-backed queue rides out a longer outage and replays afterward. Ask which one you have before you need the answer.
Then there is the part nobody budgets for. A pipeline every tool depends on is a single point of failure. One config change to it can break four dashboards and an audit report at once.
Config versioning stops looking like paperwork on the first day you have to undo something.
That is the honest trade-off here. Pulling telemetry into one pipeline makes cost, context, and routing controllable. Scattered per-tool agents never manage that. It also concentrates risk in one place.
We treat pipeline config the way we treat production code, with review and a rollback path. Teams who skip that tend to learn why after an outage they cannot reconstruct.
How Do You Implement a Telemetry Pipeline?
Start at the destinations rather than the sources. What a tool genuinely needs is the only thing that tells you what to keep.
List the destinations first: Write down every tool that consumes telemetry today and what each one genuinely needs. Most teams find at least one destination receiving data nobody has queried in a year.
Inventory the sources: Record what each source emits, in what format, and at what volume. The volume figure decides your architecture.
Pick the collection layer: Decide whether agents, receivers, or polling suit each source. The OpenTelemetry Collector is the usual neutral choice, and it handles receiving, processing, and exporting for all three main signal types. According to CNCF's 2025 survey results, OpenTelemetry is now the second-highest-velocity project in the foundation, with more than 24,000 contributors.
Agree the schema before writing transforms: Field names, types, and timestamp format get settled once, up front. Change them later and you rewrite every transform and every saved query built on top.
Add processing in the order the data needs: The order runs parse, then enrich, then mask, then filter. Tools often list these differently, and list order is not pipeline order.
Run the old and new paths side by side: Send to both for a couple of weeks and compare field by field. This is where you find the source that changed its format in April.
Instrument the pipeline before cutover: Throughput, lag, and drop count need to be visible on day one.
Expect the schema step to take longer than the rest put together. It is the one decision everything else is built on. It is also the one you have least evidence for at the start. We would rather see a team spend two weeks there than two months undoing it.
Build the Pipeline Around Stage Three
A telemetry pipeline has five stages, and the third one carries the weight. Collection and routing move data from place to place. Processing decides what that data is worth. Almost every cost line and every missing field traces back to a choice made there.
The awkward part is that those choices are hardest at the beginning. That is when you have the least evidence about which fields will matter. Most teams get the schema wrong first time and rewrite it after real queries.
That rewrite gets cheaper the earlier the pipeline exists. The alternative is redeploying collectors across every host you own. Standards help for the same reason, which is why OpenTelemetry-native monitoring keeps turning up in designs that expect to change destinations. A year in, the pipeline is what lets you swap a tool without touching a source system.
FAQs
What are the three pillars of telemetry?
The three pillars are usually given as metrics, logs, and traces. Many teams now add events as a fourth, which gives the MELT model. Events earn the place because they tie a technical change, such as a deployment, to the behavior that followed it.
Do you need a telemetry pipeline if you only collect logs?
Yes, and often more than teams carrying all four signals do. Logs bring the highest volume and the least structure. Parsing, filtering, and routing decisions therefore move your cost and your investigation quality further than for metrics.
Can OpenTelemetry replace a telemetry pipeline?
The OpenTelemetry Collector is a telemetry pipeline, and it handles receiving, processing, and exporting well. What it does not bring is the operating side, meaning managed upgrades, a configuration interface, and health monitoring you did not have to build yourself.
How is a telemetry pipeline different from an ETL pipeline?
Both extract, transform, and load. A telemetry pipeline runs continuously on operational data and optimizes for freshness, while ETL usually runs in batches on business data and optimizes for completeness. Telemetry also needs redaction and sampling, which ETL rarely does.
How do you test a pipeline change before it goes live?
Run the change against a copy of real traffic. Compare the output to the current path, field by field. Most breakages start with a source quietly changing its format. Keep sample events from every source as fixtures.
Author
Ramya Shah
Technical Writer
Ramya Shah is a technical content writer with a computer engineering background and roots in automotive journalism. He covers IT Service Management, observability, IT operations, and AI-driven automation. An early adopter of AI-assisted writing workflows, he turns complex IT processes into clear, engaging content optimized for search and answer engines (AEO), lifting content output and organic visibility.