All Features
Log Monitoring
Observability Pipeline for Log Data
A guide to what an observability pipeline is, the stages telemetry passes through, and how Motadata ObserveOps runs ingestion, detection, exclusion, and routing as one configured flow.
What Is an Observability Pipeline?
An observability pipeline is the path telemetry travels between the moment a system emits it and the moment it becomes something you can search, alert on, chart, forward, or hand to an auditor. Every stage on that path adds structure, adds context, or makes a decision about the event.
A single raw log line is readable. A day of them, arriving from every firewall, database, and server you run, is not. What turns that volume into an answer is log processing rather than storage: the fields a parser pulls out, the context enrichment attaches, the policy that decides an event is worth waking someone for, and the routing that sends the right subset downstream.
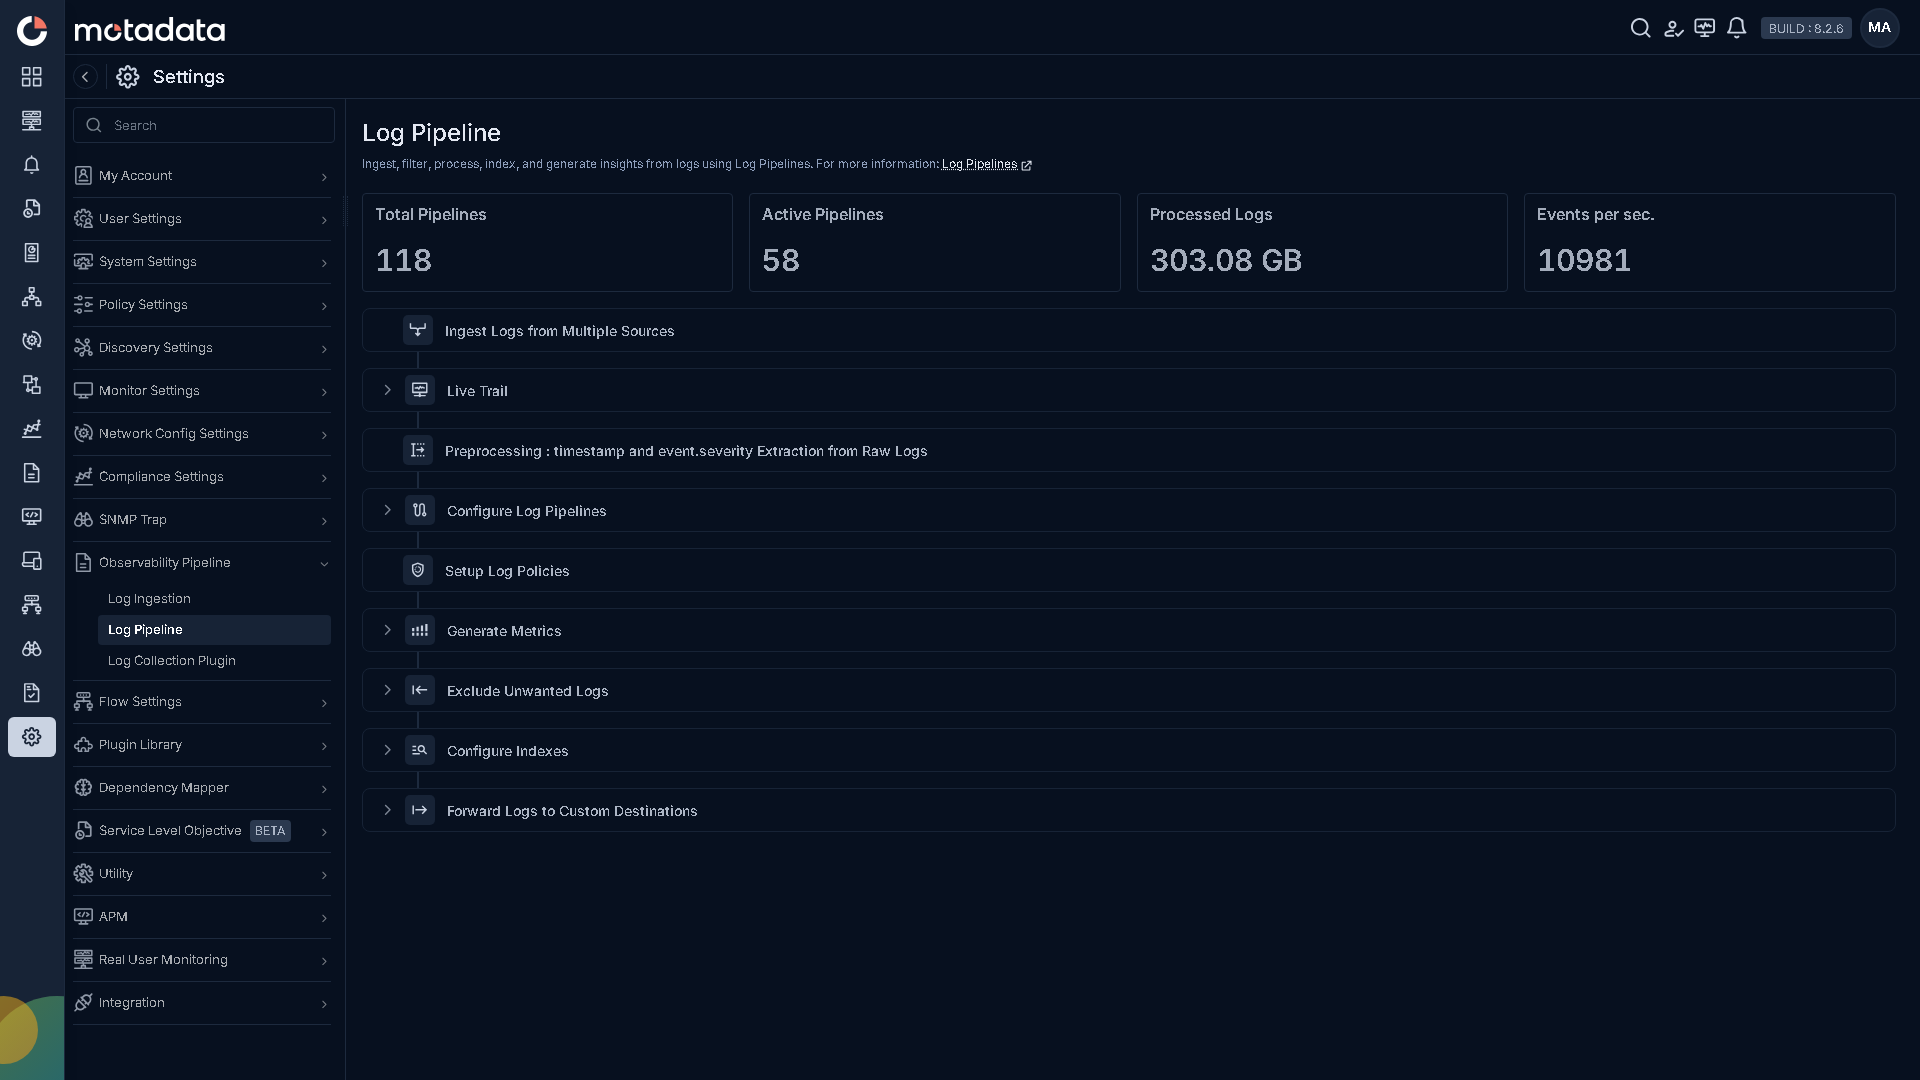
Motadata ObserveOps Log Monitoring runs that work as one continuous pipeline rather than a set of disconnected tools. A Log Pipeline exists to ingest, filter, process, index, and generate insights from logs. You configure each stage once, and it applies to every event that arrives after that.
Key Features of the Observability Pipeline
1. Unified log ingestion across your sources:
Log Monitoring collects over syslog, Windows Event Log, agent-based collection, and log forwarders. Agentless remote log collection covers the sources where you cannot install an agent, with out-of-the-box profiles for AWS, Azure, Windows, and VMware vCenter.
2. Enrichment and normalization while the event is in flight:
A firewall does not know which environment it protects, and a server does not stamp its own asset tag onto a log line. Log Monitoring adds geo-location, hostname resolution, asset tags, and environment labels in flight, and intelligent categorization classifies each event by source type, severity, service domain, and relevance. Schema normalization brings the result onto one standardized set of fields, so logs from different vendors describing the same thing end up expressed the same way.
3. Log-native detection policies:
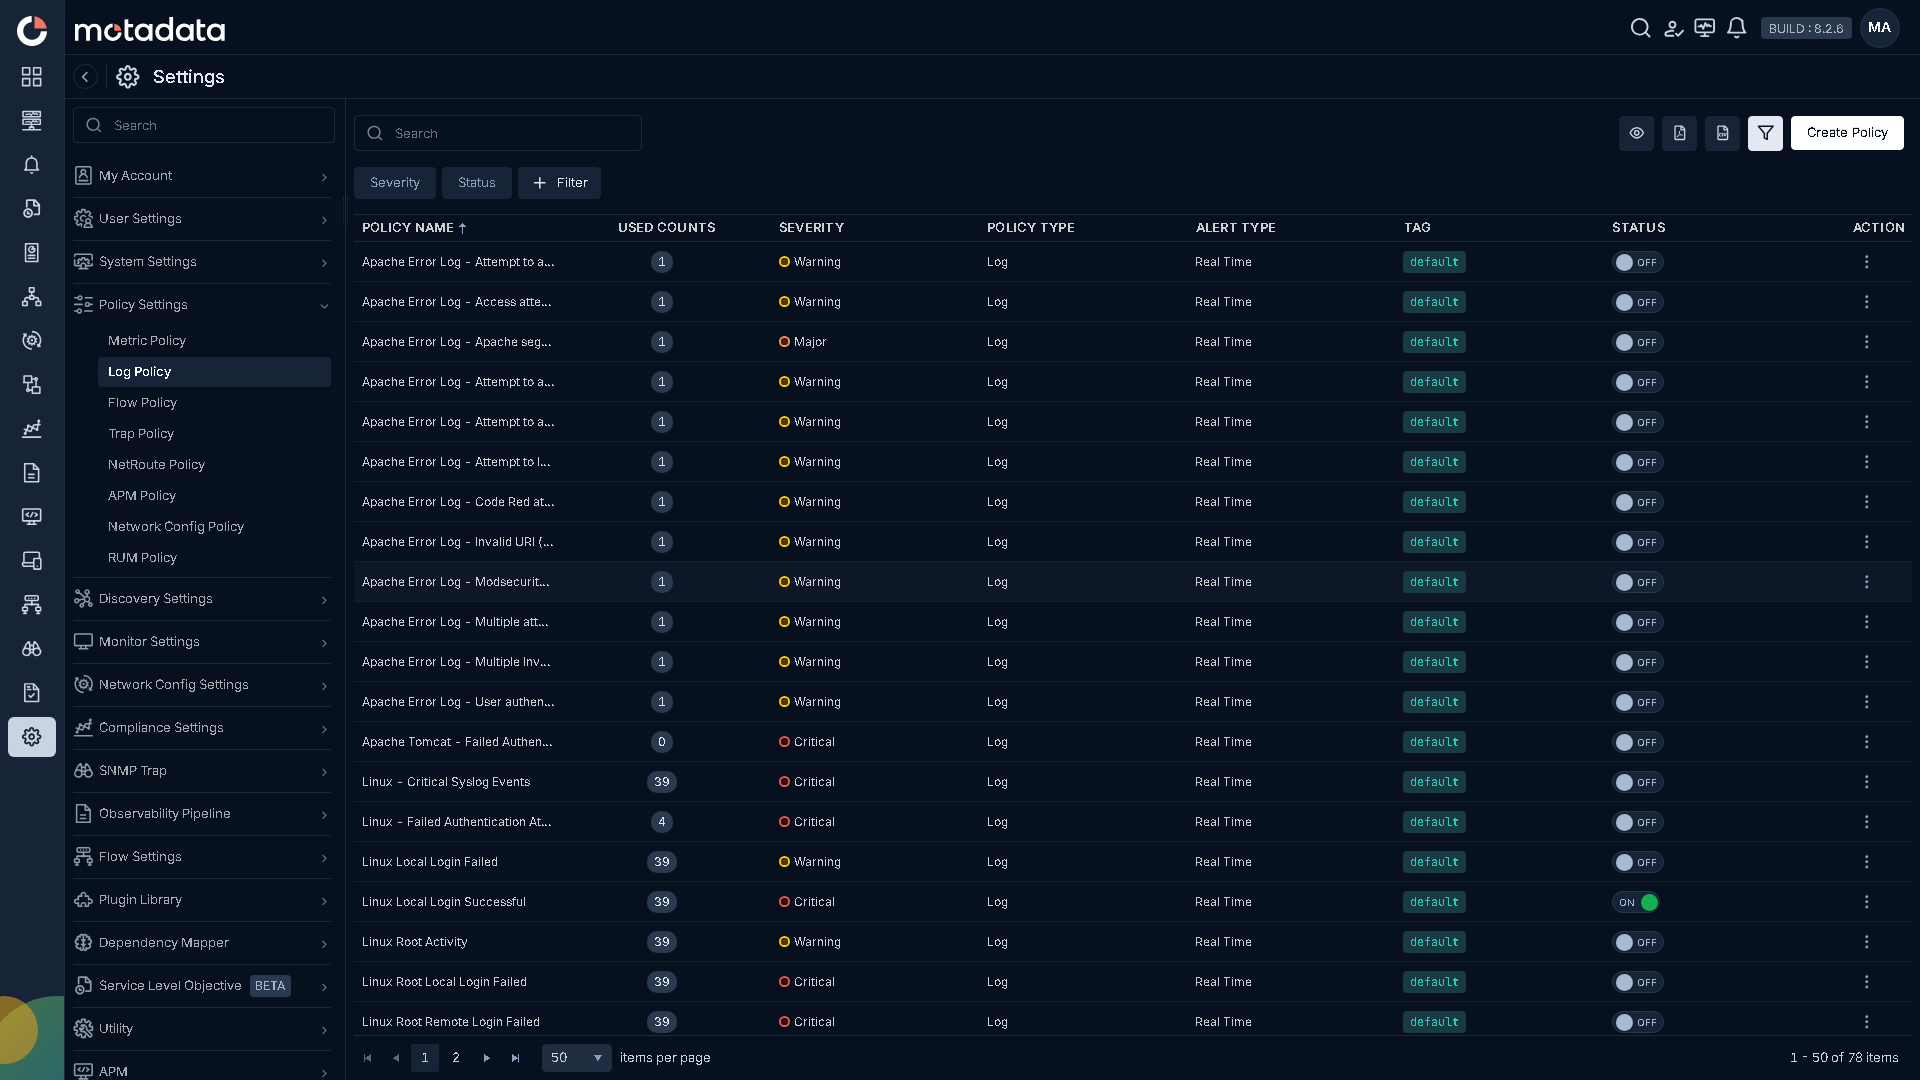
A log policy decides which events are worth waking someone for, and who gets woken. The out-of-the-box catalog is graded Warning, Major, and Critical, and most rules ship off, so you turn on what matters instead of muting noise later. Threshold, pattern-match, and anomaly-driven rules support multi-condition logic, time windows, and aggregation, so a policy can express a rate over a window rather than only a string match.
4. Log-to-metric conversion:
One log line tells you what happened once. A metric tells you what has been happening. Log-to-metric conversion turns recurring values into series you can track, deriving KPIs such as error rates and response times with SLO violation detection on top. Anomaly detection and trend forecasting are the machine-learning parts: one baselines normal log behavior and flags deviations, the other projects patterns from historical baselines.
5. Exclusion before anything is stored:
The cheapest log is the one you never store. Named exclusion rules carry their own source filter, dropping the noise you define before it reaches indexing and retention. Filtering at read time means that noise has already been stored and indexed. Excluding here means the volume never lands.
6. Index tiers that carry their own retention:
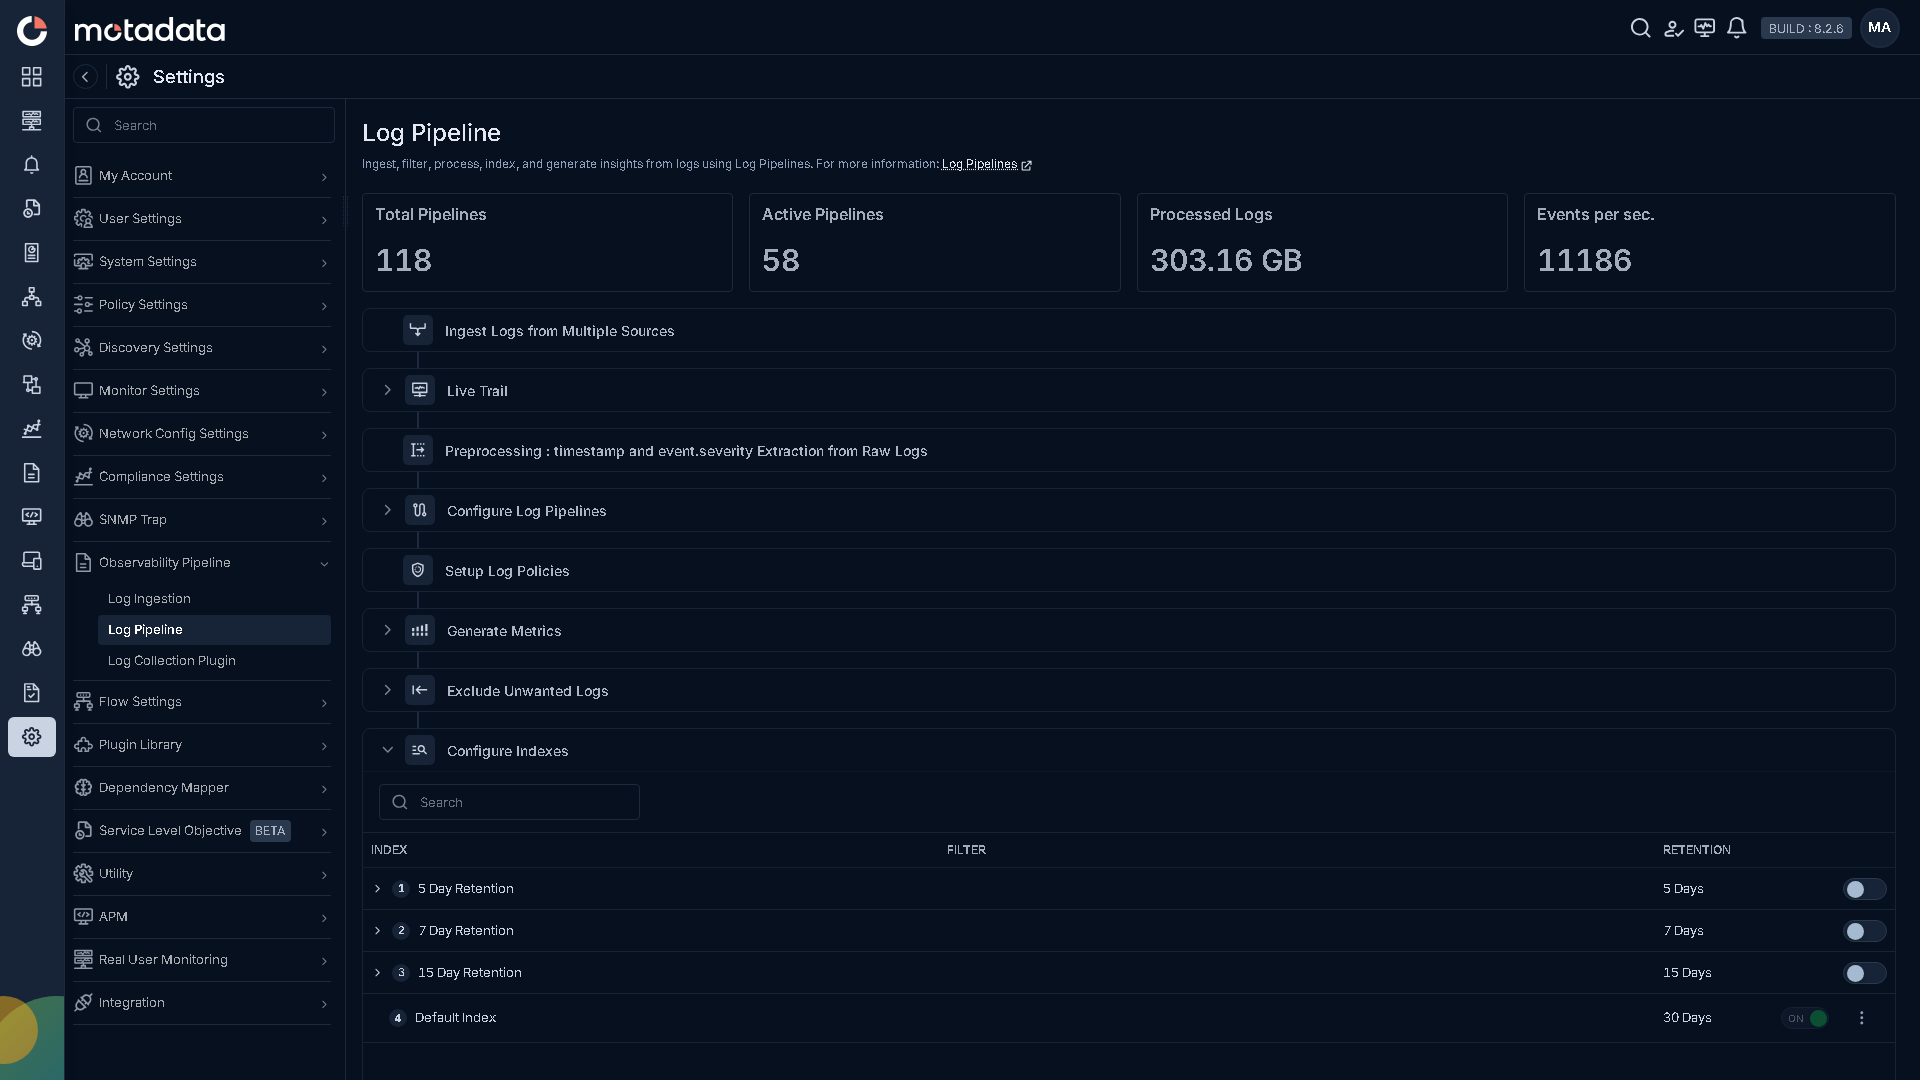
An index here is a storage tier. You define one index per tier, each with its own filter and its own retention period, so configuring an index is the log indexing decision and the log retention decision at once rather than two settings to keep in step. Events route to a tier by source, severity, or criticality, so short-lived operational noise and long-lived audit evidence never share a lifetime. Indexable log attribute values are clickable directly in Log Search.
How the Motadata ObserveOps Observability Pipeline Works
1. Log Ingestion:
Logs arrive over syslog, Windows Event Log, agents, forwarders, or agentless remote collection, and land as a raw record tagged with metadata such as log type.
2. Preprocessing:
The timestamp and event.severity are extracted, so every event has a place on the timeline and a severity grade before anything downstream reads it.
3. Log Pipeline Configuration:
Processors shape the event. Fields are remapped and standardised, attributes derived, context attached, and sensitive values masked.
4. Log Policies:
Log-native policies evaluate the event against thresholds, patterns, and baselines, and raise an alert or nothing.
5. Generate Metrics:
Trends inside your logs are converted into time series metrics, so a condition shows up as a trend rather than as events looked up one at a time.
6. Exclude Unwanted Logs:
Noise is dropped before it reaches storage rather than filtered at read time, so the volume never lands at all.
7. Configure Indexes:
Events route to an index, and that index is their storage tier, carrying its own filter and its own retention period.
8. Forward Logs to Custom Destinations:
Scoped streams are delivered to external platforms, with source-based filtering selecting what each destination receives.
Two things about the flow are worth noting. The first is where exclusion sits: at stage 06, after policies and metrics and before the indexing stage, so noise is dropped at the point where detection and measurement are already configured rather than at the front door. The second is response, which is not a separate stage but what a policy does once it fires. Alerts trigger operational runbooks over HTTP, SNMP, PowerShell, Telnet, or custom connectors, so a known repeatable fix runs at detection time.
Benefits of the Observability Pipeline with Motadata ObserveOps
1. Configure once, and the rules keep applying:
You write your processing, detection, and routing rules once, and every event arriving after that is handled by them. Nothing needs re-running when a new source starts reporting.
2. What you keep becomes a decision rather than a default:
Exclusion drops what never needed storing, and index tiers decide how long the rest lives. You choose what reaches storage and for how long, rather than finding out after the fact.
3. Exclusion is configured after detection and measurement:
The pipeline puts Exclude Unwanted Logs at stage 06, after Log Policies at 04 and Generate Metrics at 05. You decide what to drop at the point in the flow where detection and measurement have already been configured, rather than at the front door.
4. One pipeline instead of stitched-together tools:
Tools joined at the edges have a seam at every boundary, and a log format change breaks something downstream of one of them. Here a parser change flows into detection, metrics, indexing, and forwarding with nothing to reconcile.
5. Collection method stops being an architectural commitment:
Syslog, Windows Event Log, agents, forwarders, and agentless profiles all converge on the same path. You can pick whichever method suits how a source is managed, and change it later, without changing anything downstream of ingestion.
6. Sensitive values are handled by the same processors that shape the event:
Masking is one of the processor transforms you configure, alongside rename, extract, and derive. You define it once, in the pipeline, rather than per query or per consumer.
Conclusion
What you are left with is a log estate that runs on rules you wrote once rather than on attention you spend daily. The cost of keeping your logs turns into a decision rather than an accident, since you choose what never reaches storage and which tier holds the rest and for how long. A detected problem produces an action, because the policy that fires can run the remediation itself.
Ready to implement Observability Pipeline for Log Data?
Discover how Motadata ObserveOps can help you monitor your infrastructure in real-time and respond to issues instantly.