How to Monitor Docker Containers You Cannot Rebuild or Redeploy
How long would it take you to get one new line of code into the container running your payment service? In a lot of organizations, the answer runs to weeks, because the change has to clear a build owner, a test cycle, and a release window that nobody wants to open early.
That timeline is why so much monitoring advice fails on contact. Most of it opens by telling you to add a library, rebuild the image, and push a new version. If you could do that this afternoon, you would have done it already.
The situation here is narrower and far more common. The image belongs to another group, or it came from a vendor, or it has run untouched since the last person who understood the build left. You still need to know why it is slow, and the packaging difference underneath all of it is covered in our post on containers and virtualization.
In this blog, you will see why image changes stall in practice, what each class of signal can and cannot tell you, how four approaches compare when your hands are tied, and how host-level instrumentation changes the onboarding sequence.
Why Can't You Add Instrumentation to a Running Docker Container?
Docker container monitoring usually assumes you control the image, and that assumption breaks the moment the image belongs to somebody else. Adding a language agent or a tracing library, the standard route into application performance monitoring, means editing a Dockerfile, rebuilding, testing, and releasing. Each of those steps has an owner, and the owner is rarely the person being paged at two in the morning.
Three things block that change in practice:
Image ownership: The Dockerfile lives in an application repository governed by a development group with its own backlog. A monitoring request enters that backlog as a low-severity ticket and competes with feature work
Change control: An approved edit still has to move through build, test, and a scheduled release. In regulated environments that sequence carries an approval record and a freeze calendar, which can push a one-line change out by a quarter
Third-party and legacy images: A vendor image cannot be modified without voiding support, and an old internal image whose build environment no longer exists cannot be rebuilt at all
None of these are technical problems, which is why technical advice does not solve them. The constraint is organizational, and the monitoring approach has to work inside it.
What Are You Missing When the Image Is Off Limits?
When the image is off limits, you keep the infrastructure view of docker container monitoring and lose the application view. Knowing which is which prevents wasted effort, because these four signal types come from different places and answer different questions.
Host metrics: CPU, memory, disk, and network figures for the machine running the Docker daemon, collected by an agent on the host regardless of what any container holds
Container metrics: Per-container resource consumption read from kernel control groups, also collected from outside, so a locked image does not block them
Traces: The path a request takes through your services, including how long each hop took and where it failed. This has traditionally required instrumentation inside the application process
Service discovery: Knowing which service runs in which container, what it talks to, and when it appears. Without it you have a list of container IDs rather than a picture of an application
The first two survive a locked image. The last two are what you lose, and they are the two that answer the question you were actually asked, which is why a specific request is slow. A working definition is on our container monitoring glossary page.
What Does an Unmonitored Container Cost the Business?
An unmonitored container costs resolution time on the services that matter most, because the containers hardest to instrument are usually the oldest and the closest to revenue. The payment gateway nobody wants to touch is exactly the workload where an outage is counted in lost transactions rather than engineering hours.
Three effects reach a business scorecard before they reach a monitoring dashboard:
Longer incidents on high-value services: Every investigation that starts without request-level evidence spends its first hour eliminating possibilities. That time is added directly to MTTD and to the time a customer-facing service stays degraded
Ownership disputes replace fixes: Without a trace showing which service consumed the time, an incident bridge turns into a negotiation between infrastructure, application, and database owners with no evidence to settle it
Coverage reporting loses credibility: If a share of your workloads cannot be instrumented, availability reporting carries a gap that no dashboard discloses. That matters at audit, and when a service level commitment is signed against numbers that do not cover everything
The case for solving this rarely rests on tooling cost. It rests on whether the services carrying revenue can be explained when they fail.
What Are the Four Ways to Monitor Docker Containers You Cannot Rebuild?
There are four practical approaches to how to monitor Docker containers when the image is locked, and they separate cleanly on deployment work and on how much application ownership each one demands. Most docker monitoring tools implement one or two of these, so the comparison below is about approach rather than product.
Approach | Deployment work | Application ownership needed | Service discovery | Trace visibility | Container lifecycle tracking |
1. Image modification | Docker file edit, rebuild, test, release | Full, requires the build owner | Manual registration per service | Deep, including internal method calls | Follows redeploy cycles |
2. In-container agent | Sidecar or injected process per container | Partial, needs runtime config access | Per-container setup | Depends on language support | Requires config for each new container |
3. Host metrics only | Single agent on the Docker host | None | Container IDs, no service mapping | None | Immediate, containers appear as resources |
4. Host-level eBPF | Single deployment on the Docker host | None | Automatic, services identified from traffic | Request paths across service boundaries | Automatic as containers start |
Rows one and two are the standard answers, and both fail the constraint this article started with. Row three is what most organizations settle for, which explains why so many incident reviews end with an unhealthy container and no account of what it was doing. Row four changes what is possible without changing anything inside the container.
Before looking at what row four adds, it helps to be precise about how far row three actually goes, because it is further than most people assume.
Which Docker Metrics Can You Collect from the Host Alone?
The docker metrics available from the host cover resource behavior for every container on the machine, with no cooperation required from the image. This is the foundation of docker container performance monitoring, and its ceiling is worth knowing precisely.
CPU throttling: How often the container hits its quota and was held back. A container can show moderate CPU usage and still be throttled hard, which reads as application slowness with no obvious cause
Memory usage against the limit: Working set, cache, and how close the container runs to the point where the kernel terminates it. Repeated out-of-memory kills appear here before anyone reports an outage
Network throughput and errors: Bytes moved in each direction, dropped packets, and error counts per container interface
Disk read and write activity: Throughput and operations per second, which matters most for containers writing logs or backing a database
Container state and restart count: Running, paused, exited, and how often the container has restarted. A climbing restart count is the earliest clear signal of a container failing under load
That set supports capacity work and alerting. What it cannot tell you is which request was slow, which downstream call caused it, or which container on that host serves the checkout page. Docker performance monitoring built only on resource figures names a symptom and stops there.
What Do Docker's Built-In Commands Give You?
Docker ships three commands that read a container from the outside, and all three work on an image you cannot rebuild. They make a good first check and a poor standing arrangement.
Live resource stream: docker stats reports current CPU, memory, network, and disk figures for running containers
Lifecycle state: docker ps lists what is running, what has exited, and how long each container has been up
Application output: docker logs returns whatever the container wrote to its standard output and error streams
What they cannot do is retain history, alert anyone, or connect one container's behavior to another's. They answer a question you are asking at a terminal about a host you already suspected. Most docker monitoring tools exist to turn those same readings into retained history, thresholds, and correlation across hosts.
How Does Host-Level eBPF Change the Onboarding Workflow?
Host-level eBPF changes the onboarding sequence by moving instrumentation out of the container and into the kernel of the host it runs on. The kernel observes the traffic an application produces and reconstructs its behavior from outside, so the container and the image both stay untouched.
There is no build step, no redeploy, and no per-service registration, so the work that normally waits on an application group leaves the plan. For anyone approving the project, that removes the dependency most likely to delay it.
Onboarding a Docker host takes fewer moving parts than a per-container rollout, and the diagram below traces the path from kernel observation to the views an engineer opens.
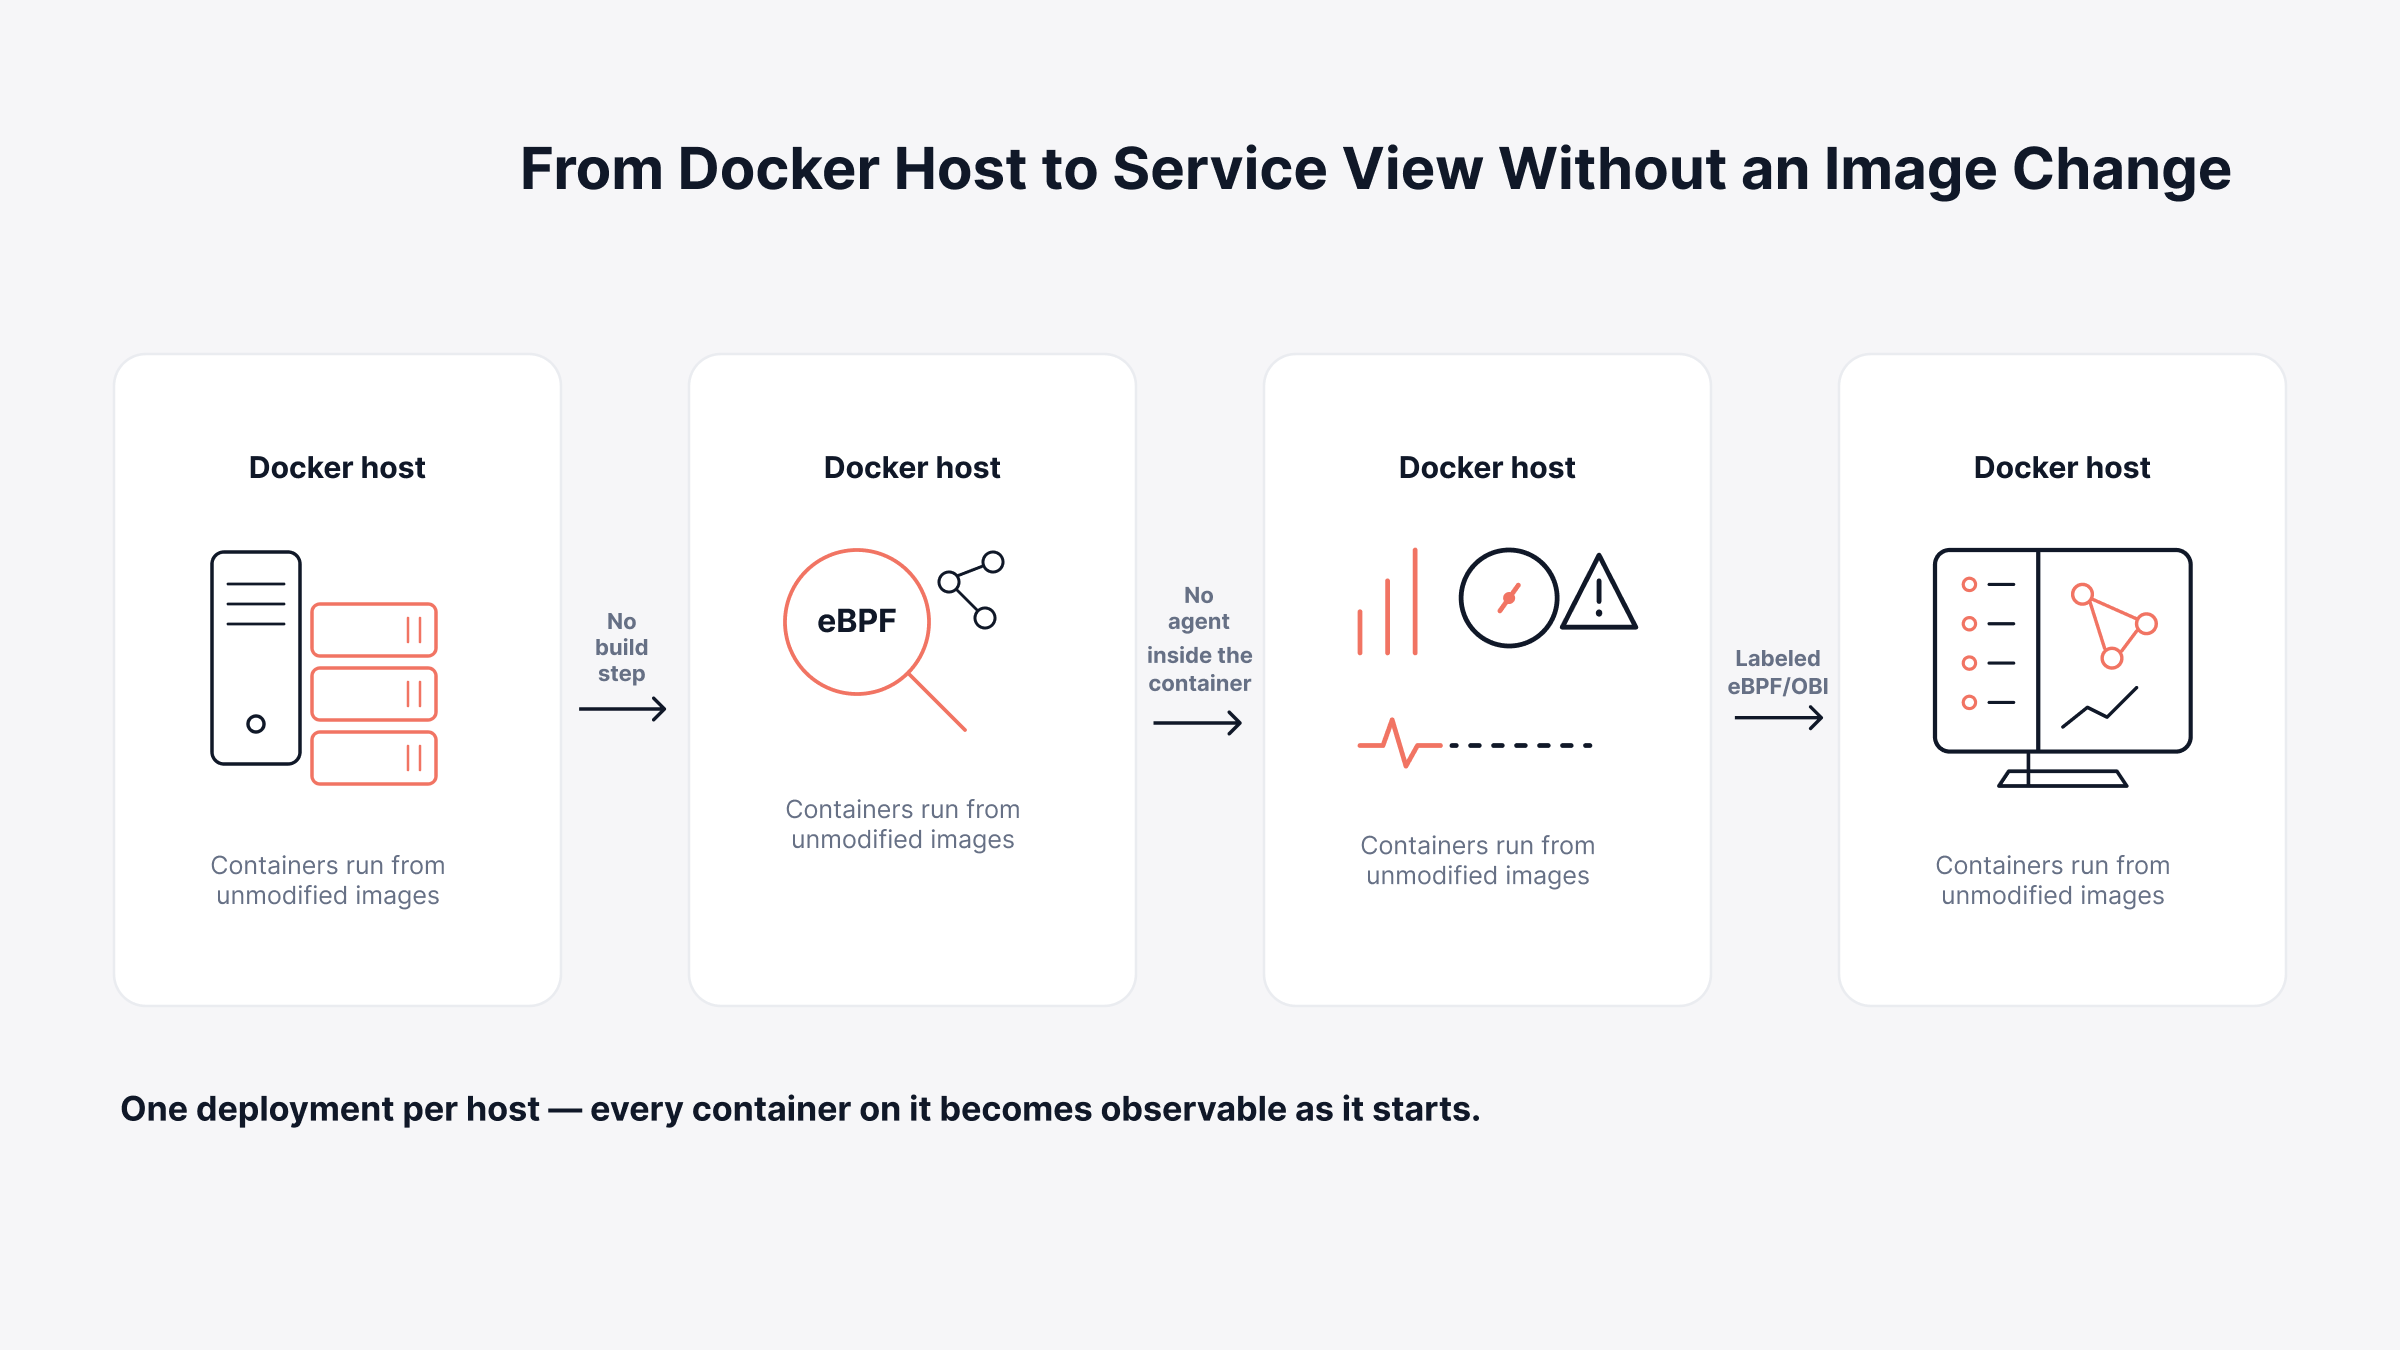
Motadata ObserveOps delivers this through eBPF instrumentation, which discovers running services and captures request count, latency, error rate, and trace and span data with no code change and no agent installed inside the container. Those services land in the same service list, service map, and dashboards that agent-instrumented services use, each labeled by instrumentation source, so nobody has to guess how a given service is being observed.
What Can You Identify About a Container Without Touching It?
Host-level instrumentation identifies a container by the traffic it produces, which is enough to attach a service identity to something you cannot open. A container stops being an opaque ID in a list and becomes a named service with dependencies you can follow.
What gets established from outside the container:
Service identity: The service is discovered from observed traffic and named in the service list rather than registered manually
Communication paths: Which services call this one and which it calls, assembled into a service map
Request behavior: Throughput, latency percentiles, and error rate per discovered service, alongside every other service in application performance monitoring
Instrumentation source: Each service carries a label showing how it is observed, so coverage gaps stay visible
Alongside the service itself, the discovered view carries the container name, the image it was built from, the port it listens on, the language or runtime it runs, and the Docker host it belongs to.
Request paths are reconstructed as spans, which makes distributed tracing possible for a service nobody instrumented. The depth differs from a language agent inside the process, and the checklist near the end of this article covers where that difference matters.
Identity answers what a container is. The next question is what happens when the set of containers changes, which in most Docker environments is constantly.
How Do Started and Stopped Containers Appear in Monitoring?
Newly started containers appear on their own, because discovery is driven by observed traffic rather than by a registration step. A container that starts serving requests becomes a visible service without anyone adding it to a configuration file, which is the behavior that matters most in an environment where containers are replaced rather than patched.
Stopped containers are handled differently, and the distinction is worth setting up before you need it. A service that stops sending traces can be flagged through a No Trace Received alert configured when the service is registered, so silence is treated as a condition rather than an absence of data. Without that, a container that dies quietly looks the same as a container with no traffic.
How Do You Investigate a Slow Container You Cannot Rebuild?
With identity and lifecycle handled, the practical test is whether all of it holds up during an incident. Investigating a slow container without modifying it means working from the outside in, starting with the resource picture and moving to the request picture. The order matters because resource pressure and application latency produce similar complaints and different fixes.
The sequence below separates the two, so an investigation reaches a cause instead of a symptom you cannot act on.
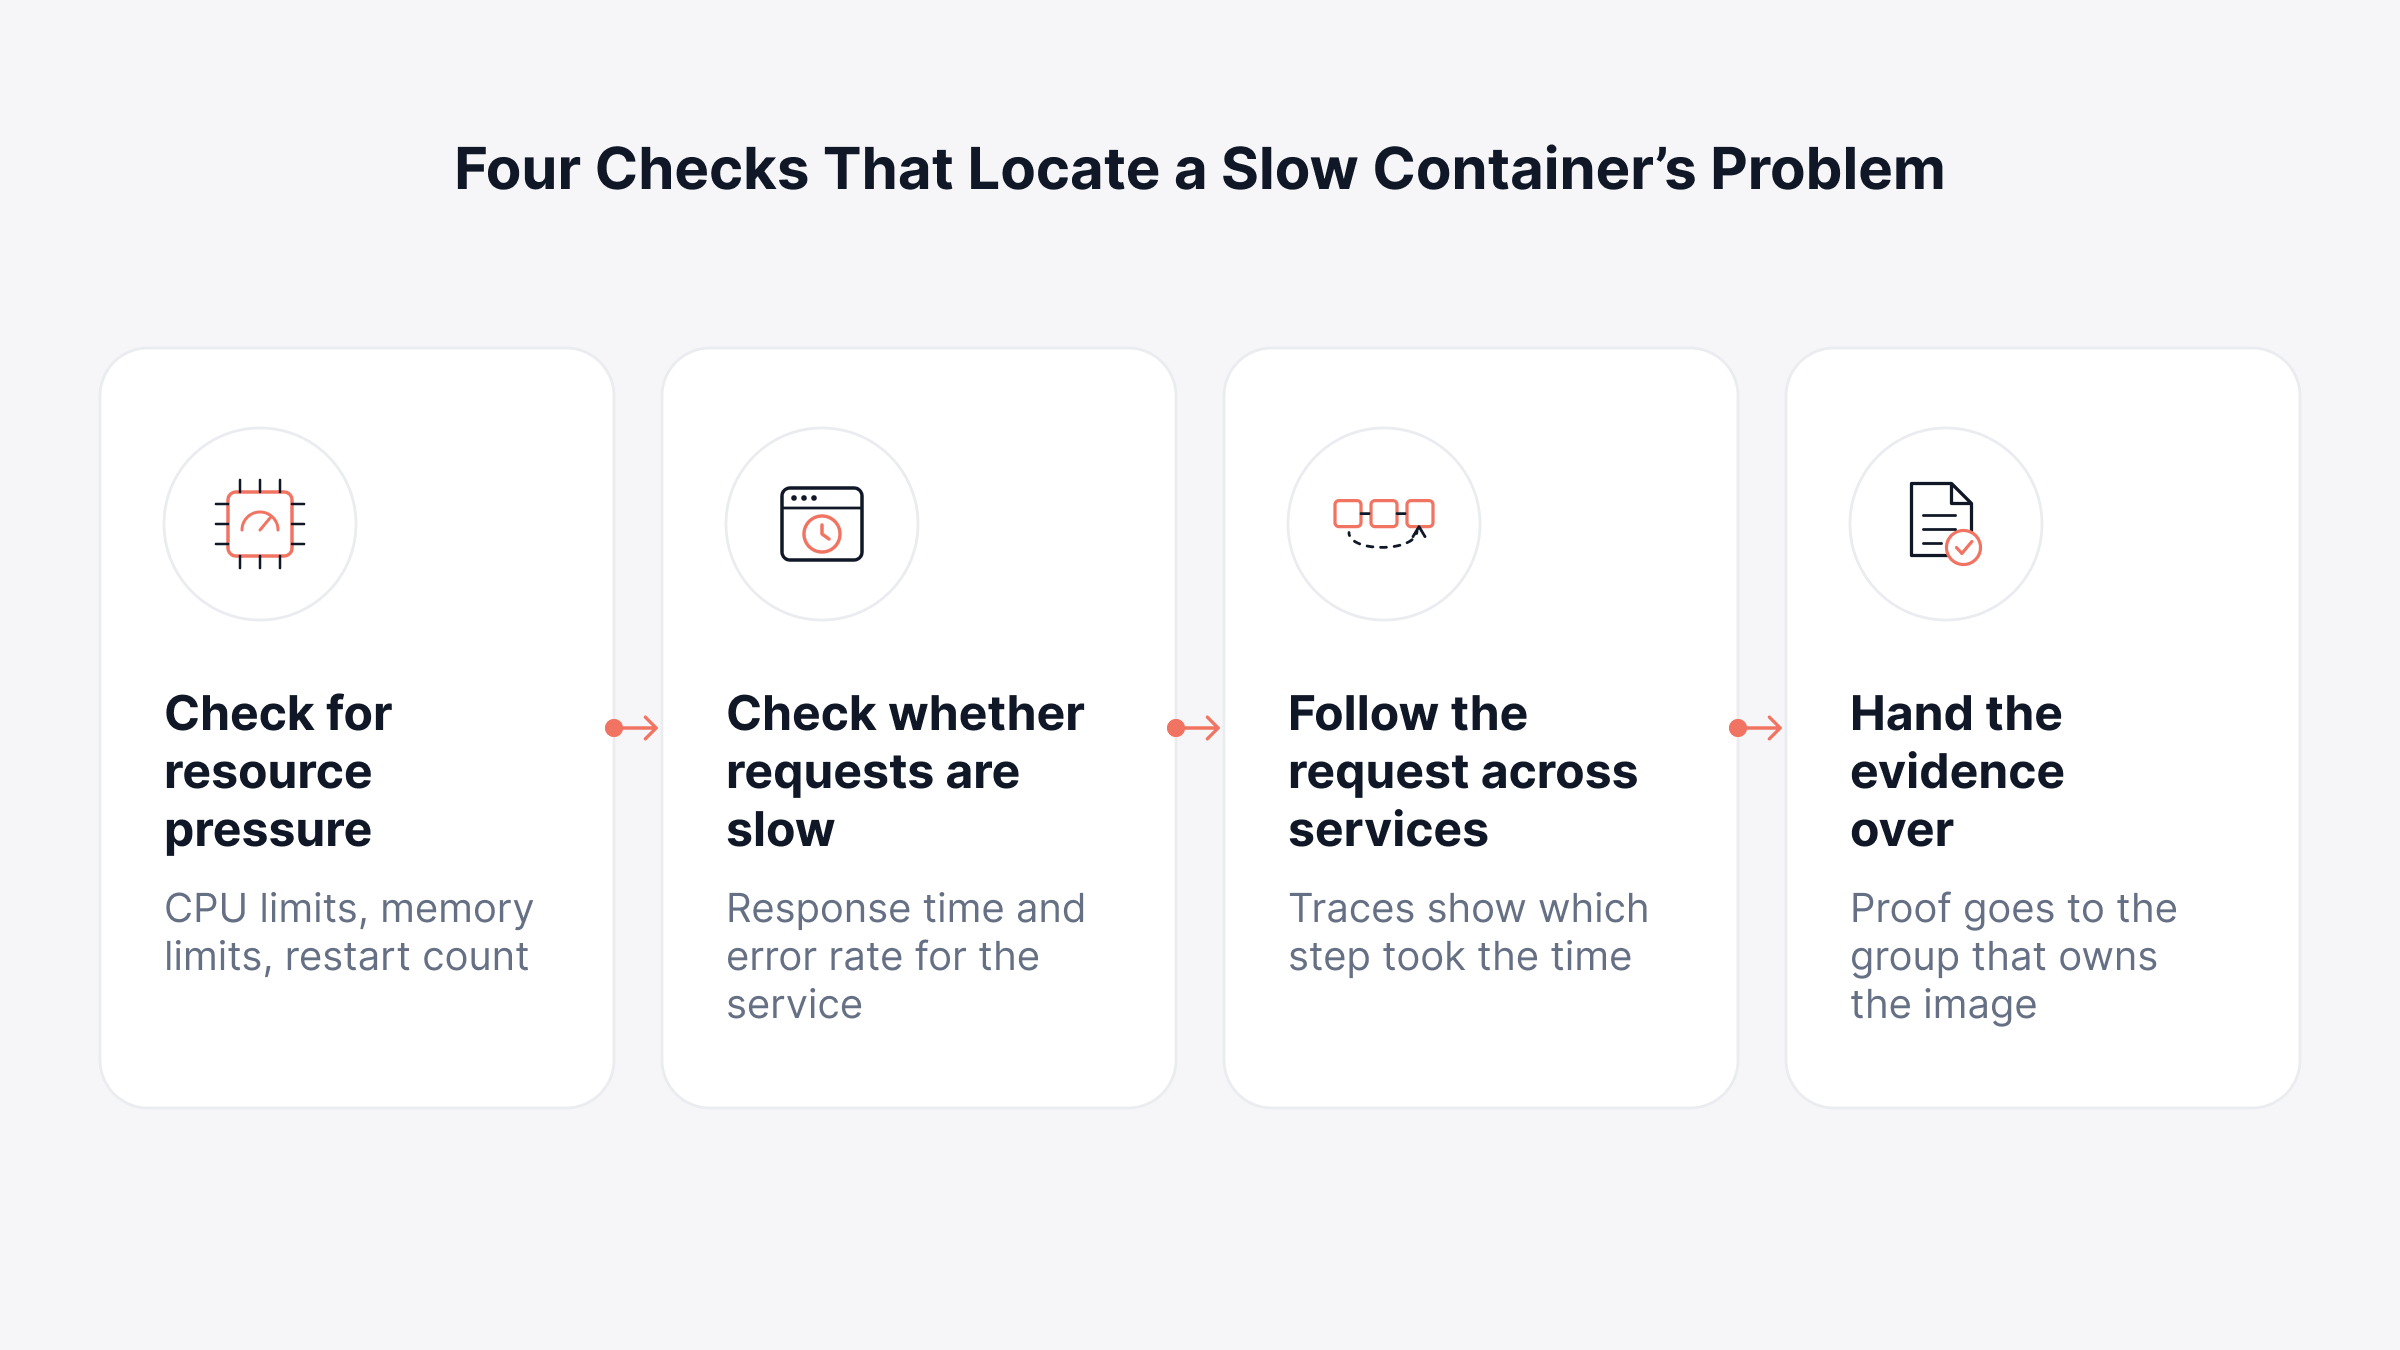
The final stage carries more weight than it looks. When you cannot fix the container yourself, your deliverable is evidence, and a trace showing that one downstream call consumed most of the request is harder to deflect than a CPU graph.
What Should You Check Before You Pick an Approach?
Before choosing an approach, work through the constraints in your own environment rather than the capabilities in a feature list. These are the questions that change the answer:
Who owns the image and how often they release: If a change lands within days, in-process instrumentation is the deeper option and worth the wait
Whether the workload is third-party: Vendor images that lose support after modification settle the question immediately
Whether you need code-level or request-level detail: Method timings and garbage collection behavior need an agent inside the process
How often new containers are created: High churn favors automatic discovery, because manual registration will never keep pace
Which languages are involved: Coverage varies by runtime under every method, so confirm yours before committing
What should happen when a container disappears: Decide whether silence raises an alert, and configure it at registration rather than after the first missed outage
Which of these workloads carry revenue or a service level commitment: Instrument those first, because coverage gaps are only tolerable on services nobody will be asked to explain
One limit belongs to that list. Host-level instrumentation observes what crosses the kernel, so behavior confined entirely to a process stays out of reach. Database tracing in Go still depends on the application using the appropriate context methods with a tracing wrapper.
Bring Locked Container Images into Motadata ObserveOps Without a Redeploy
Advice that begins with rebuilding the image assumes an authority most engineers running containers do not have. Motadata ObserveOps takes the other route, discovering services from the traffic they produce at the kernel level and presenting them in the same service list, service map, traces, and dashboards as everything else. For images you can change, Docker application monitoring through the unified agent adds code-level depth on top, so both kinds of workload are investigated in one place.
The concession is worth stating plainly. Observation from outside the process will not match an in-process agent for method-level detail, and any vendor claiming otherwise is overselling. What it does is turn a container nobody can open into a named service with measured latency, a visible dependency path, and evidence you can hand to the group that owns the build.
FAQs
What is Docker container monitoring?
Docker container monitoring tracks the health, resource consumption, and application behavior of running containers. It spans two layers, the resource picture collected from the host and the request picture collected from the application. The second layer has traditionally required instrumentation inside the container.
Can you monitor a Docker container without modifying the image?
Yes. Container resource metrics have always been readable from outside through kernel control groups, and host-level eBPF extends that to service discovery and request tracing. Motadata ObserveOps uses the second route, so a locked image needs no Dockerfile edit and no redeploy to become a monitored service.
Which Docker metrics matter most for performance troubleshooting?
CPU throttling, memory usage against the configured limit, and restart count identify most resource-driven problems. Network and disk figures matter for containers moving data or writing heavily. None of them explain which request was slow, so latency and error rate belong alongside them.
How is host-level eBPF different from an in-container agent?
An in-container agent runs inside the application process and reports from within, giving deeper code-level detail. Host-level eBPF observes traffic at the kernel and reconstructs behavior from outside, needing no code change and no install inside the container. Motadata ObserveOps supports both paths and reports them into the same views, so the trade between depth and reach is made per workload rather than once for everything.
Does monitoring a container from the host show application errors?
It shows errors visible in observed traffic, including error rates and failed requests across service boundaries. Exceptions raised and handled inside the process without affecting a response stay invisible. For that level of detail, in-process instrumentation is still required.
Author
Poonam Lalani
Content Strategist
Poonam Lalani is a B2B content strategist and writer with a background in computer engineering and experience across enterprise technology domains, including AI, cloud, DevOps, data engineering, and IT operations. She specializes in creating research-driven content that simplifies complex ideas and supports product education, thought leadership, and business growth.