Best Domotz Alternatives: 10 Network Monitoring Tools Compared
Most teams shopping for Domotz alternatives have no complaint about the price. Domotz publishes it, which most of this category does not.
They go looking because of where the platform stops. Its network monitoring answers whether a device is up and lets you reach it. It does far less to explain why the link is slow.
In this blog, you will see:
Ten alternatives compared: On how the bill scales, monitoring depth, and deployment.
Full reviews: Pricing, key features, and the cons worth knowing.
The five types of Domotz alternative: Replace only the part you need.
By the end, you will know which two or three deserve a trial.
Why Do Teams Look for a Domotz Alternative?
Teams leave Domotz for three main reasons. The bill tracks collectors and managed devices instead of your estate, the depth stops at visibility and remote hands, and the control plane only runs in Domotz's cloud.
1. The Bill Tracks Collectors and Managed Devices
Domotz sells two models. The Collector Plan costs $35 per collector per month, and every device that collector sees gets full platform access. The Managed Device option charges $1.50 per managed device per month, billed in bundles of ten at $15 each.
A collector covers one network. So a forty-site estate needs forty collectors, which is $1,400 a month before anyone counts devices.
The per-device option has a different catch. A managed device gets alerting, configuration backup, remote access, and SNMP polling. Every other device gets discovery, topology, and online-or-offline status, and nothing else.
That split decides what you actually bought.
Watch 300 devices and pay for 80, and the other 220 land in an inventory list instead of a monitoring one. We have watched a twelve-site MSP find that out at renewal.
Third-party roundups still quote Domotz at a per-site rate, so check the current page before you model anything.
2. Depth Stops at Visibility and Remote Hands
Domotz tells you a device went down and lets you reach it. It does that well, over SNMP, with SSH, RDP, VNC, and remote power management on every plan.
What it does not carry is the analytical layer underneath. There is no flow analysis, so a saturated uplink shows as high utilization with no conversation behind it. There are no logs, no traces, and no SLA reporting.
Its own blog concedes the pattern. On loop detection it states that Domotz "does not include a dedicated native loop detection algorithm" and that loop awareness comes through topology and SNMP instead.
None of that matters while incidents end at a reboot. It matters the week a director asks which application saturated the WAN link on Tuesday. We see that question land hardest on teams whose incidents moved from hardware to traffic.
3. The Control Plane Only Runs in Domotz's Cloud
Collectors sit inside your network, but the platform managing them is Domotz's SaaS. There is no self-hosted control plane, so the topology, alert history, and credentials live with the vendor.
Most MSPs take that trade gladly, because it removes a server to run. For a bank, a hospital, or a utility with data-residency rules, it ends the evaluation early.
None of this makes Domotz a weak product. It rates 4.8 on G2 and ships SOC 2 Type II.
Its pricing page carries no tiers and no feature gating, and it charges nothing per user, so adding technicians never costs more. If this line item was due a review anyway, that review pays off more now than at renewal.
What Are the Five Types of Domotz Alternative?
Domotz alternatives fall into five groups, and picking your group first shortens the list fastest.
Here is how the ten tools sort:
Type | What you are replacing | Tools |
Cloud network management | The direct swap: discovery, topology, alerts, no server of your own | Auvik, LogicMonitor |
RMM platforms | Network monitoring plus endpoints, patching, and technician workflow | NinjaOne, Atera |
Traditional NMS | Deeper polling and reporting, usually on a server you run | Paessler PRTG, ManageEngine OpManager, SolarWinds |
Open source | The whole job, with engineering time in place of a subscription | Zabbix, LibreNMS |
Unified observability | Network data beside flows, logs, traces, configs, and SLAs | Motadata ObserveOps |
The first group makes the shortest move, and the second suits an MSP whose tickets are mostly laptops.
The third and fourth buy depth with money or with hours. The fifth pays off when you are cutting tools, which is the trade a unified observability platform asks you to make.
How Did We Evaluate These 10 Tools?
We scored every tool below on the same five factors.
How the bill scales: Whether cost tracks collectors, devices, sensors, nodes, endpoints, or technicians.
Monitoring depth: Whether the tool explains a slow link or only reports a dead one.
Discovery and topology: How the map is built, and whether it refreshes without a prompt.
Deployment: SaaS, self-hosted, or both, since Domotz offers only the first.
Multi-site and multi-tenant fit: What happens at forty sites or forty clients.
Two honesty notes. We ran no lab benchmark, so nothing here reports a measured poll time. All pricing comes from public vendor pages checked in September 2026, and vendors change it without notice.
The 10 Best Domotz Alternatives Compared
The table below puts all ten side by side. Domotz sits in the last row as your baseline.
Tool | Best For | Deployment | Pricing Model | Free Option |
Motadata ObserveOps | Network, server, and app data on one license | On-premises, private or public cloud, SaaS | Per monitored device, quoted | Free trial |
Auvik | The closest cloud swap, with deeper topology | SaaS, collector on site | Per billable device, quoted | 14-day trial |
NinjaOne | MSPs that manage endpoints as well as networks | SaaS, agent on endpoints | Per endpoint, quoted | Free trial |
Paessler PRTG | Granular polling of anything with a metric | Self-hosted, or PRTG Hosted | Per sensor, published tiers | 100 sensors free |
ManageEngine OpManager | An all-in-one NMS at a mid-market price | Self-hosted, cloud option | Per device, by edition | Free trial |
LogicMonitor | Hybrid estates that outgrew a network tool | SaaS, collector on site | Per hybrid unit, published | 14-day trial |
Zabbix | Teams with Linux skills and no license budget | Self-hosted, or Zabbix Cloud | Free, GPL licensed | Free, unlimited |
SolarWinds | Large networks needing depth and reporting | SaaS or self-hosted Orion | Per node, published | 30-day trial |
Atera | Small MSPs wanting RMM, PSA, and billing | SaaS, agent on endpoints | Per technician, published | 30-day trial |
LibreNMS | Auto-discovery on a budget of zero | Self-hosted only | Free, GPL licensed | Free, unlimited |
Domotz (baseline) | Small sites, remote hands, flat pricing | SaaS, collector on site | Per collector or per managed device | 14-day trial |
The reviews below cover each one in roster order.
Detailed Overview of the 10 Best Domotz Alternatives
Here is a closer look at each one, Motadata ObserveOps first.
1. Motadata ObserveOps
Best for: IT teams that need the network explained, not only watched, on one platform.
Type: Commercial, unified observability platform.
Rating: G2 4.7/5, Gartner Peer Insights 4.6/5
ObserveOps starts where Domotz does. It discovers devices, reads CDP and LLDP neighbor tables, and keeps a network topology map that a scanner refreshes on its own.
Then it keeps going. Flow analysis names the conversations filling a link, configuration management tracks every device change, and SLO reporting turns availability into a commitment you can show a customer.
Switch port mapper and Spanning Tree monitoring cover the loop question Domotz leaves to inference.
Multi-site works differently too. Branch collectors poll locally and forward to one central server, so forty sites stay one deployment and one license instead of forty subscriptions.
Pros
- Flows, logs, configs, and metrics correlate on one topology instead of across three tools.
- Runs on-premises and in private cloud, where a SaaS-only platform cannot follow.
- Branch sites join one central deployment instead of billing as separate subscriptions.
- SLO reporting with correction and penalty profiles turns uptime into contract evidence.
- An alert can raise and route a ServiceOps ticket on its own.
Cons
- No per-device remote access or remote power management, both of which Domotz includes.
- The ITSM integrations are ServiceNow, Jira, and similar, not MSP PSA tools like ConnectWise.
- The licensing model is published, but the prices are not, so you cannot size it from the website.
- ObserveOps Infinity only reached general availability in August 2026, so the edition has a short field record.
- More platform than a five-site managed services business will use.
Pricing: Subscription quoted to your environment. ObserveOps Infinity meters the platform per monitored device, with network configuration management per managed device and flow monitoring per flow source, on one-year, three-year, or perpetual terms.
A feature list only tells you what a platform can do. Here is a review from an IT team that uses ObserveOps for their operations.
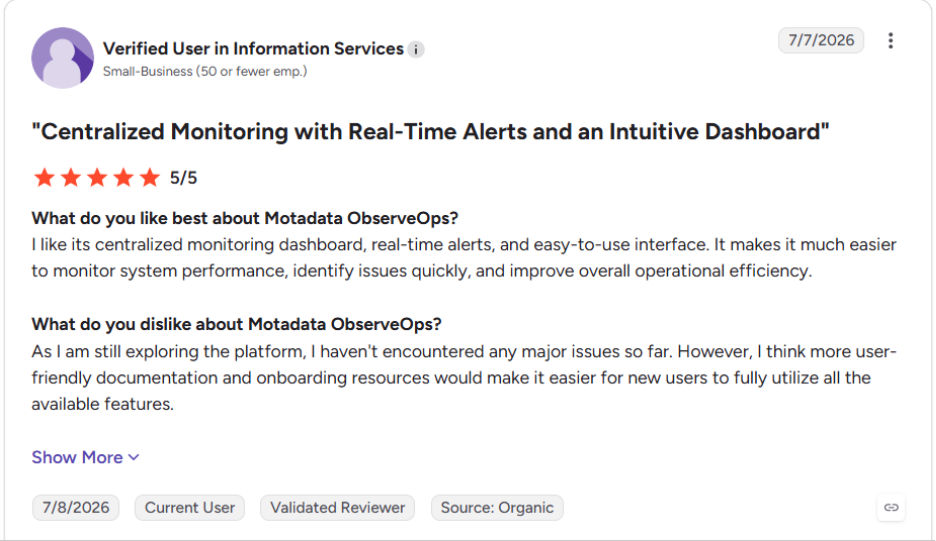
You can read the rest of the ObserveOps reviews on G2.
2. Auvik
Best for: MSPs and IT teams that want Domotz's shape with stronger mapping and documentation.
Type: Commercial SaaS.
Rating: G2 4.5/5, Gartner Peer Insights 4.5/5
Auvik is the tool Domotz compares itself against most often, and the closest like-for-like move. A collector runs on site, discovery is automatic, and the topology map covers Layer 1 through Layer 3 relationships, not a flat device list.
The depth shows in documentation. Configuration backups run continuously, syslog is captured centrally, and traffic analysis is available, which is the layer Domotz leaves out.
Cost becomes the trade. Auvik pricing is quote-only, and outside sources report roughly $25 to $50 per network device each month, with access points, printers, and workstations billed at nothing. In our experience the quote lands higher than a raw device count suggests.
Pros
- Mapping and network documentation are the strongest in this comparison set.
- Free device classes mean dense edge networks cost less than the raw count suggests.
- Deployment takes hours, not a project.
Cons
- No published price, so budgeting starts with a sales call.
- The billable-device rate is high enough that switch-heavy estates get expensive fast.
- Network-focused, so servers and applications need another tool beside it.
Pricing: Quote-based across two tiers, Essentials and Performance. Reported at about $25 to $50 per network device per month, with volume discounts from around 500 devices.
3. NinjaOne
Best for: MSPs whose tickets are mostly laptops and servers, not switches.
Type: Commercial SaaS, remote monitoring and management.
Rating: G2 4.7/5, Gartner Peer Insights 4.8/5
NinjaOne answers a different question than Domotz. It is an RMM first, so patching, software deployment, endpoint automation, and remote control are the core, with SNMP device monitoring alongside them.
That makes it a swap only for thin Domotz deployments. Teams that bought Domotz for topology and multi-site network visibility will find the network half lighter here, while teams that bought it for remote access will find more.
Pros
- One console covers endpoints and network gear, which usually beats two subscriptions.
- Volume pricing falls sharply as endpoint counts grow.
- Onboarding is quick and the interface needs little training.
Cons
- Network mapping and topology are thinner than a dedicated network tool.
- Pricing is quote-based, and the per-endpoint rate is highest for small teams.
- Modules are priced separately, so the quote grows with each one added.
Pricing: Quote-based per endpoint per month. NinjaOne states it starts as low as $1.50 at 10,000 endpoints, rising to $3.75 at 50 endpoints or fewer.
4. Paessler PRTG
Best for: Teams that want to poll anything with a metric and keep the server in-house.
Type: Commercial, self-hosted with a cloud option.
Rating: G2 4.6/5, Gartner Peer Insights 4.5/5
PRTG measures everything through sensors, and one sensor covers one metric on one device. A switch might use twenty. That model is why it reaches hardware, environmental probes, and services other tools skip.
It also drives the cost. PRTG pricing counts sensors, not devices, so sizing means estimating metrics per device before you buy, and licenses cannot be combined on one server.
Pros
- Published prices, so you can size the purchase without a sales call.
- Sensor coverage reaches gear that cloud tools ignore.
- Self-hosting keeps monitoring data inside your own network.
Cons
- Sensor counting is hard to forecast, and the estimate rarely survives first contact.
- You run and patch the server, unlike a SaaS collector.
- The interface shows its age next to newer cloud consoles.
Pricing: Subscriptions by sensor count, paid annually. PRTG 500 is $200 a month for about 50 devices, 2500 is $742 for about 250 devices, and 10000 is $1,642 for about 1,000 devices.
5. ManageEngine OpManager
Best for: Mid-market IT teams that want network and server monitoring from one vendor.
Type: Commercial, self-hosted with a cloud option.
Rating: G2 4.5/5, Gartner Peer Insights 4.5/5
OpManager is the traditional NMS answer, and it covers more ground than Domotz by design. Fault and performance management, switch port mapping, virtualization monitoring, and out-of-the-box dashboards all ship together.
An MSP edition adds client separation, which matters if you moved to Domotz for multi-tenant work. The catalog around it reaches into NetFlow analysis and configuration management, though those are separate ManageEngine products, not one platform.
Pros
- Broad device support with a large library of vendor templates.
- One vendor covers network, server, and virtualization monitoring.
- Runs on hardware you control, which suits regulated estates.
Cons
- Flow analysis and configuration management are separate products, so the stack grows.
- ManageEngine quotes by edition and device count instead of publishing a rate card.
- The interface carries a lot of options, which slows new administrators down.
Pricing: Licensed by edition (Standard, Professional, Enterprise) and device count, quoted through ManageEngine or a reseller. A free trial is available.
6. LogicMonitor
Best for: Hybrid estates where the network is one part of a much larger job.
Type: Commercial SaaS.
Rating: G2 4.5/5, Gartner Peer Insights 4.4/5
LogicMonitor sits a tier above Domotz in scope and price. Collectors gather from network devices, servers, cloud services, and applications, and the platform leans on automated discovery and AI-assisted alerting to keep that breadth manageable.
The unit of billing deserves a close look. LogicMonitor pricing counts hybrid units, and a switch, a virtual machine, and a cloud resource each consume them differently, so a device count does not translate cleanly.
Pros
- Published per-unit prices, which is rare among enterprise platforms.
- Coverage extends well past the network without a second product.
- Dependency-aware alerting cuts the storm when an upstream device fails.
Cons
- Hybrid units are hard to translate into a device count before a trial.
- Edwin AI and several digital-experience features are add-ons above the base rate.
- Priced for enterprises, so a small MSP will find it heavy.
Pricing: Essentials at $16, Advanced at $27, and Signature with Edwin AI at $53, each per hybrid unit per month.
7. Zabbix
Best for: Teams with Linux skills that would rather spend hours than license fees.
Type: Open source, GPL licensed.
Rating: G2 4.3/5, Gartner Peer Insights 4.4/5
Zabbix is the open-source default for network and infrastructure monitoring, and it is genuinely enterprise-grade. SNMP, IPMI, agent-based checks, templates, triggers, and distributed proxies for remote sites all ship with no license cost at any scale.
The cost moves to your team. Someone installs it, tunes the database, writes the templates, and keeps it alive, and that person becomes the dependency.
Pros
- No license cost at any device count, which no commercial tool here can match.
- Proxies handle multi-site estates without a per-site subscription.
- Data stays entirely on infrastructure you control.
Cons
- Setup and tuning take real Linux and database skill.
- No remote access or power management, so Domotz's remote-hands workflow disappears.
- Dashboards need building, where SaaS tools arrive with them.
Pricing: Free under the GPL. Paid support tiers and partner services are sold separately.
8. SolarWinds
Best for: Large networks that need depth, reporting, and a name procurement recognizes.
Type: Commercial, SaaS or self-hosted.
Rating: G2 4.3/5, Gartner Peer Insights 4.4/5
SolarWinds brings the deepest traditional network management on this list. Network Performance Monitor, NetFlow Traffic Analyzer, and Network Configuration Manager cover fault, flow, and configuration work that Domotz does not attempt.
It also demands the heaviest commitment. SolarWinds pricing starts around $8 per node per month for the Observability SaaS, and the self-hosted Orion modules are bought and licensed one at a time.
Pros
- Depth and reporting that satisfy enterprise and public-sector requirements.
- Both deployment models are supported, including fully self-hosted.
- The module catalog reaches almost every corner of network operations.
Cons
- Buying modules separately makes the real total hard to see at the start.
- Installation and administration need dedicated ownership.
- Far more platform than the small sites Domotz is usually bought for.
Pricing: Observability SaaS from about $8 per node per month, with self-hosted tools starting between $199 and $4,019 depending on the module.
9. Atera
Best for: Small managed services businesses that need billing and tickets in the same tool.
Type: Commercial SaaS, RMM with PSA.
Rating: G2 4.6/5, Gartner Peer Insights 4.6/5
Atera prices per technician instead of per device, which inverts the Domotz question entirely. Unlimited devices per seat means a dense client network costs nothing extra, and a growing team costs a great deal.
Scope draws people in. Remote monitoring, ticketing, billing, and reporting run in one subscription, so a two-person MSP can operate the whole business from it.
Pros
- Device growth never changes the bill, which suits dense client sites.
- Running the service business and monitoring it happen in one place.
- Prices are published per seat, so the model is easy to plan.
Cons
- Cost climbs steeply with headcount, so larger teams pay heavily.
- Network monitoring is shallower than any dedicated tool here.
- Topology mapping falls well short of Domotz's.
Pricing: Per technician per month. Atera pricing runs $149 on Professional, $189 on Expert, and $219 on Master when billed annually.
10. LibreNMS
Best for: Technical teams that want automatic discovery and will host it themselves.
Type: Open source, GPL licensed.
Rating: No significant G2 or Gartner Peer Insights listing.
Sysadmins name LibreNMS when the budget hits zero and discovery still has to happen. It walks SNMP, reads CDP, LLDP, OSPF, and BGP neighbor data, and builds an inventory and map without much configuration.
It came up repeatedly in the forum threads behind this list, which is why it earns a slot no vendor roundup gives it. There is no company behind it, which cuts both ways.
Pros
- Free at any scale, with discovery that rivals paid tools.
- Strong support for network vendor hardware through community definitions.
- Distributed pollers cover multiple sites at no extra cost.
Cons
- Community support only, so nobody is accountable when it breaks.
- No remote access, no power management, and no multi-tenant client portal.
- Installation and upgrades are a manual job on a server you maintain.
Pricing: Free under the GPL. Your cost is the server and the time to run it.
Are the Free Domotz Alternatives Good Enough?
Free Domotz alternatives work when you have a server, Linux skills, and no requirement for remote hands. Zabbix and LibreNMS both discover devices and alert on them with no license cost at all.
Two gaps decide whether that holds. Remote access opens the first gap. Domotz bundles SSH, RDP, VNC, and power management, and neither free tool replaces that, so a technician needs another route into the site.
Risk ownership opens the second. A self-hosted monitor sits on a box you patch and back up, and when it fails at 2 a.m. there is no support chat. PRTG's freeware edition avoids the hosting question but caps at 100 sensors, which covers roughly ten devices.
How Do You Choose the Right Domotz Alternative?
The table below pairs each reason for leaving Domotz with the tool that answers it.
Your Situation | Start With | Why |
You need to know why a link is slow, not just that it is | Motadata ObserveOps | Flow analysis, configs, and SLAs sit beside the topology |
You want the same workflow with better maps | Auvik | Layer 1 to 3 topology and continuous config backup |
Most of your tickets are laptops, not switches | NinjaOne | Patching and endpoint automation with SNMP alongside |
You want a published price and deep polling | Paessler PRTG | Sensor tiers are listed, and coverage reaches unusual gear |
You need servers and virtualization covered too | ManageEngine OpManager | One NMS spans network, server, and virtual machines |
The network is one part of a hybrid estate | LogicMonitor | Collectors reach cloud and applications, not just devices |
License budget is zero and Linux skills are not | Zabbix | Enterprise features and site proxies at no license cost |
You need flow, config, and path analysis at scale | SolarWinds | The deepest traditional module catalog on this list |
You run the business on the same tool | Atera | Tickets, billing, and RMM on one per-technician seat |
You want discovery tonight and will host it | LibreNMS | Neighbor-table discovery with no license and no vendor |
One question settles most of these shortlists. If your last three incidents ended when someone rebooted the device, a cheaper monitor will do. If they ended in a packet capture, the monitor was never the problem.
When Is Domotz Still the Right Choice?
Domotz still fits a specific case. Picture twenty small client sites, your work centers on uptime and remote hands, and you want one predictable invoice.
Very little on this list matches it there. Remote access and power management come included, not sold as add-ons, discovery needs almost no setup, and 100-plus PSA integrations drop it into an existing MSP workflow.
The reasons we see teams move are structural. The collector count grows with sites, the managed-device split decides which gear is really monitored, and the depth stops where performance analysis starts.
Replace Domotz With Motadata ObserveOps
Domotz answers one question well. Is the device up, and can you reach it from here? For a small MSP doing remote hands across many sites, that may be the whole job.
Motadata ObserveOps answers the next one. Flow analysis names the traffic filling a link, configuration management catches the change that broke it, and SLO reporting turns all of it into evidence, with branch collectors reporting into one deployment instead of a subscription per site.
We would not put it in front of everyone. A team that mainly needs remote access and power control should stay where it is.
Everyone else gets one platform to license and a map that explains itself, which is where network monitoring best practices have been heading for years.
FAQs
What does Domotz do?
Domotz is a cloud-managed network monitoring platform. A collector on each network discovers devices, draws topology, polls over SNMP, and provides remote access and power management. The platform targets visibility and remote hands, not performance analysis.
How much does Domotz cost?
Domotz charges $35 per collector per month with full access on every device that collector sees, or $1.50 per managed device per month in bundles of ten. There is no per-user fee, and the published route in is a 14-day trial.
What is the difference between a managed and unmanaged device in Domotz?
A managed device gets the full feature set, including alerting, configuration backup, remote access, and SNMP polling. Every other device keeps discovery, topology, and online-or-offline status only. That split decides how much of your estate is genuinely monitored.
Which Domotz alternatives run on-premises?
Zabbix, LibreNMS, PRTG, OpManager, and self-hosted SolarWinds all run on your own servers, and Motadata ObserveOps runs on-premises, in private cloud, or in public cloud. Auvik, NinjaOne, LogicMonitor, and Atera are SaaS only, like Domotz.
Is Motadata ObserveOps a good Domotz alternative?
It fits teams that need flows, configuration management, and SLA reporting beside discovery and topology, with an on-premises option. It is a poor fit if your main requirement is remote desktop access and power cycling, which Domotz includes and ObserveOps does not.
Author
Ramya Shah
Technical Writer
Ramya Shah is a technical content writer with a computer engineering background and roots in automotive journalism. He covers IT Service Management, observability, IT operations, and AI-driven automation. An early adopter of AI-assisted writing workflows, he turns complex IT processes into clear, engaging content optimized for search and answer engines (AEO), lifting content output and organic visibility.