10 Best Network Discovery Tools to Find Every Device on Your Network
Network discovery tools find every device on your network and tell you what each one is, from switches and firewalls to servers and cloud instances.
That matters more than it sounds. Palo Alto Networks looked at 27 million devices and found that 32.5% of them operate outside IT control.
We compared ten tools on how they find devices, what credentials they need and what happens after a scan.
In this blog, you will:
Compare 10 tools: On discovery methods, rediscovery and what a found device becomes.
See real pricing: Where vendors publish it.
Read the cons: Ours included.
What Is a Network Discovery Tool?
A network discovery tool is software that finds the devices on your network and works out what each one is. Hand it a subnet plus SNMP, SSH or Windows logins, and what comes back isn't 10.1.4.22 anymore. It's a Cisco switch with 48 ports, a model number and a firmware version you can actually look up.
Pinging a range only proves something is there. Discovery goes further and answers what it is, whose it is and whether anything's watching it, which is what you need in an audit or halfway through an outage. Drawing the links between devices is a separate job, handled by network mapping tools.
How Does Network Device Discovery Work?
Network device discovery works in layers. A cheap ping sweep finds the live addresses first, and then credentialed queries over SNMP, SSH, WMI or cloud APIs log in and pull out what each device really is.
Method | What It Finds | What It Misses |
ICMP ping sweep | Live IP addresses on a subnet | Anything with ping blocked, plus what the device actually is |
ARP table reads | MAC addresses and vendor prefixes on the local segment, including quiet devices | Anything beyond the router, since ARP stays on its own subnet |
SNMP queries | Hostname, model, OS version, interfaces and serial numbers | Devices without SNMP enabled or with the wrong community string |
CDP and LLDP | Which switch port each neighbor plugs into | Vendors and devices that don't run either protocol |
PowerShell, WMI and SSH | Installed software, services and hardware on servers | Network gear, and any server you don't hold credentials for |
Cloud APIs | Instances, load balancers and VPCs in AWS, Azure or Google Cloud | On-premises devices entirely |
The ARP table row is the one people forget. A printer with ping disabled still has to answer ARP to talk to anything, so a tool that reads the router's ARP cache will catch it when a sweep walks right past.
How We Evaluated These Tools
Every vendor here says it finds your whole network. We checked four things that decide whether you end up with a real inventory or just a long list of IP addresses.
Discovery reach: Can it log in over SNMP, SSH, WMI and cloud APIs? And does it stop at switches and routers, or does it find your servers, VMs and cloud accounts too?
Scope input: Some tools want one IP at a time, some take ranges and CIDR blocks, and the better ones accept the CSV your team already keeps. We also checked whether a remote site can get its own collector.
What happens after discovery: In one tool a found device just sits in a list. In another it's being monitored before you look, and in a third it becomes an asset record, which is a very different result.
Rediscovery: New devices are the easy part. We looked harder at whether the tool spots a new interface on a switch it already knows, or a VM someone spun up on a host it already watches.
We took ratings from G2 and Gartner Peer Insights. Pricing comes from each vendor's own pages, and quote-based means the vendor publishes a licensing model with no price attached.
The 10 Best Network Discovery Tools Compared
Here are all ten side by side on the four criteria above.
Tool | Best For | Discovery Methods | After a Device Is Found | Rediscovery | Starting Price |
Motadata ObserveOps | Discovery that turns into monitoring | SNMP v1/v2c/v3, PowerShell, SSH, cloud APIs, ICMP | Provisioned as a monitor, by hand or automatically | Scheduled runs plus per-instance rediscovery | Quote-based |
SolarWinds NPM | Big estates that run mostly on SNMP | SNMP, ICMP, WMI | Imported as a node you monitor | Discovery jobs on a schedule | Quote-based |
ManageEngine OpManager | On-prem teams who want devices sorted by rules | SNMP, ICMP, WMI, CLI | Matched to a template, then monitored | Discovery on a schedule | Quote-based |
Paessler PRTG | Small and mid-sized networks | SNMP, ICMP, WMI, device templates | Sensors get created for you | Scheduled auto-discovery | $200 a month, billed yearly |
Auvik | Multi-site networks with no server to run | SNMP, WMI, ICMP from a site collector | Added to the cloud inventory and map | Continuous | Quote-based |
Progress WhatsUp Gold | Port-level Layer 2 and Layer 3 discovery | SNMP, ICMP, WMI, Layer 2 and Layer 3 scans | Monitored and mapped down to the port | Scheduled rescans | Quote-based |
LogicMonitor | Hybrid estates already on SaaS observability | NetScans from collectors over SNMP, WMI, SSH | Added to monitoring automatically | Recurring NetScans | $16 per hybrid unit per month |
Domotz | MSPs and multi-location teams | Collector per site, SNMP, ICMP, MAC identification | Listed and monitored per collector | Continuous | $35 per collector per month |
ScienceLogic Skylar One | Large enterprises and service providers | Discovery sessions over SNMP, ports, DNS, certificates | Matched to Dynamic Applications | Nightly auto-discovery | Quote-based |
Datadog | Teams already running the Datadog Agent | SNMP autodiscovery across subnets | Monitored as a network device | Continuous via the Agent | $7 per network device per month |
Detailed Overview of the Top 10 Network Discovery Tools
For each tool we cover how it finds devices, what you need to hand it first, and where its discovery runs out. All-in-one platforms come first. The narrower and SaaS-only picks sit further down.
1. Motadata ObserveOps
Best for: Teams tired of exporting a discovery list into a spreadsheet just to set up monitoring in another tool.
Rating: G2 4.6/5, Gartner Peer Insights 4.6/5
Pricing: Quote-based. ObserveOps Infinity is licensed per monitored device.
We split discovery into two things you set up once. The credential profile is the login, one protocol each, so an SNMP community string, an SNMPv3 user, an SSH key, a PowerShell account or a cloud key. Then the discovery profile says where to use it, and that can be one IP, a hostname, a range, a CIDR block or a CSV you upload.
Each profile has a category. That's how one screen ends up handling switches and routers over SNMP, Linux boxes over SSH, Windows servers over PowerShell, and AWS, Azure, Office 365, Oracle Cloud and Google Cloud through their APIs. Virtualization, storage, wireless controllers, IP SLA WAN links, containers and databases have categories of their own, sixteen in all.
There are two checkboxes we'd look at before the first run. Ping Check is on by default, and turning it off is how you catch the printer or firewall that ignores ICMP. Interface Discovery is on too, which is why a switch shows up with its ports already listed.
When a run finishes, everything it found waits on a Provisioning screen and you tick what should become a monitor. Scheduled runs, whether once, daily, weekly or monthly, have an Auto Provision box that skips that screen entirely. So the switch someone racked at a branch last week is usually being monitored before anyone thinks to raise a ticket for it.
Most tools stop at new IP addresses. We kept going, because a lot of change happens inside devices you already monitor, like a new interface, another EC2 instance or three more VMs on an ESXi host. Separate rediscovery schedulers look for those, plus applications, services and containers, and each one runs on its own timetable.
Discovery is one part of our unified observability and ITSM platform, so the devices it finds are the same ones monitoring, alerting and reporting work from.
Star ratings only tell you so much. It helps to hear from a team that runs ObserveOps every day. Check out this ObserveOps review from Manish on G2.
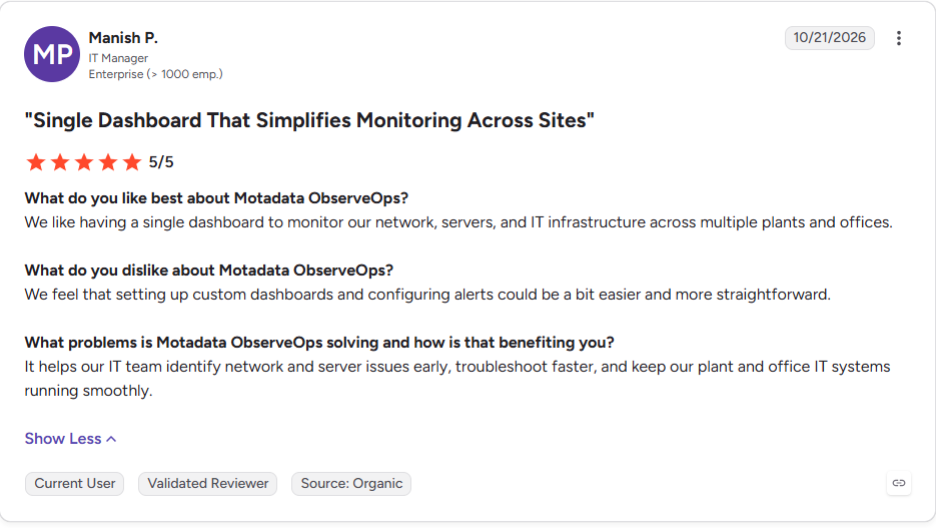
Read more of our ObserveOps reviews on G2.
Pros
- Rediscovery catches change inside known devices, not only new IP addresses
- Self-hosted, so your credentials and device inventory never leave your own servers
- One discovery screen for network, server, cloud and container estates
Cons
- You host and maintain the ObserveOps servers yourself
- Each protocol needs its own credential profile, which takes some setup on a mixed estate
- If all you want is a one-off list of IP addresses, a full platform is more than the job needs
2. SolarWinds Network Performance Monitor
Best for: Large estates built around SNMP that already run, or plan to run, other SolarWinds modules.
Rating: G2 4.3/5, Gartner Peer Insights 4.4/5
Pricing: Quote-based. SolarWinds now sells NPM as part of SolarWinds Observability Self-Hosted.
NPM has been the go-to SNMP monitor in a lot of big networks for years, and discovery is how devices get into it. You review what each scan found and choose what to import, so nothing gets monitored by accident. Buyers who put Motadata vs SolarWinds side by side usually spend the most time on licensing, since NPM sits inside a wider set of SolarWinds modules.
Pros
- Well documented, with a large community and plenty of third-party guides
- Scales to very large networks with additional polling engines
Cons
- Windows Server only for the main installation
- Discovery leans hard on SNMP, so devices without it need extra work
3. ManageEngine OpManager
Best for: On-prem teams who'd rather write a rule once than sort every new device by hand.
Rating: G2 4.5/5, Gartner Peer Insights 4.4/5
Pricing: Quote-based, depending on the edition (Standard, Professional or Enterprise) and how many devices you have. There's a free trial.
OpManager is ManageEngine's network and server monitor, and its strength in discovery is what happens after a scan. Rules sort each new device, so nobody has to do it by hand. Teams already on other ManageEngine tools get the most out of it, while teams starting fresh often weigh Motadata vs ManageEngine before they buy.
Pros
- Large built-in template library for device classification
- Runs fully on-premises
Cons
- IP and switch port management needs OpUtils as a separate product
- The interface feels dated next to newer tools
- Custom device types take time to template
4. Paessler PRTG
Best for: Small and mid-sized networks that want discovery and monitoring at a price they can see up front.
Rating: G2 4.7/5, Gartner Peer Insights 4.6/5
Pricing: PRTG 500 at $200 per month, billed annually, for about 50 devices. A freeware edition covers about 10 devices.
PRTG licenses by sensor, meaning each individual check it runs, and discovery is the step that creates those sensors. That makes the license math the first thing to work out, and it's usually the main topic when teams compare Motadata vs PRTG.
Pros
- Devices are monitored minutes after discovery
- Easy setup for small teams
Cons
- Sensor-based licensing makes broad discovery expensive
- Auto-discovery can create more sensors than you need
- The core server runs on Windows only
5. Auvik
Best for: Multi-site networks and MSPs that want discovery running without a server to maintain.
Rating: G2 4.5/5, Gartner Peer Insights 4.6/5
Pricing: Quote-based, priced per billable device.
Auvik runs from the cloud, with a small collector at each site doing the scanning. That model is why MSPs like it. It's also the main reason some teams look at Auvik alternatives, since air-gapped and strictly on-premises networks can't use it.
Pros
- Very little setup per site
- No discovery server to patch or back up
Cons
- Per-device pricing adds up on large estates
- Server and application discovery is thinner than its network coverage
6. Progress WhatsUp Gold
Best for: Teams that keep getting asked which switch port a device is plugged into.
Rating: G2 4.4/5, Gartner Peer Insights 4.4/5
Pricing: Quote-based. Licensing is by device, and it varies by edition.
WhatsUp Gold works out Layer 2 and Layer 3 relationships while it scans, so you learn both that a device exists and which switch port it hangs off. That port detail is the main reason teams pick it, and it's the first thing to test if you're weighing Motadata vs WhatsUp Gold.
Pros
- Licensing counts devices, not individual checks
- Port detail makes switch moves and cabling work easier to plan
Cons
- Configuration can get complex, according to G2 reviewers
- Reporting is limited next to newer platforms
- Windows-only installation
7. LogicMonitor
Best for: Hybrid estates that have already picked SaaS observability and need discovery to keep it fed.
Rating: G2 4.5/5, Gartner Peer Insights 4.5/5
Pricing: Essentials at $16, Advanced at $27 and Signature at $53, each per hybrid unit per month.
LogicMonitor calls its discovery NetScans, and they run on collectors that sit inside your network. One thing users raise in LogicMonitor's own community is that keeping devices it can't monitor out of the results isn't always simple, so scans can bring in clutter.
Pros
- Discovery feeds straight into a wide observability platform
- Collectors handle remote sites well
Cons
- SaaS only, with no self-hosted option
- Costs climb as hybrid units grow
8. Domotz
Best for: MSPs, or anyone with lots of small sites, who'd like one flat price per location.
Rating: G2 4.8/5, Gartner Peer Insights 4.6/5
Pricing: $35 a month for each collector, and you don't have to sign up for a year.
You run one Domotz collector at each location, and it doesn't need much, since a Raspberry Pi, a virtual machine or a NAS will do. It also names what it finds, so the list shows a firewall, a camera or a printer where you'd otherwise get a bare IP address.
Monitoring follows on the same device list, with no separate import step. It's built for spread across many small sites more than depth at one big one, which is why bigger estates often end up comparing Domotz alternatives.
Pros
- Quick setup at small sites
- Good device identification out of the box
Cons
- Server and application depth is limited
- Cloud-managed, so not a fit for air-gapped sites
9. ScienceLogic Skylar One
Best for: Big enterprises and service providers who want discovery itself to decide what gets monitored, and how.
Rating: G2 4.5/5, Gartner Peer Insights 4.3/5
Pricing: Quote-based.
Skylar One, formerly SL1, treats discovery as the step that decides everything else. Each device it finds gets a detailed record, and that record decides which Dynamic Applications, meaning the collection rules, apply to it from then on.
Pros
- Built for multi-tenant service providers
- Depth of data on each device is hard to match
Cons
- Setup and customization take real time
- Steep learning curve for new admins
10. Datadog
Best for: Teams already running the Datadog Agent that want network devices in the same place.
Rating: G2 4.4/5, Gartner Peer Insights 4.6/5
Pricing: Network Device Monitoring at $7 per network device per month, billed annually.
Datadog's Network Device Monitoring brings switches and routers into the same place as your servers, apps and logs. Billing is where it gets harder, since network devices are their own SKU on top of infrastructure hosts, and that cost is one of the main reasons teams compare Datadog alternatives.
Pros
- Strong dashboards and correlation across data types
- Nothing new to install if the Agent is already deployed
Cons
- SaaS only
- SNMP-only discovery for network gear
What Should You Look for in Network Discovery Software?
Look for network discovery software that covers every device type you own, keeps finding change after the first scan, and puts what it finds somewhere useful. Here's what we'd check before signing anything.
Credential coverage: SNMPv3, SSH, PowerShell or WMI, and cloud APIs. Point an SNMP-only tool at your Linux servers and they'll all come back as unknown.
Flexible scope input: Ranges and CIDR blocks cover subnets. CSV import matters more than people expect, since somebody on your team already keeps a device list in a spreadsheet.
A way around blocked ping: Lots of firewalls and printers ignore ICMP. If the tool can't skip ping or fall back to another method, those devices never appear.
Remote collectors: A branch office behind NAT or a firewall won't get scanned from head office, so you'll want a small collector sitting at that site.
Rediscovery inside known devices: Ask the vendor what happens when a switch you already monitor gets a new interface, or a host picks up new VMs. Only some tools go back and look.
A clear next step: Auto-provisioning into monitoring, an asset record, or at least an export. A list nobody acts on doesn't close the gap.
If the goal is an asset register more than a monitored network, the checklist shifts toward IT asset discovery and tracking, where owners, warranties and licenses matter as much as uptime.
Which Network Discovery Tool Is Right for Your Team?
The right network discovery tool depends on three things: how many sites you run, whether your data is allowed to leave the building, and what you want to happen to a device once it's found. Find your situation in the table below.
Situation | Start With | Why |
You want discovered devices monitored with no manual step | Motadata ObserveOps | Scheduled discovery can auto-provision every device it finds |
Data has to stay on your own servers | Motadata ObserveOps | Self-hosted, with credentials and inventory kept in-house |
You run a large SolarWinds estate already | SolarWinds NPM | Discovery feeds the modules you already license |
You want rules to sort devices after each scan | ManageEngine OpManager | Templates and a rule engine classify what gets found |
You need a published price for a small network | Paessler PRTG | License sizes and prices are on its pricing page |
You manage dozens of small client sites | Domotz or Auvik | One collector per site and a cloud console |
You need switch port detail from discovery | Progress WhatsUp Gold | Layer 2 and Layer 3 discovery down to the port |
Your servers and apps already live in Datadog | Datadog | Network devices join the same console |
Pick the Right Network Discovery Tool for Your Business
Every tool on this list can find devices on day one. The difference shows up a month later, when someone adds a VLAN, opens a new cloud account or racks a switch at a branch, and nobody thinks to rescan.
If you just need to know what's on a subnet today, a free scanner is fine. Keeping that answer true is harder, and for that you want scheduled discovery, rediscovery inside devices you already know, and a short path from found to monitored.
That last part is what we built ObserveOps around. A device sitting on a list with nothing watching it is still a blind spot. Whichever tool you go with, back it with an IP address management process so the ranges you're scanning stay accurate too.
FAQs
What is the difference between network discovery and network mapping?
Discovery tells you what's on the network and what each device is. Mapping goes one step further and works out how those devices connect, usually from CDP, LLDP and routing tables. Mapping tools almost always run discovery first, but lots of discovery tools never draw a map.
Are free network discovery tools good enough?
For a one-off check, often yes. Nmap, Advanced IP Scanner and Angry IP Scanner will tell you what answers on a subnet in a few minutes. But they don't store credentials, rescan on their own or monitor anything, so teams outgrow them fast.
What is the difference between agent-based and agentless network discovery?
Agentless discovery talks to devices over SNMP, SSH or WMI, so nothing gets installed on them. Agent-based discovery needs software on every host. Switches and routers can't take an agent, so network gear is nearly always found agentlessly. The same tradeoff shows up in agent vs agentless monitoring.
How often should you run network discovery?
For most stable networks, once a week is enough. Campuses, labs and cloud accounts change faster, so daily makes more sense there. Schedule it for quieter hours, and turn on rediscovery for devices you already monitor so new interfaces and VMs don't slip past.
Is ObserveOps better than SolarWinds NPM for network discovery?
It depends on what you want after the scan. ObserveOps finds network gear, servers and cloud resources from one screen, can auto-provision them as monitors, and keeps checking inside known devices for change. NPM makes more sense if you're already paying for other SolarWinds modules.