TCP RST Packets: What Causes Resets and How to Troubleshoot Them
When one end of a connection hangs up without saying goodbye, what it sends is a TCP RST packet, and whatever was still queued never gets delivered. Reset is one of the TCP flags, and most resets crossing your network are harmless.
The ones that aren't tend to surface as dropped sessions, failed API calls or a log full of connection reset by peer. In our experience, the cause falls out of two questions. Who sent the reset? And when did it show up in the conversation?
In this blog, you will:
See where a reset and a normal FIN close part ways. Most resets, it turns out, aren't worth a ticket.
Get a decoder for firewall labels like tcp-rst-from-client and for the many ways Linux, Windows, curl, Java and nginx phrase the same error.
Track a reset to its sender (captures, kernel counters, flow records, TTL math).
What Is a TCP RST Packet?
It's an ordinary TCP segment, except the reset bit is set, and that one bit makes the receiver drop the connection right there. Nothing queued gets sent.
Nobody waits for an ACK, either. The receiving kernel just throws the connection state away, so the application finds out the next time it tries to read or write (usually as an error it wasn't expecting).
RFC 9293, the current TCP spec, keeps resets for segments that plainly don't belong to any live connection. A SYN to a port with no listener counts. So does data for a connection the far end lost track of when it rebooted.
Resets get sent deliberately as well. Apps use them to get rid of a connection fast, and some firewalls send one to refuse you out loud where others would just drop the packet.
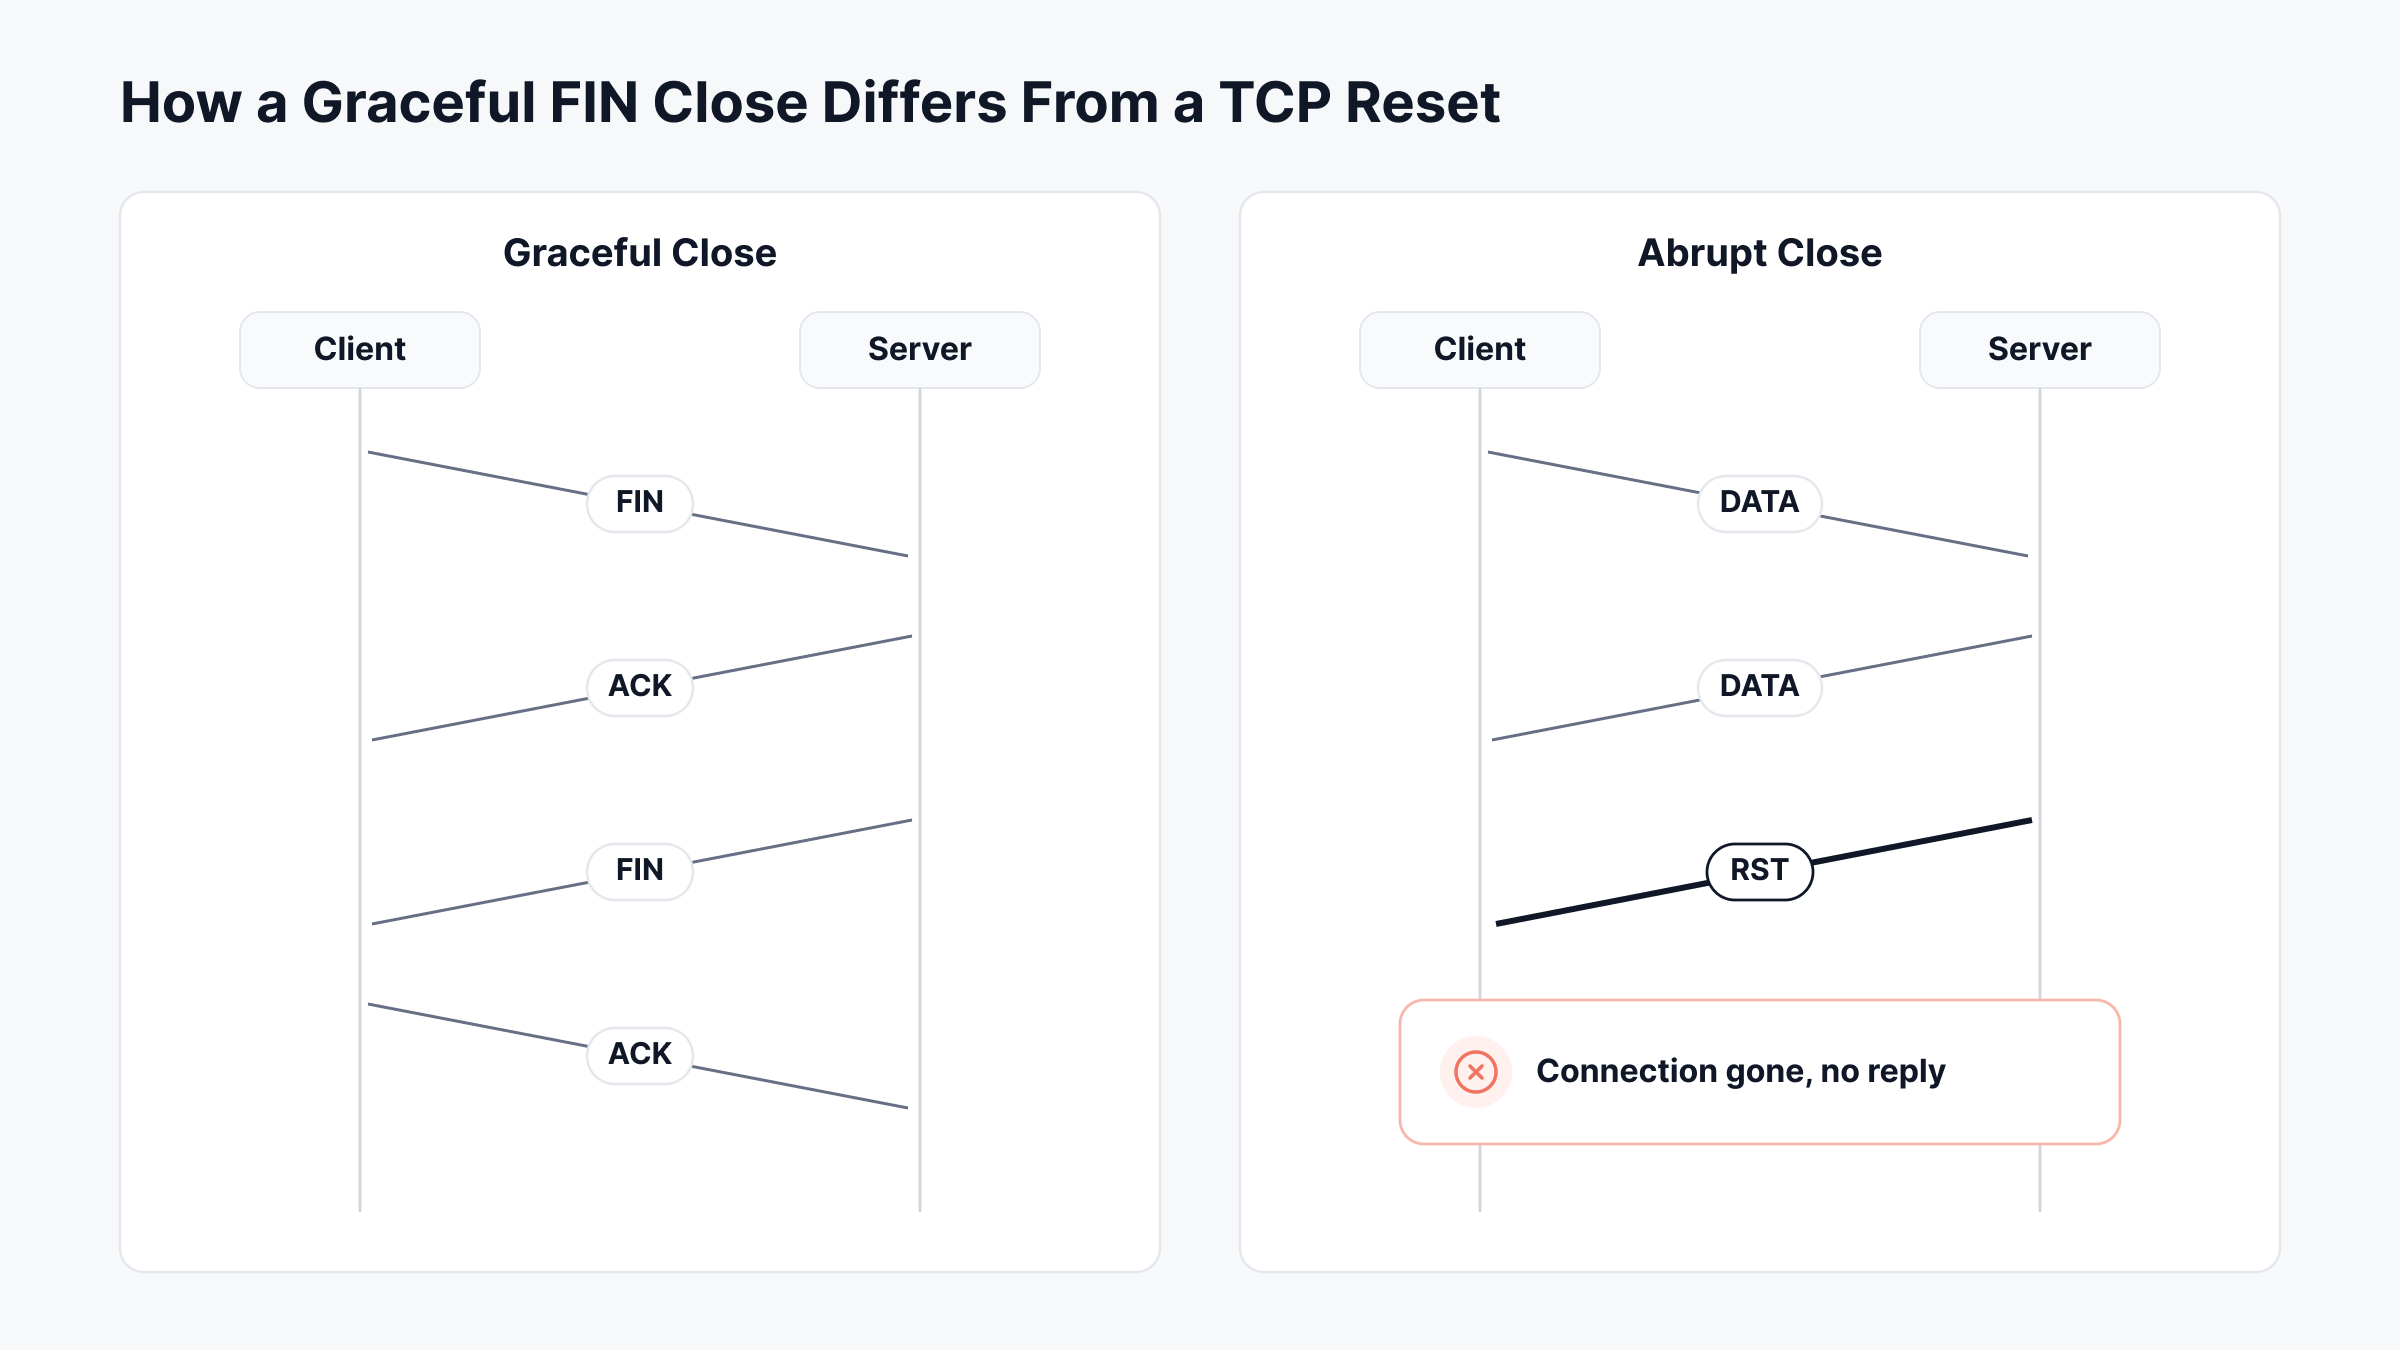
How Is a TCP Reset Different From FIN?
A reset ends things at once and from one side only. FIN is the polite version, where both ends agree to close and every byte gets acknowledged first. Connections can also die a third way, which is that nothing arrives at all until a timer gives up.
Ending | How It Works | Unsent Data | What the Application Sees |
FIN | Each side sends FIN and the other ACKs it (four segments, all told) | Delivered and acknowledged before the close | A clean end of stream |
RST | One side sends a single RST and doesn't wait for a reply | Thrown away on both ends | Connection reset, or connection refused if it answered the SYN |
Timeout | One side goes quiet until retransmissions or keepalives run out | Lost | A timeout error, often after a painfully long wait |
Your code cares about that last column more than anything else on the wire. A FIN reads like a finished conversation. A reset reads like a failure (even when the reset was the right call), and that's why so many harmless ones end up in incident tickets.
Is a TCP Reset Normal?
Mostly, yes. Any busy server sends and receives resets all day long, and we'd only start looking when the count jumps or the resets line up with something users actually notice.
Here's what we'd happily ignore:
Port scans and health checks hitting closed ports (the host answers RST, ACK and moves on).
Someone closing a browser tab halfway through a download, so the client resets its end.
A load balancer or firewall clearing out a session that sat idle past its timeout.
HTTP clients aborting slow requests on purpose to get a pooled connection back.
And here's what we'd chase:
A reset halfway through something that should have finished (a file upload, say, or a long database query).
Resets that began the same week someone touched a firewall, load balancer or certificate.
Resets that only hit one route, one site or one backend (that pattern almost never turns out to be random).
A slow climb in resets alongside retransmissions or latency on the same path.
What Causes TCP Resets?
Resets come from the server, from the client, or from some device in the middle that's speaking for one of them. Which one sent it decides the fix, so we've grouped the causes by sender.
1. Resets Sent by the Server
Most of the time it's a refused connection. A SYN lands on a port nobody's listening on, and the kernel fires back RST, ACK before any application code gets a say.
A service that's crashed or halfway through a restart does exactly the same thing, which is why a botched deploy can look like a network outage from the client's chair.
The sneakier server resets come down to how the app closes its sockets:
Unread data on close: This one surprises people. If the app closes a socket while there's still received data it never read, the kernel answers with RST and not FIN (RFC 1122 and RFC 2525 both cover it). We see it most from servers that reject a request early, before reading the whole body.
Abortive close with SO_LINGER: SO_LINGER on, timeout zero, and close() becomes a reset. Some connection pools and proxies set this on purpose, because they'd sooner reset than collect thousands of TIME_WAIT sockets.
Full accept queue: When the listen backlog fills up, the Linux default is silence, and the new SYN just gets dropped. Turn on tcp_abort_on_overflow and the kernel resets instead, which at least lets clients fail fast in a spike.
Lost connection state: A server that rebooted or failed over has no record of the old connection. The client's next segment gets a reset, and that's how the client finally finds out its half-open connection died a while ago.
2. Resets Sent by the Client
Usually a person or a timer gave up. Someone closes the tab, cancels the download or kills the app, and the OS tidies up with a reset. HTTP libraries do it when a request runs past its timeout (connection pools too, whenever they bin a socket they've decided is stale).
Client resets only really matter when they're systematic. Put a 30-second client timeout in front of a backend that needs 35 and you'll get a reset on every slow request, while the server logs show nothing worse than a request that got cut off.
3. Resets Sent by Something in the Middle
Firewalls, proxies and IPS boxes can all send resets on behalf of either endpoint, and they'll usually forge that endpoint's address while they're at it. The classic case is a firewall rule set to reset instead of silently drop.
An intrusion prevention system killing a session after it spots a threat is the other one we see constantly.
Idle timeouts cause even more of them. Some box in the path forgets a session after a quiet stretch, then answers the next packet with a reset. We've seen this one a lot on AWS.
A Network Load Balancer forgets an idle TCP flow after 350 seconds by default, and any data that turns up later gets a reset.
Linux won't send its first keepalive probe until 7,200 seconds have passed, so on a quiet connection the NLB gives up roughly 6,850 seconds before keepalives could have saved it.
NAT adds its own twist. Once a NAT device ages out a mapping, return traffic doesn't match anything any more, and one side or the other ends up sending a reset.
TLS doesn't hide everything. The server name usually travels in the clear inside the ClientHello, filters read it there, and a reset right after that packet makes the failure show up during the SSL handshake. Most people's first guess is a bad certificate.
TCP-RST-From-Client vs TCP-RST-From-Server
They name the side that sent the reset, as the firewall saw it. Client is whoever opened the connection and server is whoever answered. The labels themselves are Palo Alto Networks session end reasons (on a FortiGate you'll find client-rst and server-rst doing the same job).
Neither label says who's at fault, though. A client reset might just be someone closing a browser. A server reset might be a server doing its job and refusing a port nobody should be touching. Here's how we'd read the end reasons you'll see most:
Firewall Log Value | What Happened | Look Next At |
tcp-rst-from-client (Palo Alto), client-rst (FortiGate) | The side that opened the session reset it | Client timeouts, users giving up, app pool settings |
tcp-rst-from-server (Palo Alto), server-rst (FortiGate) | The answering side reset it | Is the service even listening? After that, server app logs and upstream load balancer timeouts |
tcp-fin | A normal close from both ends | Nothing, unless users are still complaining |
aged-out | The session went idle past the firewall timeout and got removed | Idle timeout versus the app's keepalive settings |
policy-deny or threat | The firewall ended it itself (and may have sent the reset too) | The rule or threat signature that matched |
One trap catches a lot of people. A Palo Alto rule set to reset-server, reset-client or reset-both makes the firewall send resets carrying the endpoints' own addresses.
So a capture taken on the far side of the firewall shows a reset with the server's IP on it, while the server's own logs swear it sent nothing. Both are telling the truth.
What Connection Reset by Peer Means in Your Error Logs
Your read or write failed because the far end (or something pretending to be it) sent a TCP RST on a connection that was already open. Refused is what you get when that reset comes back to your very first SYN. Each runtime phrases the pair differently, which is how a single network problem turns into five bug tickets with five different titles.
Where You See It | Reset on a Live Connection | Reset in Reply to SYN |
Linux system calls | ECONNRESET (errno 104), connection reset by peer | ECONNREFUSED (errno 111), connection refused |
Windows sockets | WSAECONNRESET (10054), an existing connection was forcibly closed by the remote host | WSAECONNREFUSED (10061), the target machine actively refused it |
curl | Error 56, recv failure: connection reset by peer | Error 7, failed to connect: connection refused |
Java | java.net.SocketException: Connection reset | java.net.ConnectException: Connection refused |
Python | ConnectionResetError: [Errno 104] | ConnectionRefusedError: [Errno 111] |
Node.js | Error: read ECONNRESET, or socket hang up | Error: connect ECONNREFUSED |
nginx error log | recv() failed (104: Connection reset by peer) while reading response header from upstream | connect() failed (111: Connection refused) while connecting to upstream |
Refused errors are the easy ones, since there's almost always a listener down or a firewall rule saying no. A reset on a live connection points somewhere messier (timeouts, crashes, or a box in the middle).
How to Troubleshoot TCP Resets, Step by Step
Start with captures at both ends, then prove who sent the reset, then check its timing against the app, the kernel and every box on the path. We rarely need all five steps.
Step 1: Capture the Reset at Both Ends
A capture from one side only proves a reset arrived. Run captures on the client and the server at the same time, plus the interfaces of any firewall or load balancer in between, and filter hard so the files stay small:
Tool | Filter | What It Shows |
Wireshark display filter | tcp.flags.reset == 1 | Every segment with RST set |
Wireshark display filter | tcp.flags.syn 1 || tcp.flags.reset 1 | Connection attempts and resets side by side, so refused SYNs jump out |
tcpdump | tcp[tcpflags] & tcp-rst != 0 | Every RST, caught at the source (wrap the expression in single quotes in your shell) |
tcpdump | tcp[tcpflags] & tcp-rst != 0 and port 443 | Resets for one service only |
Before going any further, add IP TTL as a Wireshark column. It's the field that proves who really sent the reset.
Step 2: Note When the Reset Arrived
Where the reset lands in the conversation cuts the list of causes down fast:
When the RST Arrives | Usually Means | Check First |
In reply to the SYN | No listener, or a firewall rule set to reject | Is the service up? Then the firewall rule |
Right after the TLS ClientHello | A filter or proxy that didn't like the server name | Web filtering, IPS and proxy policies |
Partway through a request or response | App crash, an oversized request, or a client giving up | Application logs, then client timeout settings |
On the first packet after a long quiet spell | An idle timeout on a firewall, NAT or load balancer | Idle timeouts against keepalive intervals |
After a burst of retransmissions | The path got bad enough that one side quit | Loss and latency on that route |
That last row overlaps heavily with plain packet loss, and our guide on how to fix packet loss covers the path side of it.
Don't confuse any of this with a zero window, a common mix-up. A receiver advertising a TCP window size of zero wants the sender to pause, and the connection stays up the whole time.
Step 3: Prove Who Sent It
Line up the TTL on the reset against the TTL on normal packets from the same host. Packets from one real host keep a steady TTL, because they take the same route each time.
A reset that arrives 9 hops closer than everything else from that address didn't come from that address (it's usually a firewall or proxy). The TTL difference is your hop count, and a traceroute shows who lives at that hop.
Step 4: Read the Kernel's Own Counters
Intermittent resets are miserable to catch in a capture, and the Linux kernel counts them by reason anyway. Take two snapshots with nstat -az or netstat -s about a minute apart and diff these:
Counter | What Increments It | A Rising Number Usually Means |
TcpOutRsts | Every segment this host sends with RST set | The host is refusing or aborting connections |
TcpEstabResets | Established connections closed by a reset in either direction | Live sessions are getting cut, not just refused |
TcpExtTCPAbortOnData | Data arrived after the app closed the socket | Peers keep sending after your side is done |
TcpExtTCPAbortOnClose | The app closed with unread data in the receive buffer | Your app closes before reading the full request |
TcpExtTCPAbortOnTimeout | Retransmission or keepalive timers gave up | A path or peer stopped answering |
TcpExtTCPAbortOnLinger | SO_LINGER with a timeout forced the abort | Somebody wrote deliberate abortive closes into your code |
Windows is less generous. netstat -s -p tcp gives one Reset Connections total, though that's still enough to spot a trend.
Step 5: Match Timeouts Across the Path
If the same long-lived connections keep getting reset, we'd bet on mismatched timers first. Pull the idle timeout off every firewall, NAT and load balancer between the two ends, find the shortest, and set app or OS keepalives to fire before it. Can't touch the keepalives? Raise the device timeout for that one service instead.
When TCP Resets Are an Attack
Resets turn into an attack when someone forges them to tear down connections that aren't theirs. Two patterns cover nearly all of it.
Reset injection is the targeted one, a single forged RST dropped into one specific connection. Censorship systems do it, and so do some security appliances, usually right after the first data packet.
The giveaway is a TTL that doesn't match the real sender's packets. Reset floods are blunter, with huge volumes of spoofed resets sprayed at random ports and addresses in the hope of burning CPU and knocking over whatever connection they happen to hit.
Blind injection is a lot harder on a modern stack. RFC 9293 only accepts a reset whose sequence number falls inside the receive window, and RFC 5961 tightens that again.
A reset that's in the window but isn't an exact match for the next expected sequence number just gets a challenge ACK back, so an attacker has to guess the exact number instead of landing anywhere in a window that can span megabytes.
What's left for defenders is stateful filtering on firewalls, RST rate limits at the edge, and the session inspection that deep packet inspection tools add.
How to Catch TCP Resets Without a Packet Capture
Packet captures are great at one connection and hopeless at a thousand. In production the questions that come first are where, how often and since when, and those need signals collected all day across the whole estate.
In ObserveOps (the network side of our unified observability and ITSM platform), we lean on five of them.
1. Refused vs Timed Out: Read the Answer to the SYN
Open Settings, then Utility, then Telnet (Admin and NOC roles only), pick a Collector, and point it at an IPv4 address, IPv6 address or hostname on whatever port you're chasing.
It's a pure TCP connect from that Collector, and no application data goes out. Pay attention to which failure you get, because each maps to something specific on the wire:
Closed: The SYN was answered with RST, ACK. So the host is up, and either nothing listens on that port or something in front of it is rejecting for it.
Timeout: Silence. Either the host can't be reached or a device configured to drop is eating the packets.
The trouble with Closed is that a firewall rule set to reject or reset produces it too. We get around that by running the test twice, once from a Collector on each side of the firewall.
Closed from both means the service really isn't listening. Closed from outside and Open from inside, and you've found your firewall.
2. Port Checks That Survive the Handshake
Telnet gives you one answer, at one moment. A Port service check repeats that TCP connect on a schedule, aimed at a monitor, one IP, an IP range, a CIDR block or a CSV of targets.
It can run through a Collector or through a MotaAgent installed near the clients, and that second option is the one that catches middle-device resets, since the check then crosses the same firewalls and proxies your users do.
For TCP ports, switch on Send Command. Now the check writes a command into the open socket and reads what comes back, with Search Keyword and Max Command Output Lines deciding what healthy looks like.
A service that accepts the handshake and then resets passes a bare port check but fails this one. That's the after-the-handshake reset, and it's the hardest kind to catch otherwise.
3. Flow Records That Carry the RST Flag
You won't see individual packets in flow data. You will see which conversations ended in resets, at a scale no capture gets near.
Our flow analytics configuration guides for Cisco Catalyst 2960-X, 2900 and 4900 switches build NetFlow-Lite records that collect the ack, fin and rst TCP flags (the Catalyst 9300 and 6500 records collect the TCP flags field as well).
A flow record's flags field is a cumulative OR of every flag seen in that flow, so any flow that contained a reset will say so.
Two details decide how far to trust it:
Sampling: NetFlow-Lite always samples, somewhere between 1 in 32 and 1 in 1022 packets in our configurations, so a lone reset can easily go unsampled. Read sampled flow for patterns (one backend producing most of the reset-flagged flows, say) and leave individual connections to captures.
Expiry timers: Exporters close flow records at different times depending on how the flow ended. Our Vyatta configuration expires a flow 120 seconds after a reset, 300 after FIN and 3,600 for every other TCP flow, which means reset flows reach your reports well ahead of long-running healthy ones.
Then in Flow Explorer, set Result By to group any counter by up to four fields (source.ip, source.port, destination.ip and destination.port work well here). A vague reset problem turns into one client, one server and one service in a few clicks.
4. TTL and Hop Count: Find the Device That Forged the Reset
Every router on the path knocks one off a packet's TTL, and the starting point depends on who built the packet (64 for Linux, 128 for Windows, 255 for a lot of network gear). Subtract what arrived from the closest of those and you get the hops it traveled.
Say the server's normal segments arrive with TTL 52, which puts them 12 hops from a Linux box that started at 64. The reset arrives with TTL 61, only 3 hops away.
Now run the Traceroute utility from the client-side Collector (it sends probes with increasing TTL and lists each hop with its IP and response time), and whatever answers at hop 3 sent the reset.
In our experience it's nearly always a firewall or a proxy. One caution from our docs applies here. A * * * at a hop doesn't automatically mean trouble, because plenty of routers silently drop probes, so check that the later hops still answer.
For paths you care about every day, a NetRoute keeps doing this. Give it a destination host, IP or URL, a destination port, a source monitor and a polling interval, and it records hop-by-hop latency and packet loss, route changes and multipath. Its policies come in two shapes:
Source to Destination: Threshold, Baseline, Anomaly or Forecast alerts on the route as a whole. Baseline learns from the last 15 days and takes absolute or percentage deviations.
Hop-to-Hop: A threshold on individual hops, one severity per policy. Watch for a new hop appearing in front of a service, because it usually means a new firewall or proxy is now in a position to send resets.
5. Counters That Move With Resets
SNMP won't count resets by reason, but it shows the damage around them clearly. On routers, firewalls and load balancers, ObserveOps collects network.connection.tcp.connections, network.connection.tcp.error.segments and network.connection.tcp.retransmitted.segments, and Palo Alto firewalls add paloalto.tcp.active.sessions. Windows and Linux servers report system.network.tcp.connections and system.network.tcp.retransmissions.
The pattern we watch for is a firewall's active sessions dropping at the same moment its error segments jump. It usually means the device is clearing sessions (an idle timeout, a policy push, a failover), and the clients behind it are about to start logging connection reset by peer.
Side by side, the five signals look like this:
Signal | What It Tells You About the Reset | Where It Comes From |
Telnet result: Closed or Timeout | Whether the SYN got a reset or nothing at all | Telnet utility, run from a chosen Collector |
Port check with Send Command | Whether the service resets after the handshake | Port service check through a Collector or MotaAgent |
RST flag in flow records | Which client, server and port pairs keep ending in resets | NetFlow or IPFIX with TCP flags, grouped in Flow Explorer |
Hop count from TTL | Which device on the path sent the reset | Traceroute utility and NetRoute |
TCP error, retransmission and session counters | When resets started, and which device moved first | SNMP metrics on network devices and servers |
Trace Every TCP Reset to Its Source With Motadata ObserveOps
A TCP RST is rarely the actual problem. Usually it's the messenger, sent after something else broke, like a listener that wasn't there, an idle timer that fired early or a filter that didn't like what it saw.
That's why every reset hunt starts with who sent it, and then when. A firewall end reason, an error string or a TTL that doesn't fit will normally answer the first. When it arrived (on the SYN, after the ClientHello, after an idle spell) answers the second, and between the two you're mostly done.
Then move from captures to always-on signals, so the next reset turns up on a dashboard before it turns up in a ticket. Our network troubleshooting guide applies the same method to the problems that cluster around resets, from loss and latency to routing.
FAQs
What does RST, ACK mean?
Both flags are set on the same segment. A closed port answers a SYN this way, because a reset has to acknowledge that SYN before the client will accept it. So RST, ACK straight after your SYN means refused.
Does a TCP reset mean data was lost?
Sometimes. Anything still sitting in a buffer when the reset lands is discarded on both ends, so bytes that were sent but not yet read vanish. Apps that can't lose a byte need their own retries, which is the case for idempotent requests and resumable transfers.
Can TCP keepalive prevent resets?
For idle timeouts, yes, as long as the probes go out more often than the shortest idle timer on the path, since that keeps firewall, NAT and load balancer sessions warm. Crashes, refused ports and security policies will still reset you.
What is a half-open TCP connection?
One side still believes the connection is up, and the other has forgotten it (a reboot or failover usually does this). Nothing happens until the side that remembers sends something, gets a reset back, and the connection is gone.
Can ObserveOps capture TCP RST packets?
No. For a single connection you'll still want Wireshark or tcpdump. Where ObserveOps earns its place is everything around the resets, from refused versus timed-out ports and reset-flagged flows to hop-by-hop paths and TCP error counters on every device.