Best Coralogix Alternatives: 10 Observability Platforms Compared
Most teams shopping for Coralogix alternatives have no complaints about the platform itself. What sends them looking is the model around it.
Coralogix pricing depends on routing policies you must get right. Its DataPrime query language sits under the cost controls. And a $200 million funding round in June 2026 points the roadmap at AI agents.
In this blog, you will see:
Ten alternatives compared: On bill, query portability, and signal coverage.
Full reviews: Pricing, key features, and the cons worth knowing.
The four types of Coralogix alternative: Replace only the part you need.
By the end, you will know which two or three deserve a trial.
Why Do Teams Look for a Coralogix Alternative?
Teams leave Coralogix for three main reasons. The bill depends on routing policies you can get wrong, the DataPrime query language sits under both queries and cost controls, and the company's 2026 funding round points its roadmap at AI agents. Each one lands on a different kind of team.
1. The Bill Depends on Routing Policies You Have to Get Right
Coralogix charges for data, never for hosts or users, and every data type converts into units worth $1.50 each. The published rate takes a minute to learn. The TCO Optimizer takes longer.
Every log lands in one of three priorities, each with its own rate. Frequent Search pays for hot storage and full log indexing at about $1.15 per GB, Monitoring costs about $0.50, and Compliance about $0.17.
Data that matches no policy falls through to Frequent Search, the most expensive tier, and the docs describe that fall-through as silent. We have watched teams discover it on their second invoice.
Three more details catch teams. Blocked data still bills at 0.08 units per GB. Policies never apply retroactively. Unused units expire at the end of the term, and past your daily quota, ingestion stops until 00:00 UTC unless you switch on pay-as-you-go.
2. DataPrime Sits Under the Queries and the Cost Controls
Coralogix queries, dashboards, and alerts run in DataPrime. The TCO policies that set your bill use DPXL, its expression language. So cost control needs the skill reviewers call the hardest part of getting started.
That skill does not travel. Two years of DataPrime queries adds up to work no other platform can read. Teams want PromQL, LogQL, or SQL so the next move costs less than this one, and instrumentation on OpenTelemetry so the agents move too.
3. The Roadmap Now Points at AI Agents
In June 2026, Coralogix raised $200 million at a $1.6 billion valuation. According to TechCrunch, the money goes to AI-focused products, security offerings, and global expansion.
That suits an estate built on Kubernetes and LLM applications. An estate of 400 switches, a VMware cluster, and a payroll server reads it differently.
Cloud and Kubernetes events feed Coralogix's Infrastructure Explorer. Polling network gear over SNMP, collecting NetFlow, and backing up device configurations all sit outside the platform's design, and the new money heads elsewhere. Olly, the AI agent, also bills per user on an account that otherwise includes unlimited users.
None of this makes Coralogix a weak platform. According to AiThority, Gartner named it a Leader in the 2026 Magic Quadrant for Observability Platforms, up from Visionary in 2025.
If this line item was due a review anyway, that review pays off more now than after the next renewal lands.
What Are the Four Types of Coralogix Alternative?
Coralogix alternatives fall into four groups, and picking your group first shortens the list fastest.
Here is how the ten tools sort:
Type | What you are replacing | Tools |
Full-stack SaaS suites | Logs, metrics, traces, RUM, and security from one vendor, at a higher price | Datadog, Dynatrace, New Relic, Splunk Observability Cloud |
Open-standards platforms | A proprietary query language, swapped for PromQL, LogQL, or SQL over OpenTelemetry data | Grafana Cloud, SigNoz, Dash0 |
Log-first platforms | Search-heavy logging, with a SIEM on the same data | Elastic Observability, Sumo Logic |
Unified IT operations platforms | Application telemetry plus the network and on-premises infrastructure under it | Motadata ObserveOps |
The first group costs more than Coralogix and does more. The second usually costs less and asks your engineers to own more, which we find works until the engineer who built it leaves.
The third gives a log-heavy team the shortest move. The fourth pays off only when you are cutting tools, which is the trade a unified observability platform asks you to make.
How Did We Evaluate These 10 Tools?
We scored every tool below on the same five factors.
How the bill scales: Whether cost tracks hosts, gigabytes, events, users, or sources, and what you pay for data you drop.
Query portability: Whether the queries and dashboards you write today would run anywhere else.
Signal coverage: The three core signals, then RUM, network flows, SNMP, and configuration.
Deployment options: SaaS only, self-hosted, or both, since Coralogix offers only the first.
Correlation depth: Whether the platform points at a cause or only stores the evidence.
Two honesty notes. We ran no lab benchmark, so nothing here reports a measured query time. All pricing comes from public vendor pages checked in September 2026. Vendors change it without notice.
The 10 Best Coralogix Alternatives Compared
The table below puts all ten best Coralogix alternatives side by side.
Tool | Best For | Deployment | Pricing Model | Free Option |
Motadata ObserveOps | Apps, infrastructure, and network on one license | SaaS, on-premises, private or public cloud | Per monitored device and per source, quoted | Free trial |
Datadog | Widest integration catalog | SaaS only | Per host, plus per GB and per event for logs | 14-day trial |
Dynatrace | Automated discovery and AI root cause | SaaS only | Annual platform commit, rate card | 15-day trial |
New Relic | Large free tier, one ingest rate | SaaS only | Per GB plus per full platform user | Free, 100 GB a month |
Grafana Cloud | Open query standards and dashboards | SaaS, or self-host the open-source stack | Per series, per GB, per user | Free, 50 GB logs |
Elastic Observability | Full-text log search plus SIEM | Self-managed, hosted, or serverless | Per node, per resource, or per GB | Free, self-managed |
SigNoz | One open-source app for three signals | Self-host, SaaS, or BYOC | Per GB and per million samples | Free, self-hosted |
Sumo Logic | Managed logs with a SIEM, billed on search | SaaS only | Credits on data scanned and retained | Free trial |
Splunk Observability Cloud | Metrics and traces beside Splunk logs | SaaS, with Splunk Enterprise for logs | Per host, logs metered separately | Free trial |
Dash0 | PromQL across every OpenTelemetry signal | SaaS only | Per million data points and records | 14-day trial |
The reviews below cover each one in roster order.
Detailed Overview of the 10 Best Coralogix Alternatives
Here is a closer look at each one, Motadata ObserveOps first.
1. Motadata ObserveOps
Best for: IT teams that want application telemetry and the infrastructure and network beneath it on one license, with an on-premises option.
Type: Commercial, unified observability platform.
Rating: G2 4.7/5, Gartner Peer Insights 4.6/5
ObserveOps keeps metrics, logs, flows, traces, and topology in one backend. Instrumentation you wrote for Coralogix's OTel path comes across unchanged.
The Log Explorer covers the jobs Coralogix users lean on daily, and the same backend holds the topology that connects a log line to the host and the switch behind it.
Licensing marks the sharpest difference. ObserveOps Infinity licenses per source instead of per gigabyte, so a chatty application raises your storage and leaves the license alone. Nothing routes, so no policy can misfire and no expensive tier catches unmatched data.
The observability pipeline ships in the base edition. It parses, enriches, and applies retention policy at ingest. The platform also reaches the parts of an estate Coralogix does not: network devices, traffic flows, and device configurations.
Pros
- A noisy deployment week changes your storage bill, not your license.
- Data can stay inside a regulated network, which a SaaS-only platform cannot offer.
- Server, network, application, and log data correlate on one topology, not across two tools.
- An alert can raise and route a ServiceOps ticket on its own.
- Motadata reports 30 to 40 percent less hardware than earlier editions on an equivalent deployment, though the figure moves with workload.
Cons
- The licensing model is published, but the prices are not, so you cannot size it from the website in five minutes.
- ObserveOps Infinity only reached general availability in August 2026. The edition has a short field record.
- You run collectors and agents yourself. That takes more setup than pointing an OTel exporter at a SaaS endpoint.
- APM instrumentation covers six languages plus Kubernetes, and RUM covers four JavaScript frameworks. Anything else needs custom OpenTelemetry work.
- Coralogix sells LLM output scoring as AI Center. ObserveOps does not cover that job.
Pricing: Subscription quoted to your environment.
A feature list only tells you what a platform can do. Here’s what Jitesh has to say in his ObserveOps review.
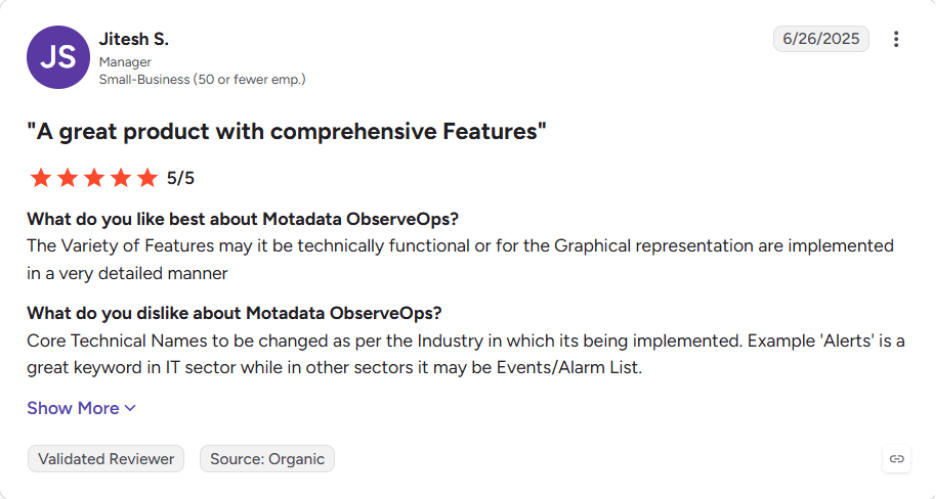
You can read the rest of the ObserveOps reviews on G2.
2. Datadog
Best for: Cloud-native teams that want the widest integration catalog and can pay per host.
Type: Commercial SaaS.
Rating: G2 4.4/5, Gartner Peer Insights 4.6/5
Most Coralogix shortlists start with Datadog. It covers everything Coralogix covers, plus a long tail beyond it.
Infrastructure, APM, logs, RUM, synthetics, security, and cloud cost all sit in one account, with more than 1,000 integrations behind them. An estate on AWS, Azure, or GCP shows up on a dashboard within the hour.
The bill runs on a different axis. Infrastructure and APM each charge per host, and logs carry two meters, one for ingest and one for indexing.
Teams that left Coralogix to escape routing policies find the same exercise waiting under Datadog pricing, now called exclusion filters and Flex Logs. We have seen the logs line overtake the host line within a year of moving.
Pros
- The broadest coverage on this list, so a second tool rarely follows.
- Traces, logs, and host metrics correlate on one timeline with almost no setup.
- Dashboards and alerting lead the category on polish.
Cons
- The bill grows on several axes at once. Hosts, APM, logs, and each add-on carry their own meter.
- On-demand pricing runs about 20 percent above the annual rate, so flexibility costs extra.
- SaaS only, with no on-premises option for data that cannot leave the building.
Pricing: Infrastructure from $15 per host per month billed annually, APM from $31 per host, and logs from $0.10 per GB ingested plus $1.70 per million indexed events. Datadog offers a 14-day free trial.
3. Dynatrace
Best for: Large enterprises that want automated discovery and AI root cause on an annual commit.
Type: Commercial SaaS.
Rating: G2 4.5/5, Gartner Peer Insights 4.6/5
Dynatrace sells automation. OneAgent discovers hosts, processes, and services on its own. It then draws the Smartscape topology between them. Davis AI runs causal root-cause analysis across that map.
In an estate too large to hand-wire, that automation justifies the purchase.
Pricing runs through the Dynatrace Platform Subscription. You commit annually and draw down against a rate card, with hosts metered by memory and hours and logs metered separately on ingest, retention, and query.
One thing to know before you swap DataPrime for it. Dynatrace's Grail data lake has its own language, DQL. You leave one proprietary query language for another.
Pros
- Discovery and dependency mapping need almost no manual configuration.
- Unlimited seats, with no per-user fees at any tier.
- Usage above the commit bills at the same rate, with no penalty overage.
Cons
- Premium pricing built for the enterprise end. The minimum commit rules out small teams.
- DQL adds another proprietary language to learn, and you cannot take it with you.
- Someone has to watch the drawdown, or a quiet month becomes a loud one.
Pricing: Annual platform commitment against a rate card. Full-Stack Monitoring from $58 per 8 GiB host per month, Infrastructure Monitoring from $29, and Foundation from $7. A 15-day free trial applies.
4. New Relic
Best for: Teams that want a large free tier and one per-GB rate with no routing.
Type: Commercial SaaS.
Rating: G2 4.4/5, Gartner Peer Insights 4.6/5
New Relic prices on two meters, data and people. Data comes with a large free allowance and one flat rate after it. Hosts, agents, and containers come included without limit.
Coralogix users will recognize the per-GB shape. The routing exercise disappears, because every gigabyte costs the same.
Users form the second meter, and the one that surprises people. Basic users cost nothing, core users pay a monthly seat, and full platform users pay more, with the rate climbing on Pro and Enterprise.
A team of 30 engineers who all need APM will notice that line, and in our experience it gets negotiated harder than the data rate.
NRQL counts as proprietary too. It reads like SQL, and most people pick it up in a week.
Pros
- The free tier runs a small production estate with no bill at all.
- One ingest rate for every data type, with no tiers to manage.
- No charge for data egress or rehydration, a rarity in this category.
Cons
- Per-user pricing grows with headcount. The Pro and Enterprise seat rates do not appear on the public page.
- Retention defaults to 8 days on most data types. Long history needs Data Plus or an add-on.
- Once you cross 100 GB with no card on file, ingest stops for the month.
Pricing: Free for 100 GB a month and one full platform user. Data costs $0.40 per GB after that, or $0.60 with Data Plus. Core users start at $49, and full platform users start at $10 per user per month on Standard.
5. Grafana Cloud
Best for: Teams that want open query standards and the dashboards they already know.
Type: Commercial SaaS on an open-source stack.
Rating: G2 4.5/5, Gartner Peer Insights 4.5/5
Grafana Cloud is the managed version of the LGTM stack: Loki for logs, Mimir for metrics, Tempo for traces, and Grafana on top.
Queries use LogQL and PromQL. Every one of them also runs on the open-source stack you could host yourself. The exit door stays open, which matters to a team leaving DataPrime.
The free tier leads this list, and Pro adds a small platform fee plus usage rates per series, per gigabyte, and per user. The full Grafana Cloud pricing picture holds one trap for Coralogix refugees. Metrics bill per series, and high-cardinality labels multiply fast.
Pros
- Queries and dashboards move to a self-hosted stack unchanged, so lock-in stays minimal.
- The free tier serves a small estate for as long as you like.
- Most engineers already know Grafana, which shortens onboarding to days.
Cons
- Three datastores and two query languages leave correlation for you to build.
- Support runs community-only on Free and 8x5 email on Pro.
- AI features draw from token pools metered separately from telemetry.
Pricing: Free tier with 10,000 metric series, 50 GB of logs, and 50 GB of traces on 14-day retention. Pro costs $19 a month plus $8 per 1,000 series, $0.50 per GB of logs and of traces, and $8 per active user. Enterprise starts at $25,000 a year.
6. Elastic Observability
Best for: Log-heavy teams that want full-text search and a SIEM on the same data.
Type: Open core, with hosted and serverless commercial options.
Rating: G2 4.5/5, Gartner Peer Insights 4.5/5
Elastic sits closest to Coralogix's roots. Coralogix's own docs describe Frequent Search as hot storage on OpenSearch, and Elastic gives you the search engine directly, with the whole ecosystem around it. Lucene query syntax transfers, and ES|QL adds a newer piped language for analytics.
You can run it three ways. Self-managed costs nothing on the Basic license. It puts shards, JVM heap, and cluster health on your team.
Elastic Cloud Hosted bills on the resources you reserve. Serverless bills on what you ingest and retain, with a cheaper Logs Essentials tier for teams that only need logs.
Pros
- Runs fully on-premises, with commercial support available on the self-managed path.
- Search speed and flexibility that log-heavy teams rarely find elsewhere.
- A SIEM on the same data, so security and operations share one store.
Cons
- Kibana and index lifecycle management take weeks to learn well.
- Serverless meters retention beside ingest, so long history gets its own line item.
- The licensing history (SSPL, ELv2, then AGPL in 2024) leaves some teams cautious.
Pricing: Free self-managed on the Basic license. Serverless Logs Essentials from $0.07 per GB ingested, and Complete from $0.09 per GB for logs and traces and $0.023 per GB for metrics, plus retention per GB per month. Elastic Cloud Hosted bills on reserved resources.
7. SigNoz
Best for: OpenTelemetry-first teams that want one open-source app for all three signals.
Type: Open source, MIT community edition, with a managed cloud.
Rating: G2 4.6/5. No significant Gartner Peer Insights listing yet.
SigNoz runs OpenTelemetry-native on a ClickHouse backend. It keeps all three signals in one interface instead of three datastores. You query through a builder, ClickHouse SQL, or PromQL for metrics. The MIT-licensed community edition costs nothing to self-host, with no cap.
SigNoz Cloud starts at a small monthly minimum that converts into usage, with per-GB rates for logs and traces and per-sample rates for metrics. Enterprise adds dedicated cloud, bring-your-own-cloud, or supported self-hosting.
You can model SigNoz pricing in a spreadsheet in ten minutes. Few platforms on this list can say that.
Pros
- MIT license on the community edition, so self-hosting scales at no license cost.
- Published per-GB and per-sample rates with no tiers or routing.
- Unlimited users and hosts on every cloud plan.
Cons
- Self-hosting means running ClickHouse, a skill of its own.
- A younger ecosystem, so integrations and enterprise controls keep filling in.
- Cloud retention defaults to 15 days for logs and traces, and longer costs more.
Pros
- Nothing to run, and no daily quota that blocks ingest at midnight.
- Observability and security operations share one platform and one bill.
- Unlimited users on every plan.
Cons
- Scan-based billing rewards restraint, punishes busy dashboards, and resists forecasting.
- The query language stays proprietary, so the portability problem stays too.
- SaaS only, with no self-hosted path.
Pricing: Free self-hosted. SigNoz Cloud from $49 a month including $49 of usage, then $0.30 per GB for logs and traces on 15-day retention and $0.10 per million metric samples. Enterprise from $4,000 a month.
8. Sumo Logic
Best for: Teams that want managed logs and a SIEM, billed on what they search.
Type: Commercial SaaS.
Rating: G2 4.3/5, Gartner Peer Insights 4.3/5
Sumo Logic's Flex licensing inverts the Coralogix model. Ingest costs nothing. You pay in credits for the data your queries, dashboards, and monitors scan. Retention carries its own charge.
A chatty application nobody searches costs very little. A dashboard refreshing every minute against a year of history costs a lot.
The security half keeps it on shortlists. Cloud SIEM and SOAR sit on the same platform as log analytics, so an operations query and a detection rule read the same data.
Model Sumo Logic pricing in a spreadsheet before you commit, because scan volume is harder to predict than ingest volume.
Pricing: Credit-based. Flex plans charge nothing for ingest and bill on data scanned and retained, with an Essentials tier for smaller teams. Credit bundles up to $25,000 can be bought by card, and a free trial is available.
9. Splunk Observability Cloud
Best for: Teams already on Splunk that want metrics, traces, and RUM from the same vendor.
Type: Commercial SaaS, part of Cisco since March 2024.
Rating: G2 4.3/5, Gartner Peer Insights 4.4/5
Splunk Observability Cloud covers the metrics, APM, RUM, and synthetics half of Splunk. Logs stay in Splunk Cloud Platform or Splunk Enterprise. Log Observer Connect bridges the two.
That split matters, because a Coralogix account covers all three signals on one meter and Splunk covers them on two products.
The observability side prices per host, in bundles that step up from infrastructure alone to the full end-to-end suite. Logs meter separately under Splunk pricing, on ingest or workload. In return you get NoSample full-fidelity tracing and a mature OpenTelemetry collection path.
Pros
- The strongest option here for a security team that already lives in Splunk.
- Synthetics and RUM price per request and per session, so they scale down for small sites.
- Logs can stay on-premises while the observability side runs as SaaS.
Cons
- Two products and two bills: per-host observability beside per-GB or workload logs.
- SPL adds another proprietary language, and one of the harder ones.
- Priced for enterprises, and Cisco's packaging keeps changing.
Pricing: Infrastructure Monitoring from $15 per host per month, APM from $55, the App and Infra bundle from $60, and End-to-End from $75, all billed annually. Logs price separately on the Splunk platform.
10. Dash0
Best for: OpenTelemetry-first teams that want one query language across logs, metrics, and traces.
Type: Commercial SaaS.
Rating: Too new for a meaningful G2 or Gartner Peer Insights listing.
Mirko Novakovic founded Dash0 in 2023, after founding Instana. He built it entirely on OpenTelemetry.
PromQL works across every signal, with Lucene syntax available for logs, so a team leaving DataPrime lands on a language it already knows. Pricing counts records instead of gigabytes, which changes how you think about cost.
The trade comes down to age. A 2023 startup carries a short track record, a small community, and a SaaS-only footprint. Per-record billing also takes a new mental model, since a 5 KB stack trace and a 200-byte access log cost the same.
Pros
- Open query standards from day one, with nothing proprietary to unlearn later.
- Metric retention runs 13 months by default, longer than most SaaS peers.
- The 14-day trial has no volume cap, so you can test at production scale.
Cons
- Thin review footprint on G2 and Gartner Peer Insights.
- SaaS only, with no self-hosted or on-premises path.
- High-volume, small-record telemetry adds up faster than per-GB billing suggests.
Pricing: $0.20 per million metric data points with 13-month retention, and $0.60 per million spans, log records, or web events with 30-day retention. No base fee, with a 14-day unlimited trial.
Are the Open Source Coralogix Alternatives Good Enough?
Open source Coralogix alternatives work for teams whose engineers can run a datastore. Grafana's LGTM stack, SigNoz's community edition, and self-managed Elastic cover logs, metrics, and traces. None charges a license fee. Two gaps decide whether that holds for you.
Operations make up the first gap. Loki wants its object storage tuned, ClickHouse wants memory and disk planned ahead, and Elasticsearch wants shards and heap watched every day.
Coralogix answers a support chat in a median of 17 seconds. When a self-hosted stack fails at the worst moment, you become the support desk.
Correlation makes up the second gap. Coralogix links a log line to its trace and its metrics for you. On an open-source stack, you build that log correlation yourself in dashboards and labels. Of all the work in a migration, we see teams underestimate that part most.
If finding the right log usually solves your incidents, the open-source path works. If they need all three signals at once, budget the engineering hours or buy the join.
How Do You Choose the Right Coralogix Alternative?
The table below pairs each reason for leaving Coralogix with the tool that answers it.
Situation | Start With | Why |
Your estate includes switches, VMware, and on-premises servers | Motadata ObserveOps | SNMP, flows, and configuration sit beside logs and traces on one license |
You want everything in one SaaS and can fund it | Datadog | More than 1,000 integrations and the broadest feature set |
The estate is too large to map by hand | Dynatrace | OneAgent discovery and Davis AI root cause need no wiring |
You want one per-GB rate and a real free tier | New Relic | 100 GB free, then $0.40 per GB with no tiers |
You want queries that run anywhere | Grafana Cloud | LogQL and PromQL run on the open-source stack too |
Search is the job and a SIEM may follow | Elastic Observability | Full-text search with Elastic Security on the same indices |
You are OpenTelemetry-first and want open source | SigNoz | MIT licensed, one app for all three signals |
Ingest is huge but nobody searches most of it | Sumo Logic | Ingest is free and you pay for what you scan |
Splunk already holds your logs | Splunk Observability Cloud | Metrics and traces beside the logs you already pay for |
You want PromQL for everything and no base fee | Dash0 | Per-record pricing with budget limits built in |
One question settles most of the shortlists we see.
If data growth alone explains your last three invoices, buy a cheaper per-GB platform.
If routing mistakes, expired units, or a midnight quota block explain them, the meter caused the problem, and you want a license that counts something else.
When Is Coralogix Still the Right Choice?
Coralogix still fits a specific case. Say your estate runs cloud-native, your volume runs high, and your engineers like DataPrime and have time to keep TCO policies tidy. Coralogix does that job at a lower rate than most of this list.
The archive in your own S3 bucket counts as a real advantage. Retention runs as long as you want, and querying the archive costs no quota. Support answers fast, and a human answers it.
If you run LLM applications, AI Center evaluations and guardrails give you a product most alternatives here do not sell.
The reasons we see teams move run deeper than features. The bill rewards routing skill more than it rewards restraint. The query language stays behind when you leave.
The roadmap, by the company's own account, heads toward AI agents. If none of those bother you, renew with a clear conscience.
Replace Coralogix With Motadata ObserveOps
Coralogix answers one question well. How do you keep high-volume telemetry affordable without dropping it? A cloud-native team with time to tune routing policies may need nothing more.
Motadata ObserveOps answers the next one. Logs, metrics, flows, and traces sit in one backend with the network and servers beneath them, licensed per source so a busy week changes storage and leaves the invoice alone.
OpenTelemetry-native monitoring means the instrumentation you built for Coralogix comes along, and six deployment modes mean the data can stay on-premises when it has to.
We would not put it in front of everyone. Among the Coralogix alternatives above, Kubernetes-only teams with no network to watch should take Grafana Cloud or SigNoz.
Everyone else gets one platform to license, one topology to correlate on, and a bill that stops depending on who wrote the routing policy.
FAQs
What is Coralogix used for?
Coralogix is a SaaS observability platform for logs, metrics, traces, RUM, and security data, with a streaming engine that processes data before it is stored. The alternatives above cover the same three core signals, and Motadata ObserveOps adds the network and on-premises infrastructure Coralogix does not reach.
Can you move DataPrime queries to another platform?
No converter exists, so every DataPrime query, dashboard, and TCO policy needs a rewrite. The move costs least onto platforms with open query standards, and least of all when your instrumentation already runs on OpenTelemetry, which ObserveOps and most tools above ingest natively.
What happens to your Coralogix data when you switch?
Data routed to Monitoring or Compliance lives in your own S3 bucket as Parquet files, so it stays yours after the contract ends. Frequent Search data expires on its retention setting, which Coralogix recommends keeping under seven days, so export anything you need from it before the last day.
Which Coralogix alternatives run on-premises?
Self-hosted open-source stacks and Elastic self-managed run wherever you put them, and Motadata ObserveOps runs on-premises, in private cloud, or in public cloud across six deployment modes. Datadog, New Relic, Dynatrace, Sumo Logic, and Dash0 stay SaaS only, like Coralogix itself.
Is Motadata ObserveOps a good Coralogix alternative?
It fits IT teams that want application telemetry and the network and servers beneath it on one license counted per source, with an on-premises option. It fits poorly if you only run Kubernetes, want a SaaS endpoint with nothing to deploy, or bought Coralogix mainly for AI Center.
Author
Ramya Shah
Technical Writer
Ramya Shah is a technical content writer with a computer engineering background and roots in automotive journalism. He covers IT Service Management, observability, IT operations, and AI-driven automation. An early adopter of AI-assisted writing workflows, he turns complex IT processes into clear, engaging content optimized for search and answer engines (AEO), lifting content output and organic visibility.