A Practical ClickHouse Monitoring Guide Built Around Failure Modes
Why does a ClickHouse cluster report every node as healthy while inserts start failing and dashboards go stale? Most often the failing subsystem was never represented in the metrics anyone had on screen. A node answers its health check while its replication queue has been growing for hours.
ClickHouse breaks in specific, repeatable ways. Parts accumulate faster than background merges can consolidate them. Coordination drops quorum and every replicated table quietly turns read-only.
General database monitoring coverage catches the obvious cases, such as a node that stops responding or a disk that fills to capacity. The failures that produce production incidents are narrower, living inside merge scheduling, replication queues, and coordination state.
In this blog, you will see each ClickHouse failure mode written as a compact runbook, covering the symptom users report, the subsystem behind it, the evidence to inspect, how to read that evidence, and when to escalate. A symptom-to-metric matrix and a dashboard blueprint close the guide.
What Does ClickHouse Monitoring Actually Cover?
ClickHouse monitoring covers seven subsystems that degrade independently of one another, which is why a single availability check tells you very little. A cluster can lose replication while queries stay fast, or serve queries at normal speed while inserts are being throttled.
The seven subsystems worth separating:
Query execution: Duration, memory ceilings, rows and bytes scanned, exception codes
Insert pipeline: Insert rates, batch sizes, asynchronous insert behavior, delayed and rejected inserts
Merges and parts: Active merges, parts per partition, mutation backlog
Replication: Queue depth, absolute delay, replication errors, read-only replicas
Coordination: Keeper session state, quorum, request latency
Caching and indexing: Mark cache hit ratio, granules scanned versus granules available
Storage and connections: Free space per disk, active sessions, connection counts, backup outcomes
ClickHouse observability, as opposed to a pass or fail health check, means holding all seven at once and knowing which one moved first. Column-oriented engines fail in an order, where merge pressure usually precedes insert rejection and coordination loss usually precedes replication stall. Watching throughput alone will never reveal that sequence.
Why Does ClickHouse Monitoring Matter to the Business?
ClickHouse monitoring matters commercially because ClickHouse usually holds the data other people make decisions on. It is a column-oriented analytical database built for fast aggregation over very large datasets, which is why it ends up behind customer-facing analytics, usage billing, fraud scoring, and executive reporting.
Three exposures follow from that position:
Decisions made on stale data: A lagging replica serves yesterday's numbers to a dashboard that looks current
Records lost at the door: Rejected inserts drop events that no downstream system will ever replay
Revenue features degrading quietly: Customer-facing analytics slows without a single availability alert firing
None of these wake anyone at night, which is exactly what makes them expensive. They surface when someone questions a number in a meeting, by which point the window to correct the data has usually closed. Treating cluster telemetry as a business signal rather than an infrastructure one is what shortens that gap.
Where Do ClickHouse Metrics Come From?
ClickHouse metrics come from system tables inside the database itself, with a small set of HTTP endpoints layered on top for health checks and external scraping. Everything below is reachable with an ordinary database query, which makes the engine unusually transparent to instrument.
The system tables that carry the operational picture:
system.metrics: Point-in-time gauges such as active merges, delayed inserts, and open connections
system.events: Cumulative counters since server start, including cache hits, misses, and failed queries
system.asynchronous_metrics: Periodically refreshed values for memory, disk space, and uptime
system.query_log: One row per query with duration, rows read, memory used, and exception code
system.part_log: Every part created, merged, mutated, or removed
system.replicas and system.replication_queue: Per-table replication state and pending work
system.merges and system.mutations: Currently running background operations and their progress
system.errors: Error codes with occurrence counts, useful for spotting a new failure class quickly
system.text_log: Server-side ClickHouse logs, queryable alongside everything else
Collecting these tables on a schedule is what turns raw counters into data observability for the cluster. Three HTTP endpoints cover the checks that run from outside the database:
/ping: Returns a liveness response, suitable for load balancer and uptime checks
/replicas_status: Reports whether replicated tables on that node are current
/dashboard: Renders the built-in ClickHouse dashboard, a lightweight node view for ad hoc inspection
A metrics endpoint can also be enabled in server configuration. It exposes counters and gauges in a standard scrape format, which is how an external platform collects them on a fixed interval. These sources become useful once you know which one answers which question, so the rest of this guide proceeds failure by failure.
How Do You Diagnose a Slow or Resource-Heavy Query?
ClickHouse query problems show up as rising duration percentiles and memory exceptions well before anyone files a ticket. The engine is fast enough that four seconds feels broken to users accustomed to sub-second responses, and percentiles catch that shift where averages hide it. ClickHouse performance monitoring at the query level begins with those two signals.
Symptom: Dashboards load slowly, exports time out, or users report intermittent failures under load
Likely subsystem: Query execution, often combined with index selectivity
Evidence to inspect:
p95 and p99 latency from system.query_log, grouped by normalized query hash
read_rows and read_bytes against result_rows for the same query
memory_usage per query, compared with the configured per-query memory limit
Failed query counts filtered on exception_code, particularly memory limit and timeout codes
Concurrent query count from system.processes during the degraded window
How to read it: A query scanning tens of millions of rows to return a few hundred is being served without useful index pruning, and the fix belongs in the ordering key or a skip index rather than in server tuning. Duration climbing while rows read stays flat means resource contention, so check concurrency and merge activity in the same window. Memory limit exceptions clustered on one node point at data skew across shards.
Escalate when: p99 duration doubles against a stable baseline, or failed queries appear at all on a workload that normally returns zero
Sustained clickhouse performance work depends on comparing today's query profile against a known-good week, because without that history every slow query looks new. Replication failures escape that same comparison, since queries stay fast while the data behind them goes stale.
What Does Replication Lag Look Like Before It Becomes Data Loss?
ClickHouse replication lag appears first as queue growth and only later as stale reads, which gives you a wide window to act if the queue is part of your observability coverage. A replica that has fallen behind still answers queries, serving older data with nothing in the response to signal it.
Symptom: Two replicas return different row counts for the same query, or a reporting job produces yesterday's numbers
Likely subsystem: Replication, frequently downstream of coordination trouble
Evidence to inspect:
absolute_delay from system.replicas, per replicated table
queue_size, inserts_in_queue, and merges_in_queue for the same tables
is_readonly and is_session_expired flags, which reveal coordination loss rather than throughput loss
Replication error counts and the specific error text in system.replication_queue
Gap between log_pointer and log_max_index
How to read it: Queue depth growing while error counts stay at zero means the replica cannot keep pace with write volume, so the constraint is hardware or merge capacity. Queue depth paired with rising errors means entries are failing and retrying, and the error text names the cause. A replica flagged read-only has lost its coordination session, which moves the investigation to Keeper.
Escalate when: absolute_delay exceeds your freshness requirement for any user-facing table, or any replica reports read-only status for more than a few minutes
Consider a usage-billing report that runs against a replica four hours behind. The invoices it produces are wrong before anyone opens an operations screen, and correcting them costs finance a full cycle.
Why Does ClickHouse Return a Too Many Parts Error?
The ClickHouse too many parts error appears when active parts in a partition cross the server's rejection threshold. Parts accumulate that way whenever small inserts arrive faster than background merges can consolidate them. Each insert creates at least one new part, merges combine them in the background, and the two rates have to stay in balance.
ClickHouse defends itself in two stages, delaying inserts once parts cross a soft threshold and rejecting them at a higher one. The delay stage is the warning, visible in metrics several minutes before anything fails.
Symptom: Insert statements begin returning errors, often after a period of unexplained slowness in the ingest path
Likely subsystem: Merge scheduling, caused by insert batching upstream
Evidence to inspect:
Active part count per partition from system.parts, filtered on active = 1
DelayedInserts from system.metrics, which is the early warning signal
Running merge count and merge duration from system.merges
Background merge pool saturation, comparing active tasks against pool size
Insert row counts per statement from system.part_log, to identify undersized batches
How to read it: A rising part count with an idle merge pool points at merge settings or a partition key producing too many partitions. A saturated merge pool means the server is already merging as hard as it can, so the correction belongs upstream in batch size. Thousands of parts in one partition usually point to a partition key with too much cardinality, most often an hourly partition doing work a monthly one would handle just as well.
Escalate when: DelayedInserts becomes non-zero at all, since that is the server telling you rejection is approaching
A common version arrives with a new event stream. An application group switches from batched writes to per-event inserts, part counts climb through the afternoon, and ingestion stops that evening with no change to infrastructure.
How Do You Tell a Keeper Failure from a ClickHouse Failure?
A ClickHouse Keeper failure looks like a ClickHouse failure from the outside, because replicated tables depend on coordination for every write. The distinguishing signal is that queries keep working while writes to replicated tables stop. Keeper holds replication metadata, distributed DDL queues, and leader election state, all of which a write needs and a read does not. Losing quorum therefore stops replicas from claiming their next block of work while leaving query traffic untouched.
Symptom: Inserts to replicated tables fail while reads succeed, or a DDL statement hangs indefinitely across the cluster
Likely subsystem: Coordination
Evidence to inspect:
Keeper node availability and quorum status across the ensemble
Session expiry counts and connection loss counters on ClickHouse servers
Keeper request latency and outstanding request depth
Znode count and data size, since unbounded growth degrades response times
Clock drift between Keeper nodes
How to read it: Session expiries concentrated on one ClickHouse server point at network trouble on that host, so check its connectivity before touching the ensemble. Expiries across all servers at once mean the ensemble lost quorum, an availability incident for every replicated table. Rising request latency with quorum intact usually reflects znode accumulation from untrimmed distributed DDL history.
Escalate when: Quorum drops below majority, or session expiry counts rise on more than one server in the same window
Coordination trouble is where root cause analysis most often goes wrong, because the visible failure and the failing component are on different hosts. Insert problems are the friendlier case, announcing themselves early whenever the write path carries instrumentation.
What Are the Early Signs of Insert Throttling?
ClickHouse insert throttling begins with added latency on write statements, long before any statement returns an error. The server slows writers deliberately to give merges time to catch up, so instrumenting write duration on the client side turns that behavior into an early alert.
Insert health depends on three things staying in range, each with a distinct failure signature.
Batch size: Rows per insert, where small and frequent batches drive part creation
Insert rate: Statements per second against available merge capacity
Asynchronous insert queue: Buffer flush timing and queue depth when async mode is enabled
Insert failures are the last stage of a sequence that starts several steps earlier in the write path. The flow below marks each point where a write can be delayed, buffered, or refused, so you can instrument the stage before the one that breaks.
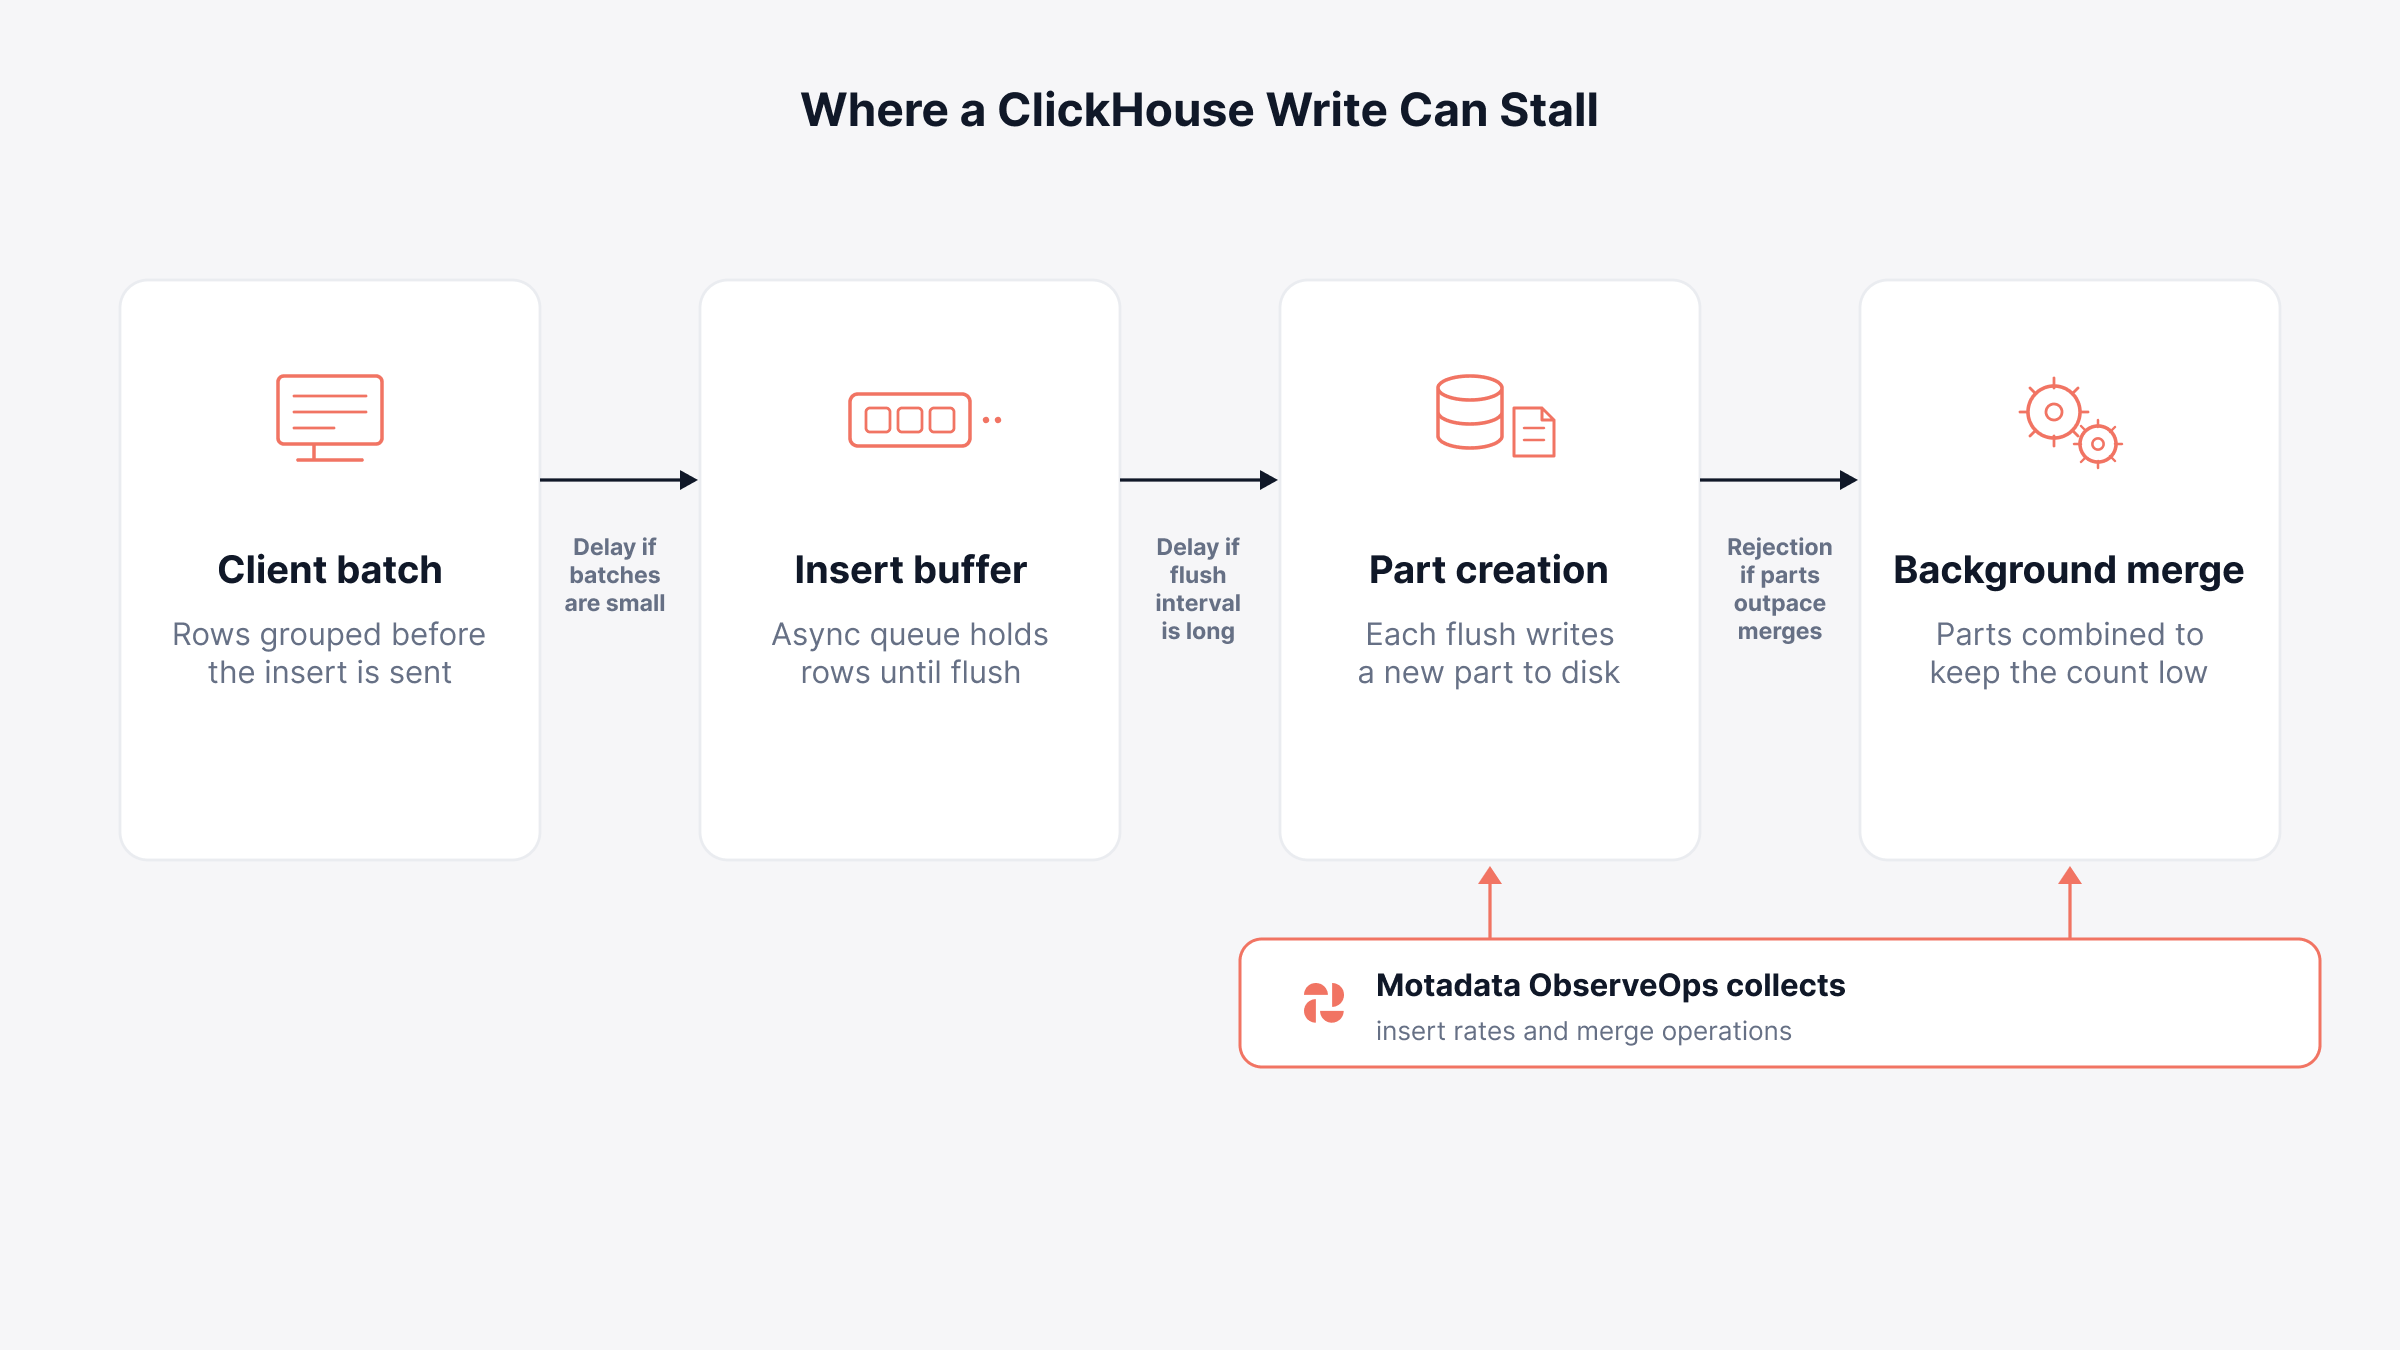
How to read it: Insert duration climbing while row volume holds steady means the server is applying its delay, so the correction belongs in batch size rather than in server capacity. A growing asynchronous queue with stable insert duration points at flush settings instead. Both are cheap to fix while the pipeline is only slow.
Escalate when: Median insert duration rises above baseline while row volume holds steady, since that is throttling rather than load
How Do Cache Misses and Index Inefficiency Show Up in Metrics?
ClickHouse cache and index problems surface as a widening gap between rows read and rows returned, together with a falling mark cache hit ratio. Both are cheap to measure, both point at table design rather than server capacity, and neither will trigger an availability alert.
Symptom: A query that used to return in under a second now takes several, with no change to the query text or the hardware
Likely subsystem: Caching and index selectivity
Evidence to inspect:
Mark cache hits against mark cache misses from system.events
Uncompressed cache hit ratio where that cache is enabled
Granules selected against granules available, visible in query analysis output
read_rows divided by result_rows for the affected query pattern
Filesystem cache hit ratio on clusters using object storage backed disks
How to read it: A mark cache hit ratio falling after a data growth event means the cache is too small for the working set, and raising its size limit is the direct correction. A high scan-to-result ratio means the ordering key does not match how the table is queried, so a database index change or a skip index applies. Both worsen gradually, which is why anomaly detection against a rolling baseline catches them earlier than static thresholds.
Escalate when: Mark cache hit ratio drops below its historical range for more than one polling window on a production node
What Should You Watch for Storage, Backups, Sessions, and Connections?
ClickHouse storage monitoring, backup verification, and connection tracking form the operational floor beneath everything already covered. These fail slowly and predictably, which makes them the easiest failures to prevent and the most embarrassing to miss.
Evidence to inspect:
Free space and total space per disk from system.disks, tracked as a trend rather than a snapshot
Bytes on disk per table and per partition from system.parts
Backup job status and duration from system.backup_log
Active session count and long-running processes from system.processes
Connection counts per protocol from system.metrics, compared against configured maximums
How to read it: Disk consumption growing faster than row count means compression efficiency is falling, usually because column cardinality changed. Detached parts accumulating without a cleanup routine will eventually fill a disk that appears to hold modest table data. Connection counts pressing against the configured maximum produce refused connections that look like network failures to the application team.
Escalate when: Projected time to disk exhaustion falls under thirty days, or a backup job fails twice in succession
Treating this layer as capacity planning rather than as an alert category keeps the conversation ahead of the threshold.
Which Metric Confirms Each ClickHouse Symptom?
Each ClickHouse symptom has one metric that confirms it and one action that sensibly follows. Use the matrix below as the entry point whenever a report arrives without a diagnosis attached.
Reported symptom | Confirming metric | First action |
Dashboards load slowly | p99 query duration from system.query_log | Compare rows read against rows returned for the top query |
Inserts return errors | Active parts per partition, DelayedInserts | Check merge pool saturation, then upstream batch size |
Two replicas disagree | absolute_delay, queue_size in system.replicas | Confirm whether errors are present or the queue is only deep |
Writes fail, reads work | Keeper quorum, session expiry counts | Check ensemble quorum before touching ClickHouse settings |
Query slower with no code change | Mark cache hit ratio, granules selected | Review ordering key fit and cache size limits |
Connections refused | Connection count against configured maximum | Identify long-running sessions in system.processes |
Disk alert on one node | Free space trend, detached part count | Separate table growth from detached part accumulation |
DDL statement hangs | Distributed DDL queue depth | Verify Keeper availability across all ensemble nodes |
What Belongs on a ClickHouse Monitoring Dashboard?
A ClickHouse monitoring dashboard should be organized by failure domain rather than by metric type, so a single glance answers which subsystem moved. Grouping every gauge together and every counter together produces a screen that is complete and unreadable. Four rows carry the operational picture.
Row one, query health: p50, p95, and p99 duration, failed query count, concurrent queries, memory usage against limit
Row two, write path: Insert rate, rows per insert, DelayedInserts, active parts per partition, running merges
Row three, replication and coordination: Absolute delay per table, replication queue depth, replication errors, Keeper quorum state, session expiries
Row four, resources: Free space per disk with a projected exhaustion line, memory usage, active connections, mark cache hit ratio
Every panel needs a baseline drawn alongside the current value, otherwise the viewer cannot judge whether a number is normal. Clickhouse db performance monitoring becomes useful at the point where the dashboard shows deviation instead of raw figures. Keep node-level breakdowns one click away, since cluster-wide aggregates hide single-node problems and per-node panels hide cluster-wide ones.
ClickHouse logs belong beside these panels rather than in a separate tool. Correlating a spike in failed queries with the matching system.text_log entries removes the step where an engineer switches interfaces and loses the timestamp.
How Do You Turn These Signals into an Escalation Path?
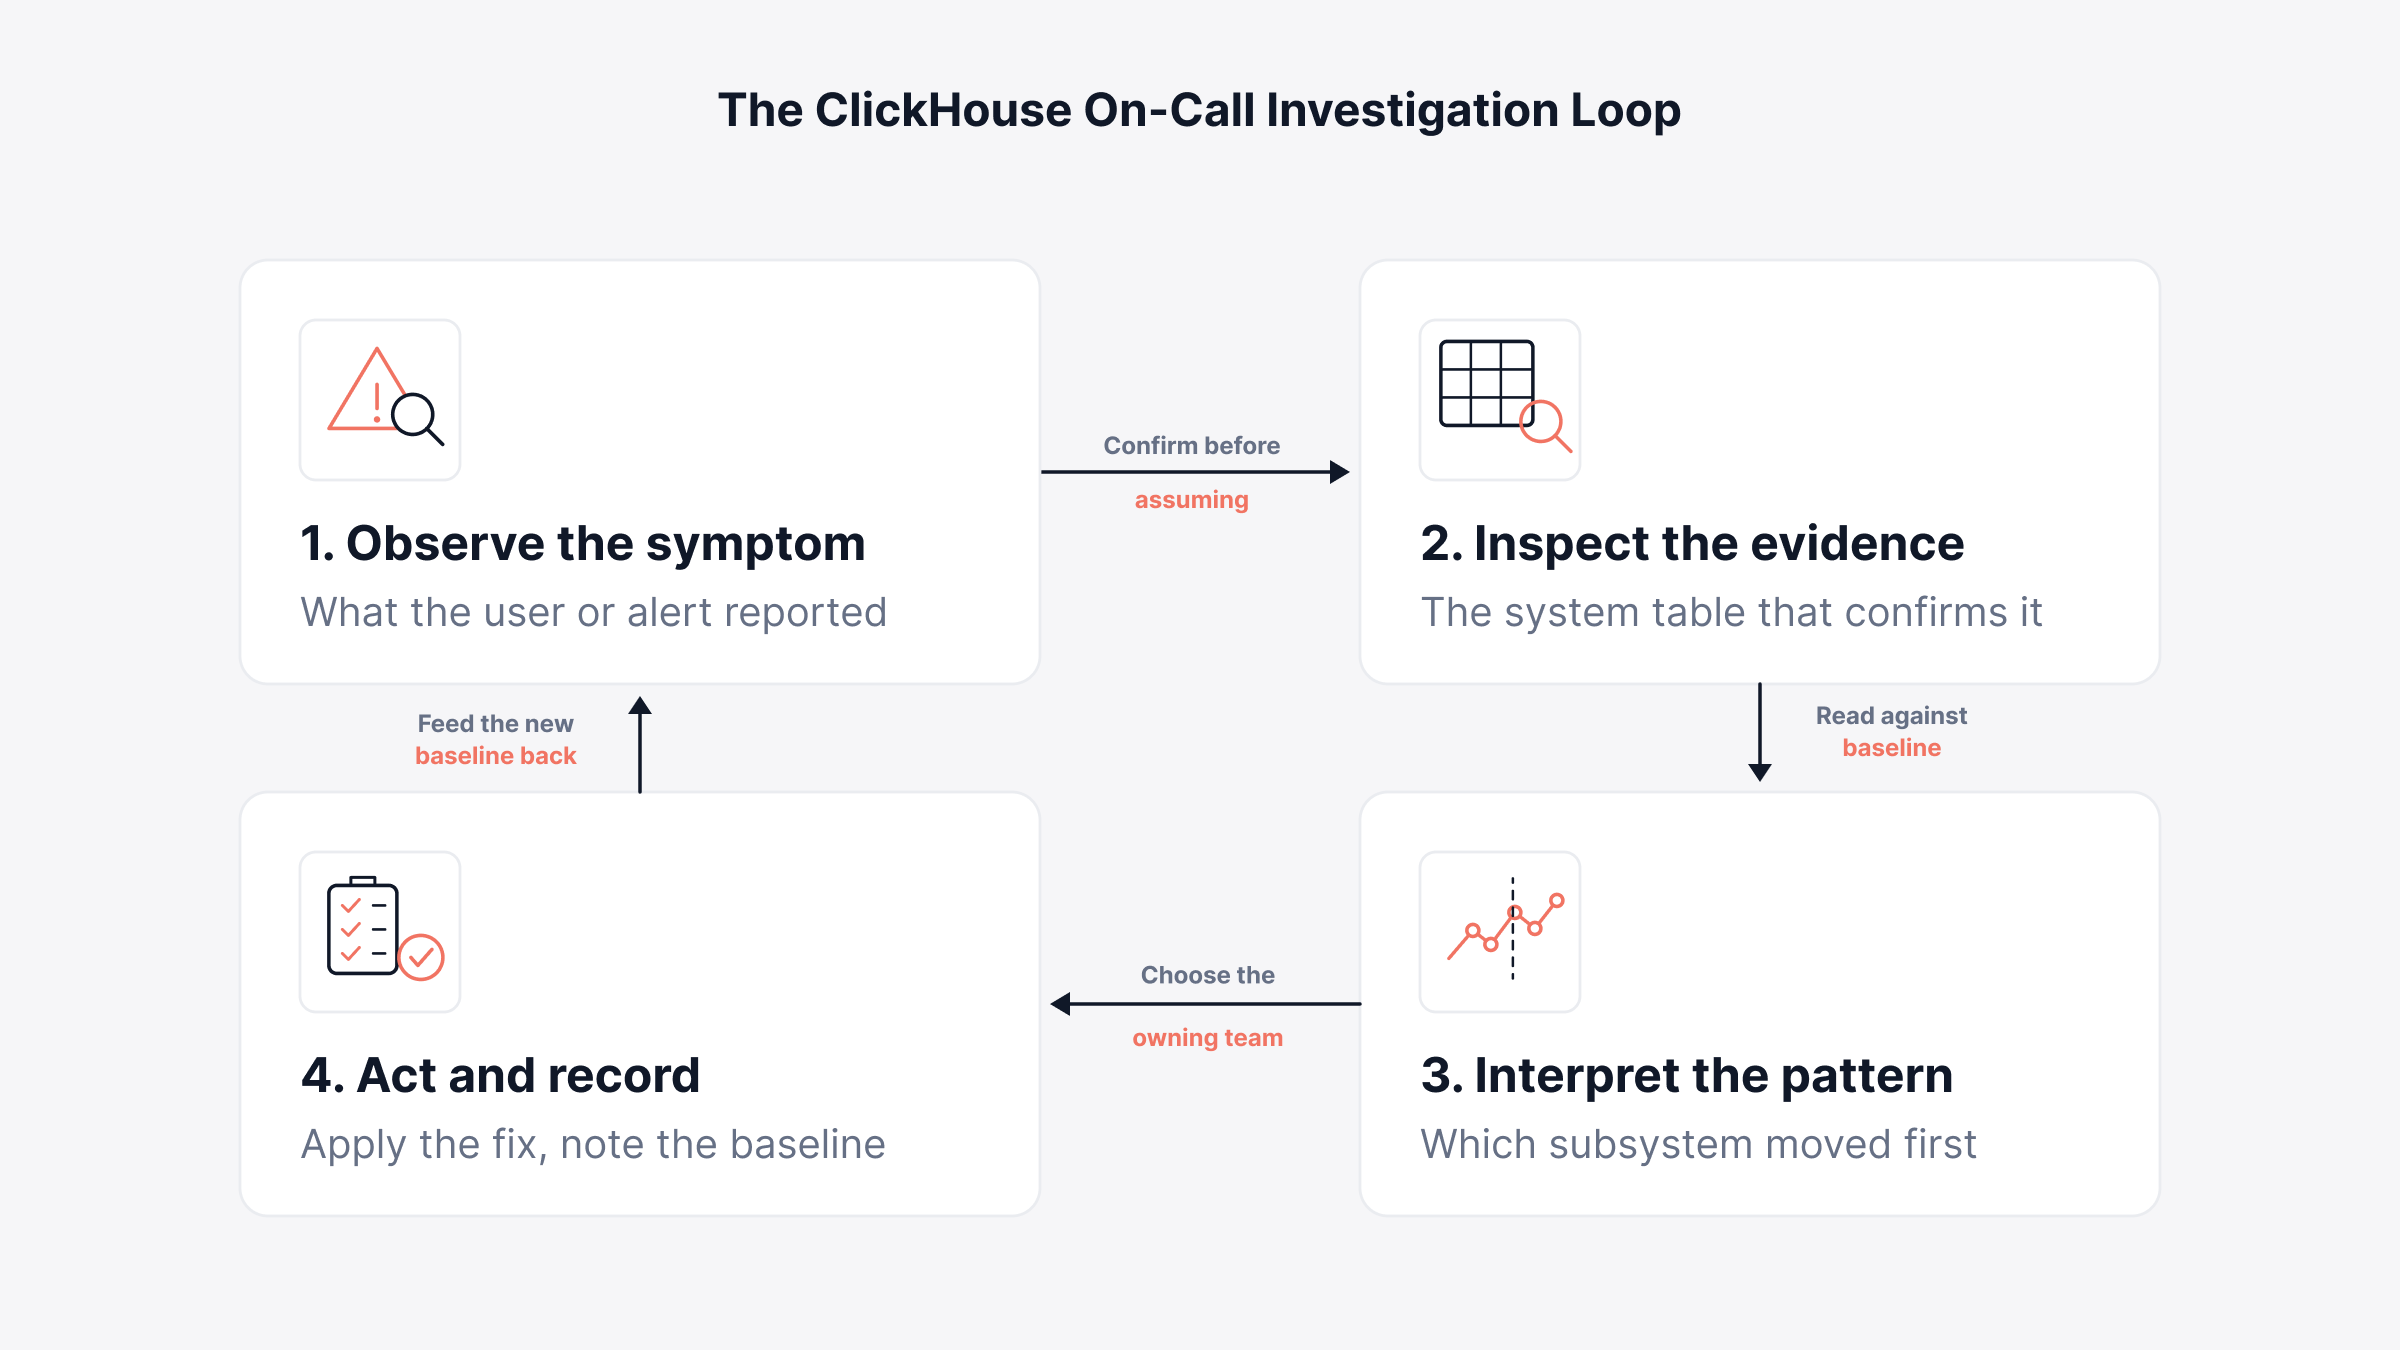
An escalation path converts each metric threshold into a named owner and a defined response. Thresholds without owners produce notifications that everyone assumes someone else is handling. The investigation itself follows one repeatable sequence, whatever the failing subsystem turns out to be.
Every ClickHouse failure in this guide is worked through the same four steps, whichever subsystem raised the alert. The loop below names each step so an on-call engineer can follow it without knowing the failure mode in advance.
Three tiers cover most ClickHouse operations teams:
Automated response: Cache size adjustments, detached part cleanup, and merge pool scaling handled by scheduled routines
Database on-call: Query regressions, ordering key problems, replication queue growth, and batch size corrections
Platform on-call: Keeper quorum loss, disk exhaustion, and network partitions affecting the ensemble
Routing each threshold to one of these tiers keeps alert noise from reaching people who cannot act on it. Track MTTD per subsystem afterward, because the subsystem you detect slowest is the one whose instrumentation needs work.
Bring Every ClickHouse Subsystem into One Operations View with Motadata ObserveOps
No monitoring platform will choose your ordering key or decide your partition granularity. Those stay with the engineers who know how the tables are queried.
Motadata ObserveOps provides dedicated ClickHouse database monitoring, collecting query throughput, failed queries, latency percentiles, replication queue size, replication errors, merge operations, insert rates, memory usage, disk utilization, active connections, and ClickHouse Keeper health. Those figures land beside the host, storage, and network telemetry surrounding the cluster.
When a replication queue grows at the same moment, a switch port starts dropping packets, the two read as a single incident with one cause. The Database Monitoring module then stops being a separate console someone has to remember to open.
FAQs
What is ClickHouse monitoring?
ClickHouse monitoring tracks query execution, insert throughput, merge activity, replication state, coordination health, and resource use across a cluster. Most of the data comes from system tables inside the database, queryable with SQL or collected by an external platform.
Which ClickHouse metrics matter most in production?
Query latency percentiles, failed query counts, active parts per partition, delayed inserts, replication queue depth, and Keeper session state cover the user-visible failures, and Motadata ObserveOps collects every one of them. Disk free space and mark cache hit ratio work better as trends than as fixed thresholds.
What causes the too many parts error in ClickHouse?
The error appears when active parts in a partition exceed the server's rejection threshold, because small inserts are arriving faster than merges consolidate them. Usual causes are undersized batches, excessive partition key cardinality, or a merge pool short on capacity.
How do you monitor ClickHouse Keeper?
Track quorum status across the ensemble, session expiry counts on ClickHouse servers, request latency, outstanding requests, and znode count. Writes to replicated tables failing while reads continue normally is the clearest sign that coordination has degraded.
Does Motadata ObserveOps support ClickHouse monitoring?
Yes. ObserveOps provides dedicated ClickHouse monitoring for query throughput, failed queries, latency percentiles, replication queue size, replication errors, merge operations, insert rates, memory usage, disk utilization, active connections, and Keeper health. All of it feeds alert policies and correlation.
Author
Poonam Lalani
Content Strategist
Poonam Lalani is a B2B content strategist and writer with a background in computer engineering and experience across enterprise technology domains, including AI, cloud, DevOps, data engineering, and IT operations. She specializes in creating research-driven content that simplifies complex ideas and supports product education, thought leadership, and business growth.