10 Best Session Replay Software & Tools for 2026
Some frontend bugs never get fixed because nobody can prove they happened. The user cannot describe what they clicked, and the error log shows nothing.
The best session replay software closes that gap by rebuilding the visit itself. If you want the mechanics first, our guide to what session replay is covers how the recording is built and played back.
Choosing between the tools is the harder part, because three very different kinds of product now sell the same feature. In this blog, we compare the ten best options, including their pros, cons, key features, and pricing.
What Is Session Replay Software?
Session replay software records what a real visitor did in the browser and plays it back step by step. It captures the page structure and every change to it, then rebuilds the session in a player rather than storing a video file.
That design keeps recordings small and lets you mask sensitive fields before anything leaves the device. It also means the replay is only as good as what the recorder captured. That is why the evaluation below weighs capture and correlation over playback polish.
How We Evaluated These Tools
We shortlisted these the way an IT team does, not by counting features. Five things decided the ranking.
Backend correlation: Does a slow call inside a replay link to the trace, log, or query that caused it, or does the investigation stop at the browser?
Scoring on the session: Does each recording arrive with Core Web Vitals and an Apdex rating, or is it footage you interpret yourself?
Privacy defaults: Is input masked before transmission out of the box, and how many masking modes are available?
Coverage: Which frontend frameworks are documented, and does the tool reach native mobile apps?
Pricing transparency: Can a buyer estimate the bill from a public page before talking to sales?
Now, let’s take a look at the 10 software we have finalized for session replay.
The 10 Best Session Replay Software Compared
The ten tools fall into three categories, and the table below groups them that way so you can rule out two categories quickly.
Tool | Category | Best For | Coverage | Backend Correlation | Starting Price |
Motadata ObserveOps | Unified observability | Frontend and backend in one console | Web | Full stack, W3C trace context | Quote-based |
Datadog | Unified observability | Teams already on Datadog | Web and mobile | Full stack | $1.80 per 1,000 sessions |
Dynatrace | Unified observability | Large enterprises | Web and mobile | Full stack | $0.0045 per session |
New Relic | Unified observability | Consumption-based buyers | Web and mobile | Full stack | Free tier, then $0.40/GB |
LogRocket | Frontend engineering | Debugging JavaScript issues | Web and mobile | Frontend only | $69/month |
Sentry | Error tracking | Replay attached to exceptions | Web and mobile | Frontend to backend traces | Free, then $26/month |
FullStory | Product analytics | Product and UX research | Web and mobile | Integrations only | Free to 30,000 sessions |
Microsoft Clarity | Product analytics | Zero-budget web analytics | Web | No | Free |
PostHog | Product analytics | Product teams wanting one stack | Web and mobile | No | Free to 5,000 recordings |
OpenReplay | Open source | Strict data residency | Web | Self-managed | Free to self-host |
The category column does most of the filtering. Unified observability platforms cost more and take longer to deploy, and they answer backend questions. The product analytics tools adopt faster and stop at the browser. Open source only makes sense when data residency decides the purchase.
Detailed Overview of the 10 Best Session Replay Software in 2026
Here is a closer look at the best software for session replay.
1. Motadata ObserveOps
Rating: G2 4.6/5, Gartner Peer Insights 4.3/5
Best for: Teams that want a recorded session sitting next to the trace, log, and infrastructure metric behind it.
Pricing: We do not publish list pricing. Quotes are scoped to your deployment mode and the modules you need, and a free trial is available.
Our session recording and replay runs inside the Real User Monitoring module rather than as a standalone recorder.
Every replayed session carries its Core Web Vitals and an Apdex score against a two-second threshold. A recording arrives with a standard attached, so nobody has to judge it by feel.
Capture is full rather than sampled by default. Browser instrumentation records page views, user actions, JavaScript errors, long tasks, and resource timing. Errors are grouped, so you can tell one bad afternoon from a fault hitting hundreds of sessions.
Star ratings only tell you so much, so it helps to hear from a team that runs ObserveOps every day.
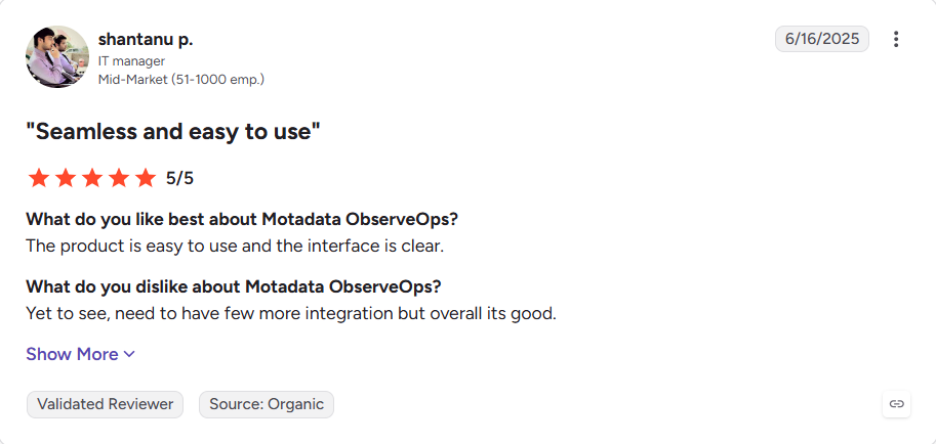
Read more ObserveOps reviews on G2.
Pros
- Replay, APM, logs, flows, network, and infrastructure share one platform and one data store.
- Six deployment modes cover on-premises, private cloud, and public cloud, which regulated buyers usually need.
- Recordings stay on infrastructure you control, which removes the third-party sharing question that drives much of the privacy litigation.
- One quote covers the modules you deploy, so replay does not carry its own separate meter.
Cons
- There is no published price list, so you cannot size the cost from a web page.
- Instrumentation covers web frameworks only, so native iOS and Android apps are out of scope.
- Our review footprint is smaller than the largest incumbents carry.
- A team that only wants session recordings is buying a much larger platform to get them.
2. Datadog
Rating: G2 4.4/5, Gartner Peer Insights 4.6/5
Best for: Cloud-native engineering teams already running Datadog.
Pricing: Browser RUM starts at $1.50 per 1,000 sessions on an annual plan, and RUM with Session Replay starts at $1.80 per 1,000 sessions.
Session Replay sits inside Datadog RUM, so a recorded session ties back to the traces and logs already flowing through the platform. A JavaScript error can be followed to the service that threw it without leaving the console.
None of that pays off unless Datadog already holds your backend data. Bolted onto a stack you monitor elsewhere, it becomes an expensive browser agent.
Pros
- Among the strongest frontend-to-backend correlation in the category.
- Coverage spans browser, native mobile, and hybrid apps.
- The integration catalog is enormous, so it slots into most stacks.
Cons
- Session billing tracks traffic, so a viral week produces a bill nobody forecast. We see that volatility raised in nearly every Datadog pricing conversation.
- Replay is a separate SKU on top of RUM, which makes the true cost harder to model.
- The platform is large enough that smaller teams pay for surface they never use.
3. Dynatrace
Rating: G2 4.5/5
Best for: Large enterprises that need web and native mobile replay under one contract.
Pricing: Real User Monitoring runs at $0.00225 per session, and Real User Monitoring with Session Replay runs at $0.0045 per session.
Dynatrace pairs replay with Davis AI, which clusters similar sessions and flags friction patterns without anyone reviewing recordings manually. For an estate too large to watch by hand, that automation is the main argument.
Deployment is the counterweight. OneAgent gives broad coverage, and it also means a heavier rollout than a JavaScript snippet, which slows down teams that wanted replay running this week.
Pros
- Privacy configuration is among the most granular available.
- Replay covers native mobile apps, not only the browser.
- Automated analysis reduces the manual review that sinks most replay rollouts.
Cons
- Replay doubles the per-session rate, so the cost model needs care. Our Dynatrace pricing breakdown walks through how the units add up.
- OneAgent deployment takes longer than a snippet-based tool.
- The platform is priced and scoped for enterprises, not mid-market teams.
4. New Relic
Rating: G2 4.3/5
Best for: Teams that prefer paying for data volume rather than per session.
Pricing: A free tier covers 100 GB a month, and data beyond it is billed from $0.40 per GB, with separate per-user charges.
Session replay is part of New Relic Browser, so recordings sit with the APM traces, errors, and logs already in the platform. Console logs and network activity appear inside the player, which keeps engineers from reconstructing state by hand.
The consumption model is the real differentiator. Paying by ingested data rather than by session suits teams with spiky traffic, though the per-user charges catch buyers out.
Pros
- The free tier is genuinely usable for a small application.
- Data-volume pricing absorbs traffic spikes better than per-session billing.
- Replay, APM, and logs sit in one platform.
Cons
- Per-user charges stack on top of data costs, so team growth moves the bill. Our New Relic pricing guide covers how the two meters interact.
- Estimating monthly ingest before you instrument is difficult.
- The interface takes longer to learn than the single-purpose tools here.
5. LogRocket
Rating: G2 4.6/5
Best for: Frontend engineers reproducing JavaScript bugs.
Pricing: A free plan is available, and paid plans start at $69 a month.
LogRocket reproduces the DOM closely enough that replays hold up as technical evidence, including iframes. Console logs, network requests, and application state sit alongside the recording, which is why it shows up in developer-led organizations more than in UX teams.
Its depth stops at the frontend. Teams that also need backend APM and log correlation generally run it beside an observability platform, which means two tools and two bills.
Pros
- Console and network integration is among the most complete in the category.
- Replay fidelity holds up on complex single-page applications.
- Coverage includes mobile as well as web.
Cons
- Auto-recording captures every session, including very short ones, so quotas run out mid-month on unpredictable traffic.
- No backend APM, so a slow query stays invisible.
- Geared toward technical troubleshooting rather than conversion or UX analysis.
6. Sentry
Rating: G2 4.5/5
Best for: Teams that want replay attached to an exception rather than browsed on its own.
Pricing: A free tier is available, and paid plans start at $26 a month.
Sentry starts from the error. Its browser SDK records 10 percent of sessions by default and 100 percent of sessions that contain an error, which tells you exactly where the product points.
That default is efficient for debugging and limiting for research. If you want to study how healthy sessions flow, you are sampling against the grain of the tool.
Pros
- The cheapest paid entry point of any commercial tool here.
- Framework and platform coverage is unusually wide.
- Replay connects to frontend and backend traces within Sentry.
Cons
- The free tier caps replays low enough that most teams hit it quickly.
- The 10 percent session default means most ordinary sessions are never recorded.
- It is an error tracker first, so behavioral analysis is thin.
7. FullStory
Rating: G2 4.5/5
Best for: Product managers and UX researchers who want capture without manual event tagging.
Pricing: A free plan covers 30,000 sessions a month with 12 months of analytics retention. Paid tiers are quote-based.
FullStory autocaptures every interaction, which means you can search your session library for an action nobody thought to track before the recording started. That retroactive search is the capability rival tools find hardest to match.
The trade it makes is depth on the backend. Correlating a session with a server-side trace means working across separate tools, so engineering teams often end up running it beside an observability platform.
Pros
- The most generous free tier of any commercial tool in this list.
- Search and segmentation are the strongest in the category.
- Coverage spans web and mobile.
Cons
- Enterprise pricing is quote-only, and costs climb quickly past the free tier.
- Default masking hides all text, which makes replays hard to follow until someone configures it.
- Mobile recording sits behind add-ons rather than the base plan.
8. Microsoft Clarity
Rating: G2 4.6/5
Best for: Teams with no budget who want recordings and heatmaps on a website.
Pricing: Free, with no session cap.
Clarity records without volume limits and adds heatmaps, rage-click detection, and dead-click detection at no cost. For a marketing site or a small application, nothing else in this list competes on value.
The limits appear once you need depth. Retention windows are short, event tracking is basic, and there is no path from a session to a backend fault.
Pros
- Genuinely free, with no volume trap waiting later.
- Setup takes minutes.
- Heatmaps and recordings together cover most basic CRO work.
Cons
- Short data retention makes historical comparison impossible.
- No backend correlation, so it cannot support engineering investigations.
- Advanced event tracking and segmentation are limited.
9. PostHog
Rating: G2 4.4/5
Best for: Product teams that want replay, analytics, and feature flags in one stack.
Pricing: Free up to 5,000 recordings a month, then $0.005 per recording. Self-hosting is available.
PostHog bundles session replay with product analytics, funnels, feature flags, and experiments, so a drop-off in a funnel leads straight to the sessions behind it. Data protection is configurable at CSS level, which gives unusually granular control over capture.
Self-hosting is the reason regulated teams shortlist it. That control comes with running the infrastructure yourself, which belongs in the total cost.
Pros
- The broadest product toolkit of anything in this list.
- Usage-based pricing starts genuinely cheap.
- Open source, with a self-hosted path for data residency.
Cons
- Recording fidelity can be inconsistent, with known React and font rendering issues.
- Usage-based pricing is harder to forecast than a flat plan.
- Self-hosting carries real engineering overhead.
10. OpenReplay
Rating: G2 4.6/5
Best for: Teams whose deciding factor is keeping session data inside their own environment.
Pricing: Free to self-host as open source, with a paid cloud option.
OpenReplay is a self-hosted replay and debugging suite with developer tooling built in. For data residency or on-premises requirements, it answers the question no SaaS vendor can.
Everything else is work you take on. You operate and scale the infrastructure, and correlation with a wider observability stack is something you build rather than receive.
Pros
- The strongest answer for strict data residency requirements.
- No per-session licensing when self-hosted.
- The codebase can be extended to fit an unusual workflow.
Cons
- You own the infrastructure, the scaling, and the upgrades.
- Backend correlation is something you build, not a feature you enable.
- Commercial support and documentation are thinner than the paid platforms here.
What Should You Look for in Session Replay Software?
Look for five things, weighted by whoever will actually watch the recordings. Playback quality demos beautifully and tells you the least, because every tool above renders a clean session.
1. Backend Correlation
Ask whether a slow call inside a replay links to the trace behind it. Check whether that link uses a standard like W3C Trace Context or a proprietary join. Without it, every investigation adds a manual step of matching timestamps against application performance monitoring data, and that step repeats on every incident.
2. Scoring on Every Session
Check whether each recording carries its Core Web Vitals and an Apdex rating. Watching a session tells you it felt slow. A scored session tells you whether it was slow, which is the difference between an opinion and a ticket.
3. Masking Defaults
Confirm that input is masked before transmission rather than at display, and ask how many masking modes exist. A tool that records everything unless told otherwise puts the burden on whoever configures it. In our experience that is rarely the person who signed the contract.
4. Sampling Control
Find out the default sampling rate and whether you can raise it to 100 percent. Sampling is how vendors control cost, and the session you need is usually the rare one. A 10 percent default means most bug reports have no recording behind them.
5. Search and Workflow Fit
Test whether you can filter by geography, device, and error, save those filters, and route a matching session into your incident process. Recording sessions is easy and finding the right one is not, so a tool nobody opens during an incident is shelfware.
How Do You Choose the Right Session Replay Tool for Your Team?
Match the tool to the team that will use it most, then check it against your budget and compliance position. The table below maps the common situations to a starting point.
Your situation | Start with | Why |
You already run APM and want replay beside it | Motadata ObserveOps | Scored sessions and trace correlation in one platform, deployable on-premises |
Product and UX research is the main job | FullStory | Autocapture and retroactive search beat every engineering-first tool |
Your stack is already Datadog or Dynatrace | That platform's replay | Correlation is native, and a second vendor adds a manual step |
Engineers will do the watching | LogRocket or Sentry | Console, network, and state sit inside the recording |
The budget is zero | Microsoft Clarity | Unlimited recordings and heatmaps at no cost |
Data cannot leave your environment | OpenReplay or PostHog | Self-hosting removes the third-party question entirely |
Traffic is spiky and unpredictable | New Relic | Data-volume pricing absorbs spikes better than per-session billing |
One more check before you sign. Run a two-week trial on a single high-value flow, and mask everything in staging first.
Then break something on purpose and see how far the tool carries you toward the cause. Aggregate RUM and synthetic monitoring still cover what replay cannot, so treat this as one layer rather than the whole picture.
Pick the Best Session Replay Software for Your Business
Every tool above records a session competently, so the recording itself settles nothing. They differ in what the recording is attached to, and whether it comes back carrying a score, a grouped error, and a route to the backend.
None of them is a complete picture. Replay watches browsers, so native apps and API traffic stay invisible. It also needs aggregate RUM beside it to tell you whether one bad session is a pattern or an anecdote.
If your team already owns the backend problem as well as the frontend one, Motadata ObserveOps keeps both in one console and one data store. If the job is purely behavioral research, FullStory will serve you better, and we would rather say so than watch a bad fit fail in month three.
FAQs
What is the difference between session replay and real user monitoring?
RUM measures experience across all your traffic, reporting load times, Core Web Vitals, and error rates in aggregate. Session replay rebuilds one visit so you can watch it. In ObserveOps both sit in the same module, so a trend leads to the session behind it.
Does session replay software slow down your website?
A well-built recorder adds a small script with no visible effect on most connections. The impact appears on low-end devices and slow networks, so measure your Core Web Vitals with the script on and off before rolling it out widely.
Which session replay software is free?
Microsoft Clarity is free with no session cap, and OpenReplay is free to self-host. FullStory, Sentry, PostHog, and New Relic all offer free tiers with volume limits that most growing applications pass within a year.
Can session replay software record mobile apps?
Some vendors ship native iOS and Android SDKs, including Dynatrace, Sentry, and LogRocket. Many tools instrument the browser only, ObserveOps included, so check for a dedicated mobile SDK by name rather than assuming a web tool covers it.
How long should you keep session recordings?
Most teams retain recordings for 30 to 90 days, which covers normal support and debugging cycles. Shorter retention lowers storage cost and reduces exposure if a privacy claim arrives. Running ObserveOps on your own infrastructure means retention follows your policy, not a vendor default.
Author
Ramya Shah
Technical Writer
Ramya Shah is a technical content writer with a computer engineering background and roots in automotive journalism. He covers IT Service Management, observability, IT operations, and AI-driven automation. An early adopter of AI-assisted writing workflows, he turns complex IT processes into clear, engaging content optimized for search and answer engines (AEO), lifting content output and organic visibility.