9 Best Log Management Tools and What They Cost
Most log management tools bill you on log ingestion, the volume of data you send them. That works until your log volume doubles, and the invoice doubles with it.
The best log management tools let you control what gets indexed and kept, so growth stops being a budget problem.
In this blog, you will see:
The comparison table: Nine tools sorted by what their pricing meter counts.
Full reviews: Every tool carries real cons and limits.
What changed in 2026: Log growth is outrunning per-gigabyte pricing.
By the end you will know which fits your volume.
What Is Log Management?
Log management is the full lifecycle of your log data, from the moment it is collected to the moment it is deleted. It covers collection, parsing into fields, log indexing, search, alerting, retention policy, and archiving.
Log aggregation is the first stage of that lifecycle, and the log aggregation tools that own it get your data into one searchable place. Every stage after that is what separates the products below.
Two jobs live inside this category and they pull against each other. Engineering wants every log searchable in seconds. Finance wants a bill that stops climbing every quarter. Every tool here picks a side, and its pricing model tells you which one.
How We Evaluated These Log Management Tools
Feature lists here all read the same on a vendor page. Six questions decided the ranking instead.
What the meter counts: Does the price follow gigabytes ingested, hosts, users, or the number of sources you watch? This single choice explains most of the cost gaps below.
Cost at ten times the volume: Model the bill at 10x today's data. Some tools barely move, and others multiply.
Retention and tiering: Can you keep firewall logs for a year and debug logs for one sprint, at different prices?
Search speed past a few terabytes: Does an unfiltered text search over weeks of data return, or crawl?
Deployment and data residency: SaaS only, or can it run on hardware you control?
Correlation beyond logs: When errors spike, does the tool name the host and the traffic underneath, or stop at the log line?
Prices come from public rate cards and pricing pages, checked in August 2026. Where a vendor will not publish a number, that is said plainly rather than estimated.
The 9 Best Log Management Tools Compared
Here is a quick overview of the nine tools, using the columns that decide most shortlists.
Tool | Best For | Deployment | Pricing Model | Scale Sweet Spot | Starting Price |
Motadata ObserveOps | Logs beside metrics and network flows | On-prem, private and public cloud (6 modes) | Per log source | Any volume, counted by source | Quote-based |
Splunk | Enterprise security analytics | SaaS, self-hosted, on-prem | Per GB per day or workload capacity | 100 GB/day and up | Quote-only |
Datadog | Teams already running Datadog | SaaS only | Per GB ingested, plus per million events indexed | 10 to 100 GB/day | $0.10 per GB ingested |
Elastic Stack (ELK) | Full-text search with DIY control | Self-hosted, Elastic Cloud | Free software, you pay infrastructure | Any, with engineers to run it | Free self-hosted |
Grafana Loki | High-volume logs on Kubernetes | Self-hosted, Grafana Cloud | Free software, or usage on Cloud | 100 GB/day and up | Free; Cloud from $19/month |
Graylog | Self-hosted ops with flat licensing | Self-hosted, Graylog Cloud | Flat annual licence by volume band | 10 to 100 GB/day | Open free; Enterprise from $15,000/year |
SigNoz | OpenTelemetry-native stacks | Self-hosted, Cloud, BYOC | Per GB ingested, with ingest caps | 10 to 100 GB/day | Free; Cloud from $49/month |
ManageEngine Log360 | Compliance and SIEM in the mid-market | On-prem, Log360 Cloud | Per log source, across five meters | Under 250 log sources | From $795/year for 10 sources |
Dynatrace | Enterprise observability with log analytics | SaaS, Dynatrace Managed | Per GiB ingested, retained and queried | 100 GB/day and up | $0.20 per GiB ingested |
The pricing model column filters hardest. A per-gigabyte meter ties your invoice to application behaviour, and that behaviour changes every time someone ships code.
Detailed Overview of the 9 Best Log Management Tools in 2026
Here is a closer look at each one, with the cons included.
1. Motadata ObserveOps
Best for: IT teams that want log management priced by what they watch rather than by what it emits.
Rating: 4.7/5 on G2, 4.6/5 on Gartner Peer Insights.
Pricing: ObserveOps Infinity is one edition that replaced the previous four, so no capability sits behind an upgrade tier. The platform is metered per monitored device, and log monitoring is licensed per log source.
Terms run 1-year, 3-year, or perpetual with ATS, and a quote comes from a completed sizing worksheet.
Log licensing almost always follows volume in this market. ObserveOps Infinity counts sources instead, so if one application suddenly gets chatty, your licence stays where it was.
ManageEngine licenses per source too, so the meter alone does not separate the two. The difference shows up in what the logs sit next to.
An error spike arrives with the host it hit and the network traffic underneath it already attached, which is the work a standalone log tool hands back to you.
Log Explorer is the log analyzer inside that platform, built around incident work rather than reporting. Surrounding Logs earns its place more than a feature list suggests, because reading the lines either side of an error is how most root causes get found.
The observability pipeline is where the cost control happens, and it ships in the base edition. Data it never stores needs no disk underneath it, which is why the hardware footprint came down.
Infinity runs an equivalent deployment on up to 30 to 40 percent less hardware, published as a guide rather than a promise, since it moves with device mix, log retention policy and polling interval.
Server, memory and storage prices climbed worldwide through 2026, and we treated that as an engineering problem to design around rather than a cost to pass on.
Six deployment modes cover the cases SaaS-only tools cannot. A bank or a government agency that cannot legally ship logs offsite needs that range on paper before anything else matters.
Star ratings only tell you so much. Check out what Aarav has to say about Motadata ObserveOps on G2.
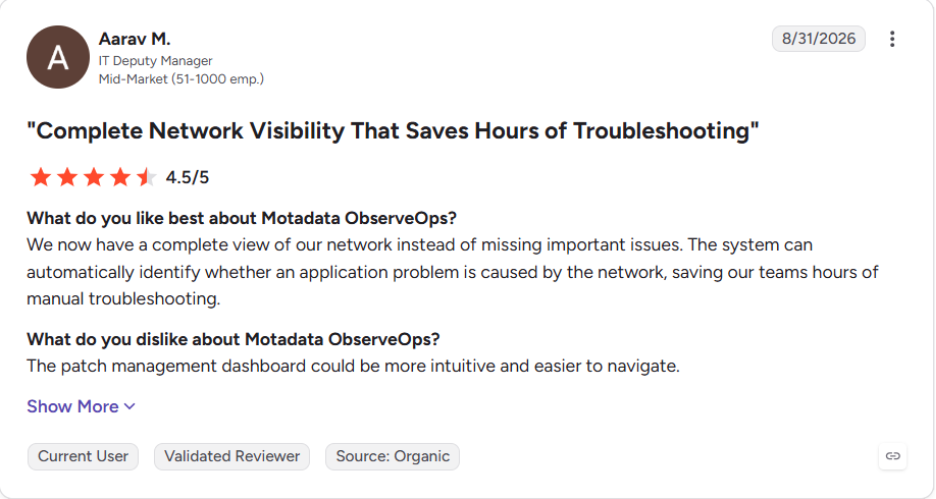
You can read more ObserveOps reviews on G2.
Pros
- Log monitoring is licensed per source, so a noisy application does not move the invoice.
- Logs, metrics, flows and traces share one platform and one data store, which keeps root cause work in a single console.
- The pipeline, the AI and ML policies, automation and security all ship in the base edition, with nothing behind an upgrade wall.
- Retention runs on policy rather than as a line item, so keeping audit logs longer does not need a new purchase.
- Six deployment modes cover air-gapped and regulated estates that SaaS-only tools cannot serve.
Cons
- We publish the licensing model but not the prices, so you cannot size the annual bill from a web page.
- ObserveOps Infinity only reached general availability in August 2026, so its field record is shorter than the incumbents here.
- The agentic capabilities on the roadmap, including autonomous investigation and guided fixes, are releasing soon rather than shipping today.
- A team that wants a lightweight log shipper is buying far more platform than it needs.
- Our published review count is smaller than Splunk's or Datadog's, so there is less peer feedback to read.
2. Splunk
Best for: Large enterprises and security teams with mixed machine data and the budget to match.
Rating: 4.3/5 on G2, 4.3/5 on Gartner Peer Insights.
Pricing: Usage-based, charged either per GB per day ingested or by workload capacity. Quote-only, with no public list price.
Splunk has been doing this longer than almost anyone here. It reads schema on the fly, so it takes nearly any log format you point at it, and SPL slices and correlates data in ways most rivals cannot match.
Splunk IT Service Intelligence adds machine learning for event correlation on top.
Cost stops more Splunk deals than any capability gap does, which is why the market for Splunk alternatives is as crowded as it is.
Ingest-based pricing means the bill follows your data growth, and quote-only pricing makes it hard to model before you commit.
SPL and day-to-day administration both take real expertise, so budget for a ramp-up period before anyone on the team is fast with it.
Pros
- Search and analytics stay fast and flexible across very large, mixed datasets.
- The security content and app ecosystem is deeper than anything else on this list.
- Deployment options cover regulated estates that need on-premises installation.
Cons
- Cost grows with ingest volume and is hard to forecast a year ahead.
- SPL and platform administration carry a steep learning curve.
- Quote-only pricing means you cannot compare it against a rate card without a sales call.
3. Datadog
Best for: Cloud-native teams that already run Datadog for metrics and traces.
Rating: 4.4/5 on G2, 4.5/5 on Gartner Peer Insights.
Pricing: $0.10 per GB ingested, plus $1.70 per million log events indexed with 15-day retention. Flex Logs storage is priced separately.
Datadog's log product sits inside its wider observability suite, and that is the real draw. One click takes you from a log line to the trace or metric beside it, with no context switch.
Logging without Limits gives you the main cost lever here. You ingest everything cheaply at $0.10 per GB, then pay to index only the logs you plan to search. Used well, it keeps the bill sane. Left on defaults, indexing is where the money goes.
Two structural limits show up as you scale. Ingest, indexing and retention are separate meters that each grow as you scale, which is the pattern behind most Datadog pricing complaints. There is also no on-premises option, so data-sovereignty rules rule it out entirely.
Pros
- Correlation across logs, metrics and traces is the smoothest here for cloud-hosted workloads.
- Search needs no special query language, so a new engineer is productive quickly.
- Separating ingest from indexing gives you a genuine cost lever.
Cons
- Ingest, index and retention bill separately, which makes the annual number hard to hold steady.
- SaaS only, with no self-hosted or on-premises option for regulated data.
- Costs climb quickly once log volume grows past the plan you sized for.
4. Elastic Stack (ELK)
Best for: Teams that want the strongest full-text log search and have engineers to run it.
Rating: 4.5/5 on G2, 4.5/5 on Gartner Peer Insights.
Pricing: Free self-hosted, where you pay for infrastructure and operations. Elastic Cloud starts around $16 per month for a small instance and rises with scale.
ELK bundles three tools. Elasticsearch stores and searches, Logstash moves and reshapes the data, and Kibana builds the dashboards. Run together, they deliver full-text search that few open-source options can match.
Index lifecycle management earns its keep once volume grows. Data moves down through hot, warm, cold and frozen tiers automatically, which keeps storage costs in proportion to how often you actually query the data.
You pay for that flexibility in upkeep. Past a handful of nodes, shard counts, cluster sizing and JVM heap tuning become somebody's job.
Licensing needs attention too, because the stack now spans AGPLv3, SSPL and Elastic's own licence, and which terms apply depends on the features you turn on.
Pros
- Full-text search quality is the best available without paying enterprise licence fees.
- The same stack covers logs, metrics, traces and security use cases.
- Documentation and community coverage exist for almost any scenario you hit.
Cons
- Self-hosting is a real operational job once you pass a few nodes.
- Indexing everything consumes storage fast, so infrastructure cost climbs with volume.
- The licensing split across three licences is confusing to audit.
5. Grafana Loki
Best for: Kubernetes teams already running Grafana and Prometheus that need cheap storage at volume.
Rating: 4.5/5 on G2, 4.6/5 on Gartner Peer Insights.
Pricing: Free self-hosted under AGPLv3. Grafana Cloud is free to 50 GB per month, and the Pro plan starts at $19 per month plus usage.
Loki was built on one contrarian decision. It indexes a small set of labels per log stream and never indexes the log content itself, which is why its storage stays cheap at volumes that would make Elasticsearch expensive.
Log data lands in object storage such as S3, and Grafana lines it up against Prometheus metrics and Tempo traces. On Kubernetes it is light to deploy and quick to get value from.
That decision costs you in two places. Feed Loki high-cardinality labels and query performance degrades sharply. Because it never indexes content, a broad text search across several weeks of data scans rather than looks up, so it can crawl.
Its best value also assumes you already live in the Grafana ecosystem, which is what sends teams looking at Grafana alternatives in the first place.
Pros
- Storage cost per GB is the lowest here once volume gets large.
- Deployment on Kubernetes is lightweight and well documented.
- Correlation with Prometheus metrics is native rather than bolted on.
Cons
- High-cardinality labels degrade performance, and the failure mode is not obvious upfront.
- Broad ad-hoc text search across weeks of data is slow by design.
- Most of the value assumes you already run Grafana and Prometheus.
6. Graylog
Best for: IT ops and security teams that self-host and want a flat licence instead of a per-gigabyte meter.
Rating: 4.4/5 on G2, 4.5/5 on Gartner Peer Insights.
Pricing: Graylog Open is free under SSPL. Enterprise starts at $15,000 per year and Security at $18,000 per year, both quote-based.
Graylog takes in syslog, Windows Events, Kubernetes and cloud logs out of the box, then uses Streams and pipeline rules to route and enrich them in real time. The free Open edition is genuinely usable in production, which is rare at this price.
Licensing pulls most teams in. It stays flat and volume-banded rather than metering every gigabyte, so a traffic spike does not arrive as an invoice.
Standing Graylog up takes more work than running it. The self-managed version runs on OpenSearch and MongoDB underneath, and keeping that pair healthy at scale is a real job.
Event correlation, archiving and the security tooling all sit in the paid tiers, so the Open edition takes you only so far.
Pros
- Flat licensing keeps a lid on the runaway per-gigabyte costs elsewhere on this list.
- The free Open edition is production-grade for straightforward log management.
- Pipeline processing is powerful once it is configured properly.
Cons
- Running OpenSearch and MongoDB underneath adds real operational work.
- Retention and index rotation take trial and error to get right.
- Correlation, archiving and security features sit behind the paid tiers.
7. SigNoz
Best for: Teams standardising on OpenTelemetry that want logs, metrics and traces in one open-source-leaning platform.
Rating: 4.6/5 on G2, not rated on Gartner Peer Insights yet.
Pricing: Community edition free and self-hosted. SigNoz Cloud starts at $49 per month including $49 of usage, with logs at $0.30 per GB ingested and 15-day retention. Enterprise starts at $4,000 per month.
SigNoz is built around OpenTelemetry rather than adapted to it, which shows in how little translation work you do to get data in. If your stack already emits OTLP, ingestion is close to configuration-only.
Cost behaves well here for two reasons. Pricing is a flat rate per GB with no separate indexing meter, and you can set hard ingestion limits so a runaway service cannot produce a surprise invoice.
Seats are unlimited on every plan, which removes the per-user charge that inflates bills on New Relic and Dynatrace.
SigNoz falls short on maturity and on the jump between tiers. The ecosystem is smaller than Elastic's or Splunk's, so you will write integrations that already exist elsewhere.
Pricing also leaps from $49 per month on Teams to $4,000 per month on Enterprise, and data residency, fine-grained access control and audit logs sit on the far side of that gap.
Pros
- Predictable per-GB pricing with caps you set yourself.
- No per-seat charges, so cost does not grow with team size.
- OpenTelemetry-first design means no vendor-specific instrumentation to unpick later.
Cons
- The integration and community ecosystem is smaller than the incumbents here.
- The gap between the $49 Teams plan and the $4,000 Enterprise plan is steep with nothing between
- Compliance features such as data residency and audit logs require the Enterprise tier.
8. ManageEngine Log360
Best for: Mid-market teams that need compliance reporting and threat detection alongside log management.
Rating: 4.3/5 on G2, 4.5/5 on Gartner Peer Insights.
Pricing: Licensed per log source. Ten sources start at $795 per year, 50 at $3,795, and 250 at $13,995. Perpetual licences are roughly three times the annual figure.
Log360 is a SIEM suite whose log engine is EventLog Analyzer, so it leans further toward security than most tools here.
Compliance templates for PCI DSS, HIPAA and GDPR ship ready to run, which is the main reason mid-market teams shortlist it. The SIEM vs log management distinction decides whether that suits you or overshoots what you need.
Licensing per log source rather than per gigabyte is genuinely useful, and it is the same principle ObserveOps uses. The catch is that log sources are only one of five meters.
Domain controllers, Windows file servers, cloud accounts and endpoints are each licensed separately on their own scale, so the quoted per-source price is never the whole bill. A mid-sized estate can easily buy four of the five.
Coverage is the other thing to check before you shortlist it. Log360 handles Windows and Active Directory estates very well, then thins out across Linux, containers and cloud-native workloads.
If your estate is mostly Linux or containerised, that gap will decide the evaluation for you.
Pros
- Compliance reporting is ready on day one rather than a build project.
- Per-source licensing keeps costs steady when log volume grows.
- Entry pricing is low for a tool carrying SIEM capability.
Cons
- Five separate meters mean the real bill is well above the headline per-source price.
- Coverage is strongest on Windows and Active Directory, and thinner on containers and cloud-native workloads.
- The interface carries a lot of history and takes longer to learn than newer tools.
9. Dynatrace
Best for: Large enterprises that want log analytics inside a full observability platform.
Rating: 4.5/5 on G2, 4.6/5 on Gartner Peer Insights.
Pricing: $0.20 per GiB ingested, plus retention at $0.0007 per GiB-day on Pay-per-Query or $0.02 per GiB-day with queries included. Queries cost $0.0035 per GiB scanned on the Pay-per-Query plan.
Dynatrace stores logs in Grail, its data lakehouse, which keeps them queryable alongside metrics, traces and topology without a separate index. Davis, its AI engine, then works across all of it, so a log anomaly arrives already tied to the service and the deployment that caused it.
Pricing is transparent in the sense that every rate is published, and complicated in the sense that logs bill on three meters at once. Ingest, retention and query each have their own rate, and the two retention plans suit very different query patterns.
Working out which plan is cheaper for your query pattern takes real modelling, and it is the hardest part of Dynatrace pricing to get right.
One line on the rate card deserves attention before you sign. Data egress bills at $0.15 per GiB, so moving your own log data out of Dynatrace costs almost as much as putting it in. That is worth modelling at the start of a contract rather than the end of one.
Pros
- Root cause analysis is the most automated here, with less manual correlation work.
- Every price is published, so you can model a bill without a sales call.
- Grail removes the index sizing and tuning work that Elasticsearch demands.
Cons
- Three separate log meters make the total hard to forecast.
- Data egress at $0.15 per GiB makes leaving expensive, which is a lock-in risk worth pricing early.
- The platform is more than a mid-sized team needs, and it prices accordingly
What Changed in Log Management for 2026
The volume side of log management changed faster than the pricing side, and that gap is what buyers are now managing around.
Telemetry data is growing at roughly 29 percent a year, according to IDC figures cited by Cribl. At that rate a log estate roughly doubles every three years while the per-gigabyte rate stays exactly where it is.
Compounding growth against a flat rate is what moved cost control from a nice-to-have into the deciding factor. Three consequences follow if you run logs at any real volume.
Filtering moved upstream: Dropping, sampling or routing data before it reaches the index is now the largest cost lever you have, because everything indexed is something you pay to keep.
Retention became a per-source policy: A firewall log kept for an auditor and a debug log kept for one sprint have nothing in common, and a single global retention setting forces you to overpay for one or undershoot the other.
The meter started mattering more than the rate: A low per-gigabyte price on a metric you do not control beats a higher price on one you do, right up until your traffic doubles.
Test this in a trial rather than reading it off a feature page. Load a month of your real logs, then double the volume and see what the tool projects. A per-gigabyte quote based on today's data tells you very little about year three.
What Should You Look for in a Log Management Tool?
Five checks settle most log management evaluations. Run them during a trial, because a feature page answers none of them honestly.
Price your real volume, then double it: Take last month's actual gigabytes per day and model the annual bill at that number and at twice that number. The gap between the two is the number that matters.
Test search on your worst query: Run a broad text search across three weeks of data, not a filtered lookup on an indexed field. That is the query you will run at 3 a.m., and it is where label-only indexing shows its cost.
Check retention granularity: Confirm you can set different retention by source, severity or tier. One global setting means paying audit-grade retention prices on debug logs.
Confirm what leaving costs: Ask for the egress rate and the export path in writing. Some vendors meter data on the way out, and that number belongs in your evaluation rather than your renewal.
Watch it during an alert storm: Feature demos run on clean data. Ask to see the tool handle a burst, because ingestion lag and query timeouts only appear under load.
Deprioritise the dashboard while you compare these tools. Every one of them demos well, and screenshots are the least reliable part of any evaluation.
How a tool behaves when a service starts emitting ten times its normal log volume tells you far more.
Which Log Management Tool Is Right for Your Team?
Most teams land in one of five situations. The table below maps each to a starting point.
Your Situation | Start With | Why |
You already monitor network and servers and want logs in the same console | Motadata ObserveOps | Per-source licensing and native log, metric and flow correlation on one platform |
Security forensics and compliance drive the purchase at enterprise scale | Splunk | Unmatched search depth and the widest security content library |
You run Kubernetes at high volume and already use Grafana | Grafana Loki | Label-only indexing keeps storage cheap where full-text indexing gets expensive |
You have engineering time, no licence budget, and need real text search | Elastic Stack | Full-text search quality without licence fees, in exchange for running the cluster |
Compliance reporting matters more than scale, on a Windows estate | ManageEngine Log360 | Audit-ready templates and per-source pricing suited to mid-market environments |
If two rows describe you, run both trials against the same month of data. Paper comparisons flatter whichever vendor writes better documentation, and they say nothing about how a tool behaves on your logs.
The first two rows are the real fork: a dedicated log platform, or a unified observability platform that carries logs alongside every other signal.
Pick the Best Log Management Tool for Your Business
Choosing the best log management tool comes down to one question that has nothing to do with features. Which number on the invoice grows when your systems get busier?
If it is gigabytes ingested, your bill is tied to how noisy your applications are, and that is the variable your team controls least.
No product wins both ways. A per-gigabyte platform buys you polish and ecosystem depth that a source-counted licence does not, and for some teams that trade is worth making.
ObserveOps Infinity is built for the other case, where a forecastable bill and on-premises deployment matter more than ecosystem size.
What a broader set of log management practices buys instead is a bill you can forecast three years out, and a shorter path from a log line to the cause underneath it. In our experience, that is where the hours and the budget actually go.
FAQs
What are the best tools for log monitoring?
Log monitoring watches logs in real time and alerts on patterns, which most tools here do. Motadata ObserveOps, Datadog and Dynatrace suit teams wanting monitoring tied to metrics and traces. Splunk and ManageEngine Log360 fit security-led monitoring better.
Which AI tool is best for log analysis?
Different tools lead on different parts of log analysis. Dynatrace Davis leads on automated root cause, Splunk ITSI on event correlation at enterprise scale, and Elastic on anomaly detection in open source. Motadata ObserveOps applies anomaly detection and correlation across logs, metrics and flows together.
What is the best database for storing logs?
The best database for logs depends on your query pattern. Elasticsearch suits full-text search, ClickHouse suits fast analytical queries over structured logs, and object storage such as S3 suits cheap long-term retention. Most platforms here pick one and hide it behind their own interface.
Are open source log management tools enough for enterprise?
Open source log management tools can be enough, if you staff them. Elastic Stack, Graylog Open and Grafana Loki all run production workloads at scale. The licence is free while the operations, tuning and upgrades become a real job that rarely gets costed properly.
Is Motadata ObserveOps better than Splunk for log management?
Neither wins outright, and scope decides it. Splunk goes deeper on security forensics and has a larger app ecosystem. ObserveOps Infinity fits better when logs are one signal among metrics and flows, and when per-source licensing beats paying for every gigabyte your systems emit.
Author
Ramya Shah
Technical Writer
Ramya Shah is a technical content writer with a computer engineering background and roots in automotive journalism. He covers IT Service Management, observability, IT operations, and AI-driven automation. An early adopter of AI-assisted writing workflows, he turns complex IT processes into clear, engaging content optimized for search and answer engines (AEO), lifting content output and organic visibility.