9 Best Log Aggregation Tools for 2026
Every on-call engineer has lost an evening to some version of this. Something breaks; the fix is usually somewhere in the logs, and the logs are scattered everywhere: a dozen servers, a few containers, a couple of cloud services, none of them in one place.
So, you SSH into one box, grep, get nothing, move to the next, and an hour later there are fifteen terminal tabs open and still no clear sequence of events.
Log aggregation tools kill that scramble. They pull every log into one searchable place, and that matters more each year because the volume only keeps growing.
The pile is only getting bigger. In Komprise’s 2026 State of Unstructured Data Management Report, 74% of organizations reported managing more than 5 PB of unstructured data, up 57% from the previous year, while 40% said they were already storing at least 10 PB.
Here is what this guide covers:
We compare the top log aggregation tools worth your shortlist in 2026, including Motadata ObserveOps, Splunk, Datadog, and Grafana Loki.
A side-by-side table compares the tools across deployment, open-source status, correlation, and starting price.
Every tool gets honest pros and cons, ObserveOps included.
You will see which features to check before you buy, from ingestion speed to retention cost.
A decision guide matches your environment to the right type of tool.
By the end, you will have a shortlist you can take into a trial.
What Is Log Aggregation?
Log aggregation is the process of collecting logs from many sources and pulling them into one central, searchable place.
Picture the raw output from your servers, apps, network gear, and cloud services all landing somewhere a human can query it, instead of sitting on ten separate machines.
You will see the same idea sold under several names. A log aggregator, a log aggregation tool, a centralized logging platform, and log consolidation software all describe the same core job, and vendors pick whichever label fits their positioning. You will typically see these steps. Collect the logs, parse and apply log normalization so they share one format, index them, then layer search and alerts on top. That is the whole foundation.
Whatever comes next, chasing an outage or proving compliance to an auditor, only works if this first step is solid.
Log Aggregation vs Log Management
Log aggregation is one stage inside log management, not a product category of its own. Aggregation gets your logs into one place and makes them searchable, while log management is the wider job layered on top: parsing, indexing, alerting, retention policy, and analysis.
That difference matters when you compare vendors. Almost every product on this list does both, so a tool calling itself a log aggregator rather than a log management platform is usually telling you about its scope, not its ceiling.
How Does Log Aggregation Work?
Log aggregation runs as a pipeline, and every tool on this list works through the same five stages in its own way. Knowing the stages is what lets you compare two products that describe themselves in completely different language.
1. Collection
Collection is the stage where agents, collectors, or forwarders pick up log data at its source and move it toward a central system. Some tools push from a lightweight agent installed on each host. Others pull over syslog, an API, or a cloud log stream, which matters when you cannot install anything on a device. How a tool handles log ingestion at this stage decides how much work every new source costs you later.
2. Parsing and Normalization
Parsing splits each raw log line into named fields, and normalization maps those fields onto one shared schema. A Windows event and an Nginx access log have almost nothing in common until this runs. Get it right and you can query both in a single search. Get it wrong and you inherit a growing pile of custom parser rules that break every time a vendor changes a format.
3. Enrichment
Enrichment adds context to a log line while the data is still moving, before anything gets stored. Typical additions are the hostname, the environment, the owning team, a geo lookup on an IP address, or a severity tag. Log enrichment pays off during an incident, when you can filter to one team's production hosts without joining three data sources by hand.
4. Indexing and Storage
Indexing is what makes an aggregated log searchable, and it is also where most of your bill comes from. Every field you index costs storage, so tools differ sharply on how much they index by default. Most platforms tier the result, keeping recent data hot and fast while older data drops to cheaper, slower storage.
5. Forwarding and Routing
Aggregation rarely ends at one destination. Compliance data may need to reach an archive, security events may need to reach a SIEM, and a subset may need to land in one team's own dashboard. Log forwarding is what sends data onward, while routing is the separate decision about which destination receives which slice of it.
Those five stages are also the fault lines between products. Two tools can both call themselves log aggregators and still behave completely differently at stage three or stage five.
How We Evaluated These Tools
We scored every tool against the same seven evaluation axes: architecture, parsing and normalization, filtering, retention, forwarding, operating model, and integration fit. Each entry also weighs pricing transparency and the limitations real users report, because none of these tools are perfect.
The hard numbers come from product documentation, public pricing pages, and current G2 and Gartner Peer Insights ratings. Some vendors will not quote a price without a sales call, and where that is the case we say so rather than make one up.
The 9 Best Log Aggregation Tools Compared
Here is a quick overview of the top log aggregation tools before we compare each one in detail.
Tool | Best For | Deployment | Open Source | Correlation | Starting Price (2026) |
1. Motadata ObserveOps | Unified log, metric, and flow correlation for hybrid and on-prem IT ops | SaaS, on-prem, cloud (6 modes incl. HA/DR) | No | Yes: anomaly detection, log and flow correlation | Quote-based |
2. Splunk | Enterprise-scale search and security analytics | SaaS, self-hosted, on-prem | No | Yes: ITSI ML event correlation | Quote-only (usage-based) |
3. Datadog | Cloud-native teams wanting logs, metrics, and traces in one SaaS | SaaS only | No | Yes: Watchdog anomaly detection | $0.10/GB ingest + $1.70 per million events indexed |
4. Elastic Stack (ELK) | Powerful full-text search with DIY control | Self-hosted, on-prem, Elastic Cloud | Partial (AGPLv3 / SSPL / ELv2) | Yes: built-in ML anomaly detection | Free self-hosted; Cloud from ~$16/mo |
5. Grafana Loki | Cost-efficient high-volume logs for Grafana and Kubernetes users | Self-hosted, Grafana Cloud | Yes (AGPLv3) | Partial: correlates in Grafana; no core full-text ML | Free self-hosted; Cloud free to 50 GB/mo, Pro from $19/mo |
6. Graylog | Self-hostable log management with predictable licensing | Self-hosted, on-prem, Graylog Cloud | Yes (Open edition, SSPL) | Partial: correlation engine on paid tiers | Open free; Enterprise from $15,000/yr |
7. Sumo Logic | Managed SaaS unifying logs, SIEM, and observability | SaaS only | No | Yes: LogReduce ML, SIEM correlation | Free tier; Essentials ~$108/mo |
8. New Relic | Logs in context with APM and traces | SaaS only | No | Yes: logs in context, AIOps correlation | Free to 100 GB/mo + 1 user; then $0.40/GB |
9. SolarWinds Loggly | Affordable, quick cloud log search for smaller teams | SaaS only | No | Limited: anomaly detection on Enterprise tier only | Free Lite; Standard $79/mo |
All prices are current as of mid-2026. Ratings come from G2 and Gartner Peer Insights. Now, let’s check these tools in detail.
Detailed Overview of the 9 Best Log Aggregation Tools in 2026
Here is a closer look at each of the top log aggregation tools, what it does well, and where it hurts.
1. Motadata ObserveOps
Best for: Enterprise and NOC teams that want their log aggregation wired to metrics and network flows in one platform, especially across hybrid or on-prem estates.
Rating: G2 4.7/5, Gartner Peer Insights 4.6/5
With ObserveOps, you don't buy logs as a product on their own. They sit inside a broader observability platform, right next to the metrics and flows they relate to.
The Log Explorer parses millions of lines with parsers that come built in, and Live Tail streams them past you as they land, like tail -f, but across every source at once.
However, Triangulation is the capability that earns its keep.
ObserveOps lines logs up with metrics and flow data, so a single error spike shows you the host it hit, the interface it crossed, and the traffic pattern underneath, all in the same place.
Without it, a root-cause hunt across a hybrid estate is really three investigations into three tools, run by hand while the outage drags on and MTTR climbs.
Deployment is the other place it separates from the SaaS-only crowd. Run it on your own hardware, in a private or public cloud, or in high-availability and disaster-recovery configurations.
For a bank or a government agency that legally cannot ship logs to someone else's cloud, that flexibility is the entire reason to shortlist it.
Don’t take our word for it; check out this review from one of our many satisfied customers on G2:
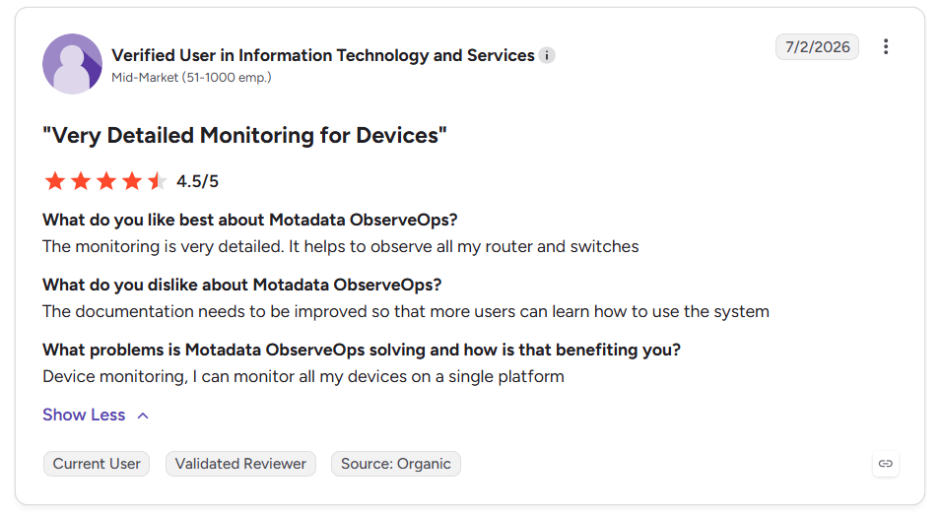
Check out more G2 reviews here.
Motadata reports customers cut MTTR by as much as 80 percent after they stop jumping between separate log, metric, and flow tools.
Pros
- Logs, metrics, and flows correlate natively, so a root cause spans all three instead of dead-ending at the log
- OpenTelemetry-native ingestion, plus more than 100 integrations that work out of the box
- Six deployment modes, on-prem, HA, and DR among them, which suits regulated and hybrid teams
- Anomaly detection and alert correlation ship inside the platform, so the AI is never a separate line item
Cons
- As a full observability platform, it is more tool than a team wanting only a lightweight log shipper would need.
- Pricing is quote-based, so there is no public per-GB number to line up against the SaaS tools.
- It carries fewer published reviews than Splunk or Datadog, which leaves less peer feedback to sift through.
Pricing: Quote-based. Contact sales for a figure tied to your data volume and deployment mode.
2. Splunk
Best for: Big enterprises and security teams sitting on massive, mixed machine data, with the budget to pay a premium for scale and maturity.
Rating: G2 4.3/5, Gartner Peer Insights 4.4/5
Splunk has been at this longer than almost anyone else. Because it reads schema on the fly, it swallows nearly any format you throw at it, and SPL, its search language, slices and correlates logs in ways most rivals can't touch.
Add Splunk IT Service Intelligence on top and you get machine learning for event correlation and anomaly detection.
All that power carries a price, in both senses of the word. Splunk charges on data volume or compute capacity, and that bill has a habit of outrunning the data itself.
SPL and day-to-day admin take real expertise too, so plan for a ramp-up before anyone on the team is fast with it.
Pros
- Search and analytics that stay fast and flexible across huge, messy datasets
- A track record at enterprise scale, backed by a deep integration ecosystem
- Deployment your way, whether that is SaaS, self-hosted, or on-prem
Cons
- High and often unpredictable cost that grows with ingest volume
- Steep learning curve for SPL and administration
- Pricing is quote-only, which makes planning and comparison hard
Pricing: Usage-based (ingest per GB per day or workload capacity). Quote-only, with no public list price.
3. Datadog
Best for: Cloud-native DevOps teams that want their logs tied to metrics, traces, and APM in a single SaaS platform.
Rating: G2 4.4/5, Gartner Peer Insights 4.6/5
Datadog's log tool sits inside its larger observability suite, and that's the real pull. From a log line, one click drops you onto the trace or metric right beside it.
The clever bit is Logging without Limits. Ingest everything, then pay to index only the logs you actually care about.
The loudest complaint is the bill. Pricing breaks into ingestion, indexing, and retention lines, and each one grows as you scale up.
There's no on-prem option either, which quietly rules Datadog out for anyone bound by data-sovereignty rules.
Pros
- Smooth correlation across logs, metrics, and traces in one UI
- Fast setup and easy search with no special query language
- Ingest-versus-index model gives some cost control
Cons
- Costs escalate quickly and are hard to forecast
- Layered pricing across ingest, index, and retention adds complexity
- SaaS-only, with no self-hosted or on-prem option
Pricing: $0.10 per GB ingested, plus $1.70 per million log events indexed (15-day retention). Flex Storage is priced separately.
4. Elastic Stack (ELK)
Best for: Teams that want the strongest full-text log search and full DIY control, and have the engineers to run and tune it.
Rating: G2 4.5/5, Gartner Peer Insights 4.5/5
ELK is a bundle of three tools: Elasticsearch handles storage and search, Logstash moves and reshapes the data, and Kibana builds the dashboards. Run them together as a pipeline to get open-source log management with genuinely strong full-text search.
Older data can move down through hot, warm, cold, and frozen tiers using index lifecycle management, which keeps storage costs sane, and the built-in ML handles anomaly detection.
The price of all that flexibility is upkeep. Past a handful of nodes, cluster sizing, shard counts, and JVM heap tuning become your problem, and indexing everything burns through disk quickly.
The licensing needs attention too. The core now spans AGPLv3, SSPL, and Elastic's own license, and which terms bind you come down to which features you turn on.
Pros
- Full-text search and querying that few open-source tools can match
- A mature ecosystem with broad integrations and documentation for almost any scenario
- The same stack covers logs, metrics, traces, and security
Cons
- Self-hosting is a real operational load once you pass a few nodes
- It eats storage, so infrastructure costs climb right along with volume
- Licensing is a maze, and managed Elastic Cloud gets pricey for production clusters
Pricing: Free self-hosted (you pay for infrastructure and operations). Elastic Cloud starts around $16 per month for a small instance, and rises with scale.
5. Grafana Loki
Best for: Cloud-native and Kubernetes teams already on Grafana and Prometheus that want cost-efficient, high-volume log storage.
Rating: G2 4.5/5, Gartner Peer Insights 4.5/5
Loki was built on a contrarian idea: index only a handful of labels per log stream, never the full content. That single choice is why its storage stays cheap.
It parks data in object storage like S3 and lines logs up against metrics and traces inside Grafana. On Kubernetes, it is light and quick to slot in.
The design cuts both ways. Feed it high-cardinality labels and performance drops, and because Loki never indexes the log content, a broad text search across weeks of data can crawl. Its best value also assumes you already live in the Grafana and Prometheus world.
Pros
- Very cost-effective and storage-efficient at high volume
- Lightweight and Kubernetes-friendly to deploy
- Tight correlation with metrics and traces inside Grafana
Cons
- Struggles with high-cardinality labels, which can hurt performance
- No full-text indexing, so broad ad-hoc text searches can be slow
- Best value assumes you already run Grafana and Prometheus
Pricing: Free self-hosted. Grafana Cloud is free to 50 GB per month, and the Pro plan starts at $19 per month plus usage.
6. Graylog
Best for: IT ops and security teams that want to self-host their log management and pay a flat, volume-based license instead of getting metered per gigabyte.
Rating: G2 4.4/5, Gartner Peer Insights 4.5/5
Graylog comes in three flavors: a free Open edition, plus paid Enterprise and Security tiers. Out of the box it takes in syslog, Windows Events, Kubernetes, and cloud logs, and its Streams and pipeline rules route and enrich all of it in real time.
What pulls teams in is the licensing, which stays flat and volume-based rather than charging you by the gigabyte you ingest.
Getting it stood up is the harder part. The self-managed version leans on OpenSearch and MongoDB underneath, and running that pair reliably at scale is a real job in itself.
The deeper features such as event correlation, archiving, and security tooling, all sit in the paid tiers, so the free Open edition takes you only so far before you upgrade.
Pros
- Flat licensing that keeps a lid on runaway per-GB costs
- A free Open edition that is genuinely usable for production log management
- Strong Streams and pipeline processing once you have it dialed in
Cons
- Setup and scaling get complex on the OpenSearch and MongoDB stack underneath
- Retention and index rotation can be finicky to get right
- Event correlation, archiving, and security sit behind the paid tiers
Pricing: Graylog Open is free. Enterprise starts at $15,000 per year and Security at $18,000 per year, both quote-based.
7. Sumo Logic
Best for: Cloud-native and enterprise teams that want a fully managed SaaS unifying log analytics, SIEM, and observability with no infrastructure to run.
Rating: G2 4.3/5, Gartner Peer Insights 4.2/5
Sumo Logic is cloud-native and multi-tenant, so there is nothing for you to host. Its LogReduce and LogCompare models dig patterns and anomalies out of noisy log data.
And it has tiered storage that lets you park low-priority logs on the cheap. Security teams get Cloud SIEM and SOAR sitting on the same platform.
Two gripes surface again and again: cost and query syntax. The credit-based pricing climbs fast with data and is hard to forecast, and the query language takes a while to click. On very large datasets, even the real-time views can lag.
Pros
- Fully managed, with no infrastructure to scale
- Continuous, Frequent, and Infrequent tiers give real control over what long-term data costs
- Unifies log analytics, SIEM, and observability in one platform
Cons
- Expensive as data grows, with a credit model that is hard to forecast
- Query syntax has a steep learning curve
- UI and real-time performance can lag on large datasets
Pricing: Free tier available. Essentials starts around $108 per month, with credit-based Enterprise and scan-time Flex pricing above that.
8. New Relic
Best for: Engineering and IT ops teams that would rather see logs alongside APM, infrastructure, and traces than run a standalone log tool.
Rating: G2 4.4/5, Gartner Peer Insights 4.6/5
New Relic keeps log management inside its wider observability platform, and the selling point is logs-in-context.
Click on a single log line, and you land on the trace, metric, host, or APM error tied to it. The free tier is unusually generous too. It gives you 100 GB of ingest every month, plus one full user.
Past that free tier, the numbers get slippery. Billing runs on usage, so a heavy month of logs can spike the invoice with little warning.
Full-platform seats pile on more cost, and if your log lines run long, New Relic clips them at roughly 4,094 characters.
Pros
- Deep correlation with APM, infrastructure, and traces
- Generous free tier to start with
- Powerful querying across all telemetry with NRQL
Cons
- Usage-based bills can spike unpredictably with log volume
- Full-platform user seats get costly for larger teams
- Log fields are truncated at about 4,094 characters, and NRQL has a learning curve
Pricing: Free to 100 GB per month plus one user. Beyond that, $0.40 per GB ingested (or $0.60 for Data Plus), plus per-user fees.
9. SolarWinds Loggly
Best for: Small and mid-sized teams after an affordable cloud log search tool they can stand up fast, with flat-tier pricing they can predict.
Rating: G2 4.3/5, Gartner Peer Insights 4.3/5
Loggly runs in the cloud with no agents to deploy, so you are up and running fast. The UI takes minutes to figure out, and Dynamic Field Explorer plus Gamut Search make digging through logs painless. For a smaller team, the flat tiers with unlimited users add up to a fair deal.
The ceiling arrives as you scale. Anomaly detection, custom retention, and unlimited source groups are all locked to the Enterprise tier, and high-volume teams bump into the caps.
The product also feels like it is in maintenance mode now, since SolarWinds keeps steering new buyers toward its wider Observability suite.
Pros
- Fast, low-friction setup with an intuitive UI
- Predictable flat-tier pricing with unlimited users
- Effective search and field parsing for troubleshooting
Cons
- Anomaly detection and custom retention are gated to the Enterprise tier
- Heavier-volume teams outgrow the retention and volume caps
- Effectively in maintenance mode, and not a true correlation platform on its own
Pricing: Free Lite plan (200 MB per day). Standard is $79 per month, Pro $159, and Enterprise $279, billed annually.
What Should You Look for in a Log Aggregation Tool?
Seven questions decide whether a log aggregation tool survives its first year. Work through them in order, because the early answers narrow the later ones. Here is the framework in short before we take each one apart.
Evaluation Axis | What to Check | Red Flag |
1. Architecture and Ingest Speed | Whether logs are indexed in full or by label, whether collection is agent-based or agentless, and where the data physically lands. | A design that only performs on one shape of workload, such as label-only indexing when you need broad text search. |
2. Parser Coverage | How many formats parse out of the box, and what building a custom parser actually costs you. | Every new source needs a support ticket or a professional services engagement. |
3. Filtering Before Indexing | What you can drop, sample, or reroute before the data reaches the index. | Filtering only exists after indexing, so you pay to store data you never wanted. |
4. Retention Control | Whether retention can differ by source, severity, or storage tier. | One retention period across every log, either too short for audit or too costly for noise. |
5. Routing and Data Portability | Whether a subset can travel onward to an archive, a SIEM, or another team's stack. | Data can only leave through a manual export job. |
6. Operating Model | Who runs it: a managed SaaS, your own team, or a hybrid split between the two. | The only deployment on offer is the one your compliance team will not sign. |
7. Integration Fit | Native coverage for the systems you already run, plus open standards such as syslog and OpenTelemetry. | Integration counts are high but the specific systems you run are not on the list. |
1. Architecture and Ingest Speed
Architecture comes first because it constrains every answer after it. Some platforms index the full text of every log. That makes search fast and storage expensive. Others index a small set of labels and scan the rest at query time. This one choice explains most of the price gaps between these tools, because log indexing is what you are really paying for.
Ingest speed belongs in the same question. A log that takes ten minutes to become searchable is useless during an incident. Check whether live tail and near-real-time search are standard, or a premium tier.
2. Parser Coverage
Parser coverage decides whether your logs can be read together or only side by side. Count the parsers a tool ships for the systems you actually run, then ask what a custom one costs in engineering hours. Weak log parsing shows up later as a schema nobody trusts. A vendor that answers with a services quote has told you what the next two years look like.
3. Filtering Before Indexing
Filtering before indexing is the axis most buyers skip, and it is where log bills are won or lost. Ask what a tool lets you drop, sample, or reroute before data hits the index. Everything indexed is something you pay to keep. Handling that upstream is the job of an observability pipeline, which sits between your sources and your storage. The filtering decision then gets made once, instead of in nine separate agent configs.
4. Retention Control
Retention control is a policy question, and most tools answer it with a single global setting. A firewall log kept for an auditor and a debug log kept for one sprint have nothing in common. Ask whether log retention can vary by source, by severity, or by tier. A tool that forces one period across everything makes you pick between an audit gap and a storage bill.
5. Routing and Data Portability
Routing and data portability decide whether your log platform can live alongside the rest of your stack. Check whether a slice of data can leave for an archive, a SIEM, or another team's tooling without an export job and a script. Vendor lock-in usually shows up here first, well before it shows up in the contract.
6. Operating Model
The operating model is the question of who actually runs the system. A managed SaaS trades control for somebody else's on-call rota. A self-hosted stack gives you full control and a real operations job, because a cluster of OpenSearch or Elasticsearch nodes needs tuning, capacity planning, and upgrades.
A hybrid split sits between them, with collection running on your own hardware and storage running in a vendor's cloud. That pattern is common in regulated estates that cannot ship raw logs offsite but do not want to run a search cluster either.
7. Integration Fit
Integration fit is where most shortlists finally get cut. Ignore the headline integration count. Read the list for the systems you run today, from syslog aggregation on network gear to container logs coming out of Kubernetes. Open standards matter more than any single connector, because OpenTelemetry ingestion means a source nobody has thought of yet will still work.
The Buyer Checklist
Once the seven axes are answered, what remains is a short checklist. Run it against every tool still standing.
Query and visualization: Search that does not demand a query-language specialist, and dashboards a new hire can read without a walkthrough.
Alerting and automation: Thresholds that hook into PagerDuty, Slack, or a runbook, rather than only turning a dashboard tile red.
Correlation: Whether a log sits next to the metric, trace, or flow around it, which is the line between a log tool and unified observability.
Scale headroom: Whether a sudden traffic spike gets absorbed or silently dropped.
Predictable total cost: Model the bill at double today's volume before you sign anything.
There is a lot of money chasing this problem. According to Mordor Intelligence, the log management market is expected to reach $8.99 billion by 2031.
More money pulls in more tools, and more noise with them, so a tight checklist is the quickest way to thin the field.
How to Actually Choose a Log Aggregation Tool
Here is a quick way to match your situation to the right kind of tool.
Your Situation | Where to Start | Why |
Hybrid or on-prem estate, regulated, wants logs, metrics, and flows in one place | Motadata ObserveOps | Unified correlation with on-prem, HA, and DR deployment |
All-in on one public cloud, small team, wants the fastest setup | A managed cloud-native log SaaS | Minimal operations and quick time to value |
Deep security analytics or SIEM at large scale | An enterprise search or SIEM-grade platform | Built for high-volume security correlation |
Cost-conscious, strong ops team, wants full control | A self-hosted open-source stack | No license spend, in exchange for owning the tuning |
Already standardized on Grafana and Prometheus | An open-source backend that plugs into that stack | Native metrics correlation and low storage cost |
One thing runs through every row above: where your infrastructure actually sits. Gartner expects roughly 90 percent of organizations to run hybrid cloud by 2027 (Gartner, via Integrate.io, 2026).
So a SaaS-only tool quietly narrows your choices before you have picked anything.
Pick the Best Log Aggregation Tool for Your Business
So where does this leave you? For most hybrid and enterprise teams, the log aggregation tool to start with is Motadata ObserveOps.
It puts logs, metrics, and network flows in one place, so a root cause spans all three instead of dead-ending at a log search.
It runs on your own hardware, in HA, and in DR, which the SaaS-only tools cannot give a regulated team. And its price follows your deployment rather than a per-GB meter that climbs every time a service gets chatty.
That said, ObserveOps is not the answer for everyone. Splunk is the stronger call if deep security analytics at massive scale is your priority.
Loki is cheaper and slots right in when you already live in Grafana and Prometheus. Pick for the environment you actually run, not the logo you recognize.
Whatever you shortlist, the only real test is your own logs. Point ObserveOps Log Explorer at your real data, parse the first million lines with the built-in parsers, and see if the triangulation holds up on an incident you already know inside out.
FAQs
What is the difference between log aggregation and log management?
Aggregation is one piece of the bigger management job. It gathers your logs into one searchable place, and management is everything layered on top: parsing, indexing, alerting, retention, analysis. Nearly every tool here does both, so for a buyer the line barely matters.
Is log aggregation the same as a SIEM?
No, they are different jobs. Aggregation makes your logs searchable, while a SIEM layers security on top, detection rules, correlation, compliance reporting, and does the threat hunting that aggregation alone was never built for.
Can log aggregation tools collect logs from Kubernetes and containers?
Yes, this one is rarely a problem. Container and Kubernetes logs flow in through lightweight agents, DaemonSets, or the OpenTelemetry Collector.
If containers are your whole world, treat native Kubernetes support and OpenTelemetry ingestion as table stakes, and note that Motadata ObserveOps covers both natively.
Author
Ramya Shah
Technical Writer
Ramya Shah is a technical content writer with a computer engineering background and roots in automotive journalism. He covers IT Service Management, observability, IT operations, and AI-driven automation. An early adopter of AI-assisted writing workflows, he turns complex IT processes into clear, engaging content optimized for search and answer engines (AEO), lifting content output and organic visibility.