10 Best Linux Monitoring Tools for 2026
What if your Linux server is still online, but your users are already facing problems?
A slow website, high CPU usage, low memory, a full disk, or a database that stops responding can cause issues long before a server goes down.
By the time you notice the problem, users may already be seeing slow pages, failed requests, or error messages.
That is why Linux monitoring needs to cover more than server uptime. You need to know when resources are running low, services stop, and where an issue starts.
The right tool should also help you connect a server problem with your application, database, container, or network.
In this guide, we compare ten of the best Linux monitoring tools for 2026. We look at what each tool monitors, who it suits, where it falls short, and how much it costs.
How We Selected the Linux Monitoring Tools
We looked at what each tool offers for Linux monitoring, including its core features, integrations, deployment options, alerting, and pricing.
We selected the tools based on:
Linux server and operating system support.
Process, service, disk, and network monitoring.
Support for containers, cloud platforms, applications, and databases.
Alerting and troubleshooting features.
Cloud, self-hosted, and on-premises deployment options.
Setup and maintenance requirements.
Published pricing and factors that can increase the cost.
10 Best Linux Monitoring Tools Compared at a Glance
Let’s now have a quick overview of each tool.
Tool | Best for | Deployment | Linux monitoring coverage | Starting price |
Motadata ObserveOps | Hybrid and on-premises environments that need one view across IT systems | Cloud, on-premises, private cloud, or hybrid | Servers, processes, services, logs, databases, applications, containers, cloud systems, and networks | Custom quote with a 30-day free trial |
Datadog | Cloud-first teams with Linux hosts and containers | SaaS | Hosts, processes, containers, cloud services, logs, applications, and networks | Free for up to five hosts. Pro starts at $15 per host per month with annual billing |
Dynatrace | Large environments that need automatic discovery and service mapping | SaaS or managed deployment options | Hosts, processes, services, file systems, applications, logs, cloud platforms, and Kubernetes | Foundation starts at $7 per host per month. Infrastructure Monitoring starts at $29 |
New Relic | Software teams that want Linux data with traces and logs | SaaS | Hosts, processes, containers, applications, logs, and cloud services | Free tier includes 100 GB each month. Extra data starts at $0.40 per GB |
SolarWinds Observability | IT teams with on-premises and hybrid servers, networks, and applications | SaaS or self-hosted | Linux and Windows servers, applications, containers, networks, logs, and cloud systems | Starts at $8 per node per month under a multi-year contract billed annually |
ManageEngine Applications Manager | Teams that want server and application monitoring in one product | Self-hosted or managed cloud | Linux servers, services, processes, applications, databases, virtual systems, containers, and cloud services | Free edition available. Paid pricing requires a quote |
Sematext | DevOps teams that want Linux, container, and log monitoring with simple entry pricing | SaaS | Hosts, processes, containers, Kubernetes, services, metrics, and logs | Infrastructure Monitoring starts at $2.80 per month, with price based on hosts and retention |
PRTG Network Monitor | Teams that need Linux server and network monitoring together | Self-hosted on Windows or hosted | Linux CPU, load, memory, disks, traffic, services, and network devices | Free for 100 sensors. PRTG 500 costs $200 per month, paid annually |
Elastic Observability | Teams that already use Elasticsearch or need strong log search | Cloud or self-managed | Linux metrics, logs, processes, applications, containers, and cloud services | Self-managed Basic is free. Elastic Cloud Hosted starts at $99 per month |
Zabbix | Technical teams that want free and self-hosted monitoring | Self-hosted or Zabbix Cloud | Linux hosts, services, files, processes, logs, applications, containers, and networks | Self-hosted software is free. Support and cloud services cost extra |
The 10 Best Linux Monitoring Tools
Let’s now understand each tool in detail.
1. Motadata ObserveOps
Best for: Organizations, IT analysts, and network managers that need Linux monitoring with applications, logs, databases, cloud systems, and network devices.
Motadata ObserveOps monitors the health and performance of Linux servers. It tracks CPU, memory, disk space, network use, uptime, processes, and service status.
It also collects application traces, logs, database data, cloud metrics, network flows, and device health. This wider view helps when a Linux alert does not explain the full problem.
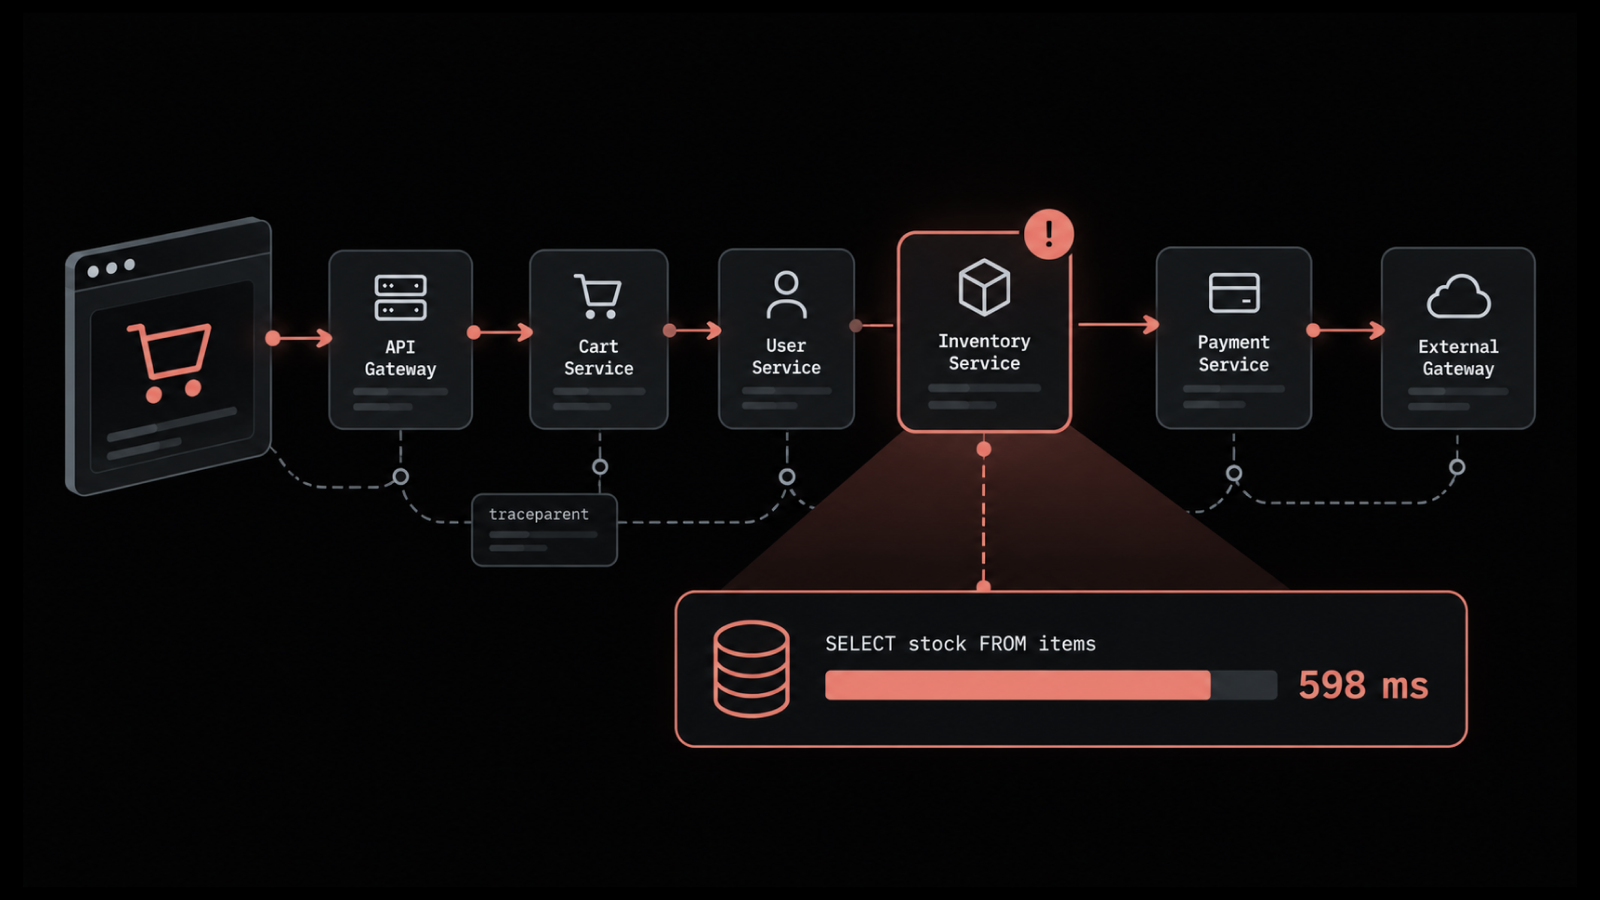
For example, a Linux application server may show high CPU use. ObserveOps can also show the slow application request, the related log messages, and the database query running at that time. The team can see where the delay started before making a change.
ObserveOps suits companies that run a mix of data center, cloud, and branch systems. It also suits regulated businesses that cannot send all monitoring data to a public cloud. A very small team that only needs a few server checks may not need the full platform.
Read our server monitoring tools comparison for a wider look at tools for physical, virtual, and cloud servers.
Pros
- It connects Linux server data with applications, logs, databases, and networks.
- Companies can keep the platform on-premises when required.
- One platform can replace several separate monitoring products.
Cons
- It may provide more features than a small server-only setup needs.
- The website does not show a fixed public price.
Pricing
Motadata ObserveOps uses custom pricing. The quote depends on the deployment, environment size, and modules required. The annual subscription includes updates and technical support. A 30-day free trial is available.
2. Datadog
Best for: Cloud-first teams that want hosted Linux, container, and cloud monitoring.
Datadog installs an agent on each Linux host. The agent collects CPU, memory, disk, load, network, and host status data. Live Process Monitoring shows which processes are running and how many resources they use.
Datadog can place Linux data beside Docker, Kubernetes, AWS, Azure, Google Cloud, database, and application information. A team can move from a host alert to related container changes, application traces, and logs.
This is useful when an online service runs across several cloud systems. A slow Linux host may be the result of a container limit, a busy database, or a new application release. Datadog gives the team one hosted console for these checks.
The full platform runs as a cloud service. It will not suit companies that must keep the monitoring platform and data inside their own network. Infrastructure, logs, APM, network monitoring, security, and other products also have separate prices.
Read our Datadog alternatives guide for a closer comparison with other monitoring products.
Pros
- The vendor manages the monitoring platform and storage.
- It supports a large number of cloud and software integrations.
- It works well for Linux systems running in public cloud environments.
Cons
- The full platform does not run on-premises.
- Logs, APM, network monitoring, and other products cost extra.
- The monthly bill rises as host count and data use grow.
Pricing
Datadog Infrastructure Monitoring is free for up to five hosts with limited features. Pro costs $15 per host per month with annual billing or $18 with monthly billing. Enterprise costs $23 per host per month with annual billing or $27 with monthly billing.
Our Datadog pricing guide explains the separate product and usage charges.
3. Dynatrace
Best for: Large companies that need automatic host discovery, service maps, and detailed problem analysis.
Dynatrace uses OneAgent to collect data from Linux hosts. It monitors processes, services, applications, containers, and disk use. It also shows how hosts, processes, services, and applications are connected.
This service map helps during a larger incident. A slow Linux host may support several applications. Dynatrace can show which services depend on the host and which users are affected.
Infrastructure Monitoring covers process, disk, memory, and network analysis. Full-Stack Monitoring adds application performance monitoring, code details, traces, and automatic root cause analysis. Kubernetes monitoring is also available.
Dynatrace suits large cloud and hybrid environments where automatic discovery can save time. Dynatrace uses several billing units. Logs, sessions, synthetic checks, and other features may add separate charges.
Read our Dynatrace alternatives guide to compare its deployment, automation, and pricing with other platforms.
Pros
- Automatic discovery reduces manual mapping work.
- It connects Linux health with applications and user impact.
- It supports large cloud and hybrid environments.
Cons
- Several billing units must be estimated before purchase.
- Full-Stack Monitoring costs more on hosts with more memory.
- Log use and other extra capabilities can increase the total bill.
Pricing
Dynatrace Foundation and Discovery starts at $7 per host per month and is billed at $0.01 per host-hour. Infrastructure Monitoring starts at $29 per host per month and is billed at $0.04 per host-hour. Full-Stack Monitoring starts at $58 per month for an 8 GiB host and is billed at $0.01 per memory-GiB-hour.
Our Dynatrace pricing guide covers its host, memory, log, and synthetic monitoring charges.
4. New Relic
Best for: Development and operations teams that want Linux data with application traces and logs.
New Relic uses an infrastructure agent to monitor Linux hosts. It collects CPU, memory, disk, network, inventory, and process data. Integrations add information from databases, web servers, containers, and cloud services.
The host data appears in the same service as application traces and logs. If an application becomes slow, a developer can open the trace and check the Linux host that processed the request.
This makes New Relic useful when software and operations teams work on the same incidents. A team can also add browser monitoring and synthetic tests when it needs to check the user side of a service.
New Relic charges mainly for data and user types. This can suit a company with many hosts and controlled data use. The bill can still rise when the team sends large volumes of logs, metrics, or traces. The platform is hosted and does not run fully on-premises.
Read our New Relic alternatives guide for more detail about the products that can replace it.
Pros
- The free tier lets small teams start without paying.
- Infrastructure, applications, and logs appear in one service.
- The price is not based on the number of hosts.
Cons
- Data charges increase when logs and metrics grow.
- Paid user types add another cost.
- A full on-premises deployment is not available.
Pricing
New Relic pricing includes 100 GB of free data each month, unlimited basic users, and one full-platform user. Additional data starts at $0.40 per GB. Core and full-platform users have separate charges based on the selected edition and contract.
Our New Relic pricing guide explains its data, user, and advanced compute charges.
5. SolarWinds Observability
Best for: IT teams that need Linux server, application, and network monitoring across on-premises and hybrid systems.
SolarWinds Observability lets IT teams monitor Linux servers, applications, cloud systems, containers, and network devices. The self-hosted version can run behind the company firewall or in a private cloud.
For Linux servers, it tracks availability, CPU, memory, disk use, and other system data. It can also monitor web servers, databases, and the applications running on each host. If an application becomes slow, the team can check whether the problem comes from the server, the application, or the network.
It is a good fit for teams that manage both on-premises and cloud systems. Server, application, and network data can be viewed together during an incident.
SolarWinds offers several products and modules, so check that the quote includes every feature you need. The self-hosted version also requires a server and regular maintenance.
Read our SolarWinds alternatives guide for a wider comparison of hybrid monitoring products.
Pros
- It covers servers, applications, and networks in one product family.
- A self-hosted option is available for on-premises and hybrid systems.
- Ready-made templates support many business applications.
Cons
- The number of products and modules can make the final quote harder to compare.
- The self-hosted platform needs its own server resources and maintenance.
- Some advanced features require additional products.
Pricing
SolarWinds Observability Self-Hosted starts at $8 per node per month. The published price requires a multi-year contract billed annually. Volume discounts are available, and the vendor provides the final quote. A 30-day trial is available.
6. ManageEngine Applications Manager
Best for: IT teams that want Linux server and application monitoring in a self-hosted product.
ManageEngine Applications Manager monitors Linux servers and the applications running on them. It also covers databases, websites, virtual machines, containers, and cloud services.
For each Linux host, it checks CPU, memory, disk use, network traffic, processes, and services. It can then connect this information with data from web servers, application servers, and databases.
If a website becomes slow, the team can check the server load, application response time, and database queries in one place. This makes it easier to find out where the delay started.
Applications Manager works well for companies that want to run monitoring on their own systems. A managed cloud edition is also available. The product has many menus, so new users may need some time to learn where everything is.
Read our ManageEngine alternatives guide for more information about similar monitoring platforms.
Pros
- It monitors Linux servers and the applications running on them.
- Self-hosted and managed cloud editions are available.
- A free edition is available for a small number of monitors.
Cons
- The large number of menus can take time to learn.
- Paid prices are not displayed as a simple public list.
- Larger environments may require the Enterprise edition and extra add-ons.
Pricing
ManageEngine Applications Manager pricing is based on the number and type of monitors. A monitor can be a server, application, service, or website. The Free edition supports a small environment. The vendor asks paid customers to request a quote for Professional and Enterprise editions.
Our ManageEngine pricing guide explains how its products, editions, and add-ons are priced.
7. Sematext
Best for: DevOps teams that want Linux infrastructure, container, service, and log monitoring through a hosted service.
Sematext is a hosted tool for monitoring Linux servers, processes, containers, Kubernetes, databases, and other services. It includes ready-made dashboards and alerts for many common technologies.
It can also collect logs and application traces. When a Linux alert appears, the team can check the server data, service data, and related logs from the same platform.
Sematext is a practical choice for teams that want hosted monitoring without starting with a large plan. The price depends on the number of hosts or containers, the selected plan, and how long the data is stored.
Infrastructure monitoring, logs, service monitoring, tracing, and network maps are priced separately. Check the cost of every product your team needs before comparing Sematext with another platform.
Pros
- Infrastructure Monitoring has a low starting price.
- It provides dashboards and alerts for common Linux services.
- Teams can add logs, traces, and service maps when needed.
Cons
- Separate monitoring products create separate charges.
- The price changes with hosts, containers, plan level, and retention.
- A full on-premises version is not available.
Pricing
Sematext Infrastructure Monitoring starts at $2.80 per month. The exact price depends on hosts, containers, plan, and retention. A 14-day trial is available without a credit card. Logs start at $5 per month, Service Monitoring at $8.64, Tracing at $19, and Network Map at $1.68 per host per month.
8. PRTG Network Monitor
Best for: Teams that want to monitor Linux servers and network devices from one system.
PRTG Network Monitor uses sensors to check different parts of a Linux server. Sensors can track load, CPU, memory, disk space, network traffic, and service health through SNMP, SSH, and other methods.
The same system monitors switches, routers, firewalls, storage, and other network equipment. This is useful when a Linux server problem may come from a busy link or packet loss.
A team can create maps and alerts for its servers and network devices. The sensor model gives control over what is monitored, but each added check counts against the license limit.
PRTG Network Monitor runs on a Windows server. It can monitor Linux systems, but the main monitoring server does not run natively on Linux. PRTG Hosted Monitor is available for teams that do not want to manage that Windows server.
Read our PRTG alternatives guide to compare it with other server and network monitoring tools.
Pros
- It covers Linux servers and network devices in one system.
- The free edition supports up to 100 sensors.
- Many ready-made sensors reduce the need for custom scripts.
Cons
- The main self-hosted server requires Windows.
- A single Linux server may use several sensors.
- The required license can grow quickly when each server uses many sensors.
Pricing
PRTG Network Monitor is free for up to 100 sensors. PRTG 500 costs $200 per month, paid annually, and supports up to 500 sensors. PRTG 1000 costs $358 per month, paid annually. Larger sensor plans cost more.
9. Elastic Observability
Best for: Teams that already use Elasticsearch or need detailed Linux log search with metrics and traces.
Elastic Observability uses Elastic Agent to collect Linux metrics and logs. The agent can track hosts, processes, containers, applications, and cloud services through integrations.
Its main strength is search. A team can search a large amount of Linux and application log data, create dashboards, and connect logs with infrastructure metrics and application traces.
This is useful when an incident produces many system messages. The team can filter the logs by host, service, time, or error and compare them with CPU, memory, and process changes.
Elastic suits teams that already know Elasticsearch and Kibana. A self-managed setup gives the team more control, but the team must manage clusters, storage, updates, and data limits. Elastic Cloud removes much of that work, but the price depends on resources and data use.
For a wider comparison, see our observability tools guide.
Pros
- It provides strong search for Linux and application logs.
- Linux metrics, logs, and traces can use the same data platform.
- A free self-managed Basic license is available.
Cons
- A self-managed cluster needs storage planning, updates, and regular care.
- Cloud costs change with resources, data, retention, and support level.
- The number of Elastic products and settings can feel complex for a small team.
Pricing
The self-managed Elastic Basic subscription is free. Elastic Cloud Hosted Standard starts at $99 per month, Gold at $114, Platinum at $131, and Enterprise at $184. The final price depends on cloud resources, data, region, and support.
10. Zabbix
Best for: Technical teams that want free, self-hosted Linux monitoring with wide infrastructure coverage.
Zabbix is an open-source monitoring platform. Its Linux agent collects operating system, process, service, file, and log data. It can also monitor systems without an agent through SNMP, SSH, IPMI, and other methods.
Templates provide ready-made checks for Linux, databases, web servers, cloud services, containers, and network hardware. Discovery rules can find new hosts and services and apply monitoring settings.
Zabbix proxies collect data from remote offices and send it to a central server. This makes the product useful for companies with several sites that want to keep monitoring under their own control.
There is no software license fee. The company must still provide the Zabbix server and database, plan its storage, and manage backups and updates. The setup can take time when the team does not already have Zabbix experience.
Pros
- The self-hosted software is free and open source.
- It covers Linux servers, applications, containers, cloud systems, and networks.
- Companies can keep all monitoring data on their own systems.
Cons
- Setup and daily management require technical knowledge.
- The company must provide servers, storage, backups, and updates.
- Large installations need careful database and proxy planning.
Pricing
Zabbix is free under the AGPLv3 license. It has no per-host or per-device license charge. Zabbix sells support, consulting, training, managed services, and Zabbix Cloud separately. Support subscription prices depend on response coverage and support terms.
What Should a Linux Monitoring Tool Cover?
A Linux monitoring tool should show whether a server is healthy and provide enough information to investigate a problem. Most teams need the following checks.
CPU and load: Shows how much work the server is handling and which processes use the most CPU.
Memory and swap: Alerts you when memory is running low or the server starts relying too much on swap.
Disk space and performance: Shows how much space is left and whether slow disk reads or writes are affecting performance.
Network activity: Tracks traffic, bandwidth use, connection errors, and dropped packets.
Processes and services: Shows whether important processes and Linux services are running.
Logs: Provides the system and application messages that explain what happened before a failure.
Containers: Tracks Linux workloads running through Docker and Kubernetes.
Alerts: Tells the right person when a service stops or a value reaches a set limit.
History and reports: Shows whether performance is getting worse over time.
Starting Your Linux Monitoring Journey? Here’s a Tip
I have shared a list of the best Linux monitoring tools and what each one can help you monitor.
With the right tool, you can keep an eye on your servers, applications, databases, logs, and other parts of your infrastructure.
Just keep one thing in mind. Choose a tool based on your setup, deployment needs, and the level of visibility your team needs.
If you want a simple takeaway from my side:
I would say, try Motadata ObserveOps if you want Linux monitoring with applications, databases, logs, cloud systems, and networks in one platform.
FAQs
What is the best Linux monitoring tool?
The best Linux monitoring tool depends on your environment. Motadata ObserveOps suits hybrid and on-premises companies that need wider monitoring. Datadog suits cloud-first teams. Zabbix suits technical teams that want a free self-hosted product.
Which Linux monitoring tools are free?
Zabbix is free and open source. PRTG has a free edition for up to 100 sensors. Datadog and New Relic also offer limited free plans. Elastic has a free self-managed Basic subscription.
What should I monitor on a Linux server?
You should monitor CPU, load, memory, swap, disk space, disk speed, network traffic, errors, uptime, processes, and service status. Logs and application data can help explain why these values changed.
Can Linux monitoring tools track Docker and Kubernetes?
Yes. Motadata ObserveOps, Datadog, Dynatrace, New Relic, SolarWinds, ManageEngine, Sematext, Elastic, and Zabbix can monitor containers and Kubernetes environments. Their setup, detail, and pricing differ.
Is a free Linux monitoring tool cheaper than a paid one?
A free tool has no license fee, but it still needs infrastructure and staff time. Your team must handle installation, updates, backups, storage, security, and alert tuning. A paid hosted tool has a subscription or usage charge, but it can reduce the work needed to operate the monitoring platform.
Author
Ramya Shah
Technical Writer
Ramya Shah is a technical content writer with a computer engineering background and roots in automotive journalism. He covers IT Service Management, observability, IT operations, and AI-driven automation. An early adopter of AI-assisted writing workflows, he turns complex IT processes into clear, engaging content optimized for search and answer engines (AEO), lifting content output and organic visibility.