How WebLogic Monitoring Exposes Deployment Faults Behind Healthy Servers
Why does the WebLogic console report every managed server as RUNNING while the application owner is fielding 503 errors from production?
Server state and deployment state are two separate readings, and most WebLogic monitoring setups watch only the first. A managed server can show a clean lifecycle state, an open port, and a healthy heap while the archive on top of it never advanced past PREPARED.
Clustered domains widen the distance, since every archive carries its own target list and activation order. One member dropped from that list produces intermittent failures that survive each restart, because server health reports no fault. Availability reporting drawn from server uptime still records a clean month.
In this blog, you will see which server lifecycle KPIs predict an outage, what deployment readings tell you that server metrics cannot, how to work through an unhealthy or mis-targeted deployment, and how to design a middleware operations dashboard for on-call use.
What Does WebLogic Monitoring Track Beyond CPU and Heap?
WebLogic monitoring tracks two KPI families that live above the JVM: the lifecycle and health of each server in the domain, and the state, health, and targeting of every application deployed onto those servers. Metrics from the wider application infrastructure report whether the process is alive. These two families report whether the service it hosts is serving.
Most Oracle WebLogic monitoring implementations stop at the first family, because deployment-level readings live on a screen that nothing polls on a schedule. Observability across both families is what turns a server inventory into a service view.
Server lifecycle KPIs: State, health state, cluster membership, machine assignment, listen address, and listen ports
Deployment KPIs: Deployment state, deployment health, application type, target list, and deployment order
Runtime KPIs: Heap utilization, garbage collection, thread pool depth, JDBC pool activity, and JMS queue depth
The third family is well covered by JVM monitoring and application instrumentation. The first two are where WebLogic server monitoring usually goes quiet, which is why deployment-level observability changes what an incident review can actually explain.
Why Should Service Owners Care About WebLogic Deployment Health?
WebLogic deployment health matters to service owners because it is the layer where an outage reaches customers while every infrastructure dashboard stays green. Availability figures built on process uptime will report a healthy month for a domain that spent hours returning errors.
Three consequences follow from that mismatch:
Availability reporting overstates reality: A service level agreement measured on server uptime counts a PREPARED archive as available
Incident duration grows during diagnosis: Responders spend the opening stretch of every middleware incident confirming that healthy servers are healthy
Change failures stay invisible until customers report them: A targeting mistake made during a release survives every restart and every server-level check
Consider a payments domain where a release targets the authorization archive at three of four cluster members. Card transactions fail for roughly a quarter of requests, the operations view reports four servers RUNNING and OK, and the first credible signal arrives from the contact center.
Deployment-level observability puts customer-facing reading and infrastructure reading on the same screen. That is the difference between an availability number your service owners trust and one they argue about.
Which WebLogic Server Lifecycle KPIs Matter Most?
The WebLogic server lifecycle KPIs that matter most are server state and health state, read together. State describes where the server is in its startup and shutdown sequence, while health state describes whether its subsystems are reporting faults while it runs.
KPI | What it reports | What a change signals |
Server state | SHUTDOWN, STARTING, STANDBY, ADMIN, RESUMING, RUNNING, SUSPENDING, SHUTTING_DOWN, FAILED | ADMIN accepts administrative traffic only. FAILED means Node Manager could not reach a working state |
Health state | OK, WARN, CRITICAL, FAILED, OVERLOADED | OVERLOADED points at work manager saturation or memory pressure before the server drops out |
Cluster name | Which cluster the server belongs to | A blank value on a server you expected to be clustered explains uneven load distribution |
Machine name | The Node Manager host the instance runs against | Several critical members mapped to one machine turns a host failure into a service failure |
Listen address | The address the server binds to | A wildcard bind on a multi-homed host sends traffic down the wrong interface |
Listen ports | Plain and SSL ports accepting traffic | An open OS port with the server in ADMIN state produces health checks that pass and requests that fail |
How Do You Read State and Health Together?
State and health mean something only as a pair, since each reading on its own hides a failure the other exposes. Three pairings cover almost everything you will meet in a live domain.
RUNNING with CRITICAL: The pairing that costs the most time. A load balancer keeps routing to it because the port answers, and the console keeps it green in the server list
ADMIN with OK: Usually deliberate, set by a failed activation or by an administrator draining traffic
RUNNING with OVERLOADED: Work manager saturation or memory pressure, arriving before the server drops out of its cluster
Alert on state transitions rather than absolute values. That one change keeps a deliberate ADMIN move separate from a genuine failure.
Which Lifecycle Fields Drift Quietly?
Cluster and machine assignments look like static configuration, so most setups never collect them. They move after domain expansions and disaster recovery tests, which is why change impact analysis belongs alongside the runtime view. Two comparisons catch the common cases.
Cluster membership against expectation: Finds members that left a cluster during a restart cycle
Machine assignment across critical members: Finds several members pinned to one host, where a host failure becomes a service failure
What Do Deployment State and Health Tell You?
Deployment state and health tell you whether an application archive is available to receive requests, which is a separate question from whether the server is running. WebLogic moves each deployment through its own lifecycle, and an archive can stall at any stage while the hosting server stays healthy.
KPI | What it reports | Operational meaning |
Deployment state | New, Prepared, Admin, Active, or Retired | Prepared means staged and validated but serving nothing. Admin restricts it to administrative channels |
Deployment health | OK, WARN, CRITICAL, FAILED, OVERLOADED | FAILED on an ACTIVE deployment points at a datasource, JMS destination, or library that did not resolve |
Deployment type | Web Application, EJB, Enterprise Application, Resource Adapter, Library | Shared libraries failing to deploy cascade into every application referencing them |
Targets | Servers and clusters the archive is deployed to | A partial target list produces failures on some requests and success on others |
Deployment order | Integer controlling activation sequence, default 100 | An application activating ahead of a library it depends on fails at startup and stays failed |
Which Two Fields Cause Most Deployment Incidents?
Deployment order and target lists cause more deployment incidents than the state field itself, because both fail without changing a single server reading.
Deployment order: Two applications with identical configuration behave differently across environments purely because their order values differ, and nothing in the server view explains why
Partial targeting: An archive reaching three of four cluster members fails roughly one request in four while every server reports RUNNING and OK
Both are worth alerting on directly, because neither produces a symptom that server-level WebLogic monitoring will surface on its own. A shared library ordered behind the four applications that consume it will fail an entire release window while every server reports RUNNING, and the change record will show a successful deployment.
How Do You Investigate an Unhealthy or Mis-Targeted Deployment?
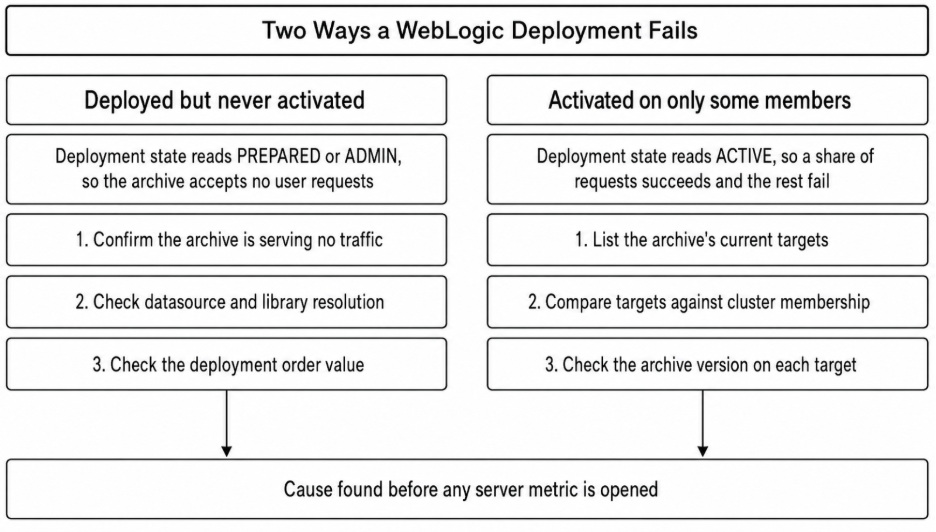
Investigate a WebLogic deployment fault from the deployment downward rather than from the server upward, because a server-first path passes through several layers of healthy readings before reaching the cause. The two sequences below cover the failure shapes behind most WebLogic deployment incidents, and both are short enough to hand to a first-line responder.
An unhealthy deployment on a healthy server follows one path:
Confirm the deployment state: An archive in PREPARED or ADMIN state serves no traffic, whatever the server reports
Check health against dependencies: FAILED health on an ACTIVE deployment points at a datasource, JMS destination, or shared library that did not resolve
Read deployment order against the dependency list: An application ordered ahead of the library it consumes fails during activation and does not retry
Check the hosting server health state: OVERLOADED here means the deployment is healthy and starved
Pull JVM and thread pool readings last: These confirm the diagnosis instead of leading it
A mis-targeted deployment follows a shorter path:
List current targets for the archive: Record every server and cluster name the deployment reports
Compare against live cluster membership: Any member present in the cluster and absent from the target list is the fault
Check whether the gap followed a domain change: Cluster members added after the last deployment do not inherit existing target lists
Verify archive version on each target: Mixed versions across members produce behavior that looks like a caching problem
Both paths share one discipline. Start at the layer closest to the request and move down only when the layer above reads clean, which is how root cause analysis works in any layered stack.
Both sequences turn on a single early decision, and getting it wrong costs the responder the rest of the incident. The diagram traces where the checks branch, so an on-call engineer can tell which failure shape is in play within the first two readings.
What Should a Middleware Operations Dashboard Show?
A middleware observability dashboard should answer one question on the first screen: which deployments in this domain are not currently serving traffic. Dashboards built around server counts and heap graphs answer a question nobody asks during an incident, and they give service owners nothing they can act on. The same principles apply here as to any monitoring dashboard that has to work under pressure.
Deployment health by application: Every archive with its state, health, and target count, sorted so anything other than ACTIVE and OK rises to the top
Server lifecycle grid: One row per managed server showing state, health state, cluster, and machine, with transitions highlighted
Targeting drift panel: Cluster membership compared against deployment target lists, showing only the mismatches
Runtime pressure summary: Heap, thread pool depth, and JDBC pool waits for servers currently reporting WARN or OVERLOADED
ObserveOps builds these from customizable widgets including tables, time-series charts, and lists, with historical drill-down through the time selector. Panels are movable and resizable, and dashboards can be shared with stakeholders by email.
Order panels by how often each one resolves an incident. Deployment health earns the top position because it fails quietly, while heap graphs are already covered under full-stack observability. The same layout doubles as the view an application owner can read without a middleware background, which is the point at which middleware monitoring stops being an operations-only concern.
How Do You Set Up WebLogic Data Collection?
WebLogic data collection runs through a metric plugin that authenticates against the domain and polls runtime MBeans on a schedule, which is how Oracle WebLogic monitoring tools reach lifecycle and deployment readings without touching application code. ObserveOps manages metric plugins centrally, and the WebLogic integration covers connection setup.
Five decisions shape the quality of what you collect:
Point collection at the Administration Server: Domain-wide deployment and targeting data resolves from the admin tier rather than individual managed servers
Use a dedicated monitoring account: A read-only account with the Monitor role keeps collection working through credential rotations
Set polling intervals by KPI volatility: Lifecycle and deployment state poll well at longer intervals, while thread and pool metrics need tighter windows
Account for archive count in cardinality planning: Forty archives across eight managed servers produce several hundred deployment-level series before any runtime metric is added
Confirm listen address reachability from the collector: A collector reaching the admin port but not the managed server ports produces partial data that reads as an outage
Plan the polling interval against your detection target, since WebLogic domain monitoring is only as current as its slowest poll. Collecting lifecycle state every five minutes puts a floor under time to detect that no alert rule can lower, and that floor lands directly in your incident duration figures.
Which WebLogic Readings Deserve an Alert?
The WebLogic readings that deserve an alert are the ones that fail quietly and stay failed, which rules out most runtime metrics and rules in almost every lifecycle and deployment KPI. Heap pressure recovers on its own often enough to generate noise, while a deployment stuck in PREPARED stays there until somebody acts. Splitting the list into page and ticket keeps out-of-hours cost matched to customer impact.
Deployment state leaves ACTIVE: Page immediately, since traffic to that archive is already failing
Deployment health reports FAILED or CRITICAL: Page immediately, with the dependency list attached
Target list stops matching cluster membership: Ticket rather than page, because the fix is a configuration change
Server state moves to ADMIN or FAILED: Page on FAILED, ticket on ADMIN, since ADMIN is frequently deliberate
Server health reports OVERLOADED: Page, because this precedes a drop from the cluster
Listen address or port changes: Ticket, and treat repeat occurrences as a change control problem
Attach the deployment name, target list, and hosting server to every alert payload. An alert reading "deployment health CRITICAL" without those fields sends the responder back to the console, which removes most of the value of monitoring it. Context from Java application monitoring completes the picture once the responder knows which archive to open.
Bring WebLogic Deployment Health into the Same View as Your Infrastructure with Motadata ObserveOps
One limitation is worth naming. No observability platform will tell you why an archive was targeted at the wrong cluster, because that answer lives in your change process. Monitoring can only shorten the distance between the mistake and the moment somebody notices it.
That distance is what ObserveOps works on. WebLogic data is collected through centrally managed metric plugins and rendered beside server, network, virtualization, and cloud readings from the same environment, so alert policies can be built on whichever readings matter to the service rather than on process availability alone.
An on-call engineer opens one dashboard, reads deployment health first, and reaches the failing archive before working through server metrics that were never going to explain it.
FAQs
What is the difference between WebLogic server state and health state?
Server state describes position in the startup and shutdown lifecycle, such as STARTING, ADMIN, or RUNNING. Health state describes whether internal subsystems report faults while the server runs. A server can report RUNNING and CRITICAL at once, which is among the most commonly missed readings in WebLogic monitoring.
Can you monitor WebLogic deployments without installing an agent?
Yes. Lifecycle and deployment KPIs resolve from runtime MBeans exposed by the Administration Server, so a collector with a read-only account can poll them remotely. Motadata ObserveOps collects WebLogic data through a metric plugin rather than a host agent. Application-level tracing inside the JVM is a separate exercise and does require instrumentation.
Why does a WebLogic deployment show as ACTIVE but still return errors?
An ACTIVE deployment with FAILED or CRITICAL health has usually lost a dependency such as a datasource, JMS destination, or shared library. The archive stays deployed and reachable while the resources it needs fail to resolve. Showing deployment health next to server health on a single dashboard makes that distinction visible before anyone orders a restart.
What polling interval should WebLogic performance monitoring tools use?
Match the interval to how fast each KPI changes. Lifecycle and deployment state poll well at one to five minute windows, while thread pool depth and JDBC pool waits need tighter intervals to be useful. Your detection target sets the floor.
How does deployment order cause WebLogic startup failures?
Deployment order is an integer controlling activation sequence, defaulting to 100. An application ordered ahead of a shared library or resource adapter it depends on, fails during activation and does not retry automatically. Identical applications behaving differently across environments frequently trace back to mismatched order values.
Author
Poonam Lalani
Content Strategist
Poonam Lalani is a B2B content strategist and writer with a background in computer engineering and experience across enterprise technology domains, including AI, cloud, DevOps, data engineering, and IT operations. She specializes in creating research-driven content that simplifies complex ideas and supports product education, thought leadership, and business growth.