10 Best Nutanix Monitoring Tools Compared
Prism tells you what your Nutanix cluster is doing. However, it says nothing about the switch, the firewall, or the app on top of it. That is the blind spot in most hyperconverged infrastructure estates.
Nutanix monitoring tools close that gap. Which one you pick decides how much you see.
In this blog, you will see:
The comparison table: Ten tools, sorted by how each one collects Nutanix data.
Full reviews: Every tool carries real limits, not only features.
What changes in 2026: Nutanix retires its legacy APIs this quarter.
By the end you will know which one fits your estate.
What Are Nutanix Monitoring Tools?
Nutanix monitoring tools pull health and performance data from a Nutanix cluster. They turn it into dashboards, alerts, and capacity forecasts.
What they watch is fairly standard. The cluster sits at the top and the AHV hosts sit under it. Below those, the virtualization layer holds the VMs and storage containers.
How they collect it is not standard at all. Almost every tool reads through Prism, not an agent on each node. That one choice is why the Prism API matters so much here.
The category splits in two. Nutanix ships its own management plane. Other vendors add the rest of your estate around it.
Most Nutanix teams end up with one of each. We rarely see a shop pick just one side.
How We Evaluated These Nutanix Monitoring Tools
Every vendor page in this category lists clusters, hosts, and VMs. So we ranked on five questions instead.
How the tool collects: Prism API, SNMP, or an agent. This sets the depth you get, and whether a Nutanix upgrade breaks the link.
Which Prism API version it targets: Nutanix retires v0.8, v1, v2, and v3 this quarter. The version your vendor uses is now a buying question.
How deep it goes: Cluster totals are easy. Controller latency, storage tier splits, and per-VM detail are where tools separate.
What else it monitors: A cluster fails in context. Single-domain coverage leaves you joining the dots by hand.
What the meter counts: Hosts, devices, sensors, hybrid units, or monitors. The unit matters more than the rate once an estate grows.
Prices come from public pricing pages and rate cards, checked in September 2026. Where a vendor publishes no number, we say so instead of guessing.
The 10 Best Nutanix Monitoring Tools Compared
Here is how the ten tools line up on the columns that decide most Nutanix shortlists.
Tool | Best For | Collection Method | Nutanix Depth | Deployment | Starting Price |
Motadata ObserveOps | Nutanix beside network, servers and apps | Agentless over HTTPS through Prism | Cluster, host, disk, storage container | On-prem, private and public cloud (6 modes) | Quote-based |
Nutanix Prism Central | The native baseline | Built in | Deepest, Nutanix only | On-prem, Nutanix Cloud Clusters | Included with AOS |
LogicMonitor | Mixed-vendor estates and MSPs | Prism Central v4 API, plus legacy SNMPv3 modules | Cluster, host, VM | SaaS with on-prem collectors | From $16 per hybrid unit per month |
SolarWinds Virtualization Manager | On-premises estates on the Orion platform | Nutanix API and SNMP | Cluster, volume, host, VM | Self-hosted, SaaS | Quote-based |
ManageEngine OpManager | Mid-market network teams | Prism API, with SNMP, WMI and CLI for VM depth | Cluster, host, VM, 30-plus metrics | On-prem, cloud | From $245 |
Dynatrace | Enterprises wanting automated root cause | Prism Central v4 API only | 8 entity types, 60-plus metrics | SaaS, Dynatrace Managed | $0.04 per host-hour |
Datadog | Teams already running Datadog | Agent on a VM, Nutanix API v4.0 or later | Cluster, host, VM, plus Prism events | SaaS only | $15 per host per month |
Site24x7 | Smaller teams on a tight budget | On-Premise Poller against the Prism API | Cluster, host, VM, storage container | SaaS with on-prem poller | From $9 per month |
Paessler PRTG | Small teams wanting one sensor license | SNMP v3, two sensors | Cluster health and hypervisor only | Self-hosted, hosted | $200 per month |
Zabbix | Teams with engineering time, no license budget | Prism Element REST API v2.0 templates | Cluster, host, storage container | Self-hosted | Free |
Read the Collection Method column first. It predicts how much Nutanix detail you get. It also predicts how much work your next Nutanix upgrade will cost you.
Detailed Overview of the 10 Best Nutanix Monitoring Tools in 2026
Here is a closer look at each tool, with the limits included.
1. Motadata ObserveOps
Best for: IT teams that want Nutanix clusters watched beside the network, servers, and apps around them.
Rating: 4.7/5 on G2, 4.6/5 on Gartner Peer Insights.
Pricing: ObserveOps Infinity is one edition that replaced the previous four. Nothing sits behind an upgrade tier. The platform is metered per monitored device. Terms run 1-year, 3-year, or perpetual with ATS, and a quote comes from a sizing worksheet.
Nutanix comes in as a first-class device type, not a plugin. Setup is one credential profile and one discovery run pointed at Prism, and nothing gets installed on the nodes. On a large estate that is the difference between an afternoon of onboarding and twenty minutes.
Depth is where our Nutanix monitoring earns its place. Controller and hypervisor I/O arrive as separate metric sets. A latency complaint therefore splits into a storage path problem or a hypervisor problem before anyone opens a ticket.
Two host signals matter more than their names suggest. Oplog disk fill warns you about write pressure while there is still time to act. Acropolis connection state catches a host that has lost its management path, usually before users call.
Redundancy is the third one we would watch. A cluster reports what it currently has against what it should have. That gap is how teams find out they are less protected than they assumed.
What justifies this over a Nutanix-only tool is everything beside the cluster. A latency spike arrives with the switch port and the transaction under it already attached. That is the joining-up a single-domain tool hands back to you.
Regulated estates get a real answer here too. A bank that cannot send telemetry offsite still gets a fully supported install. That single constraint rules most SaaS-only tools out of the conversation.
Star ratings only tell you so much. It helps to hear from a team that runs ObserveOps every day.
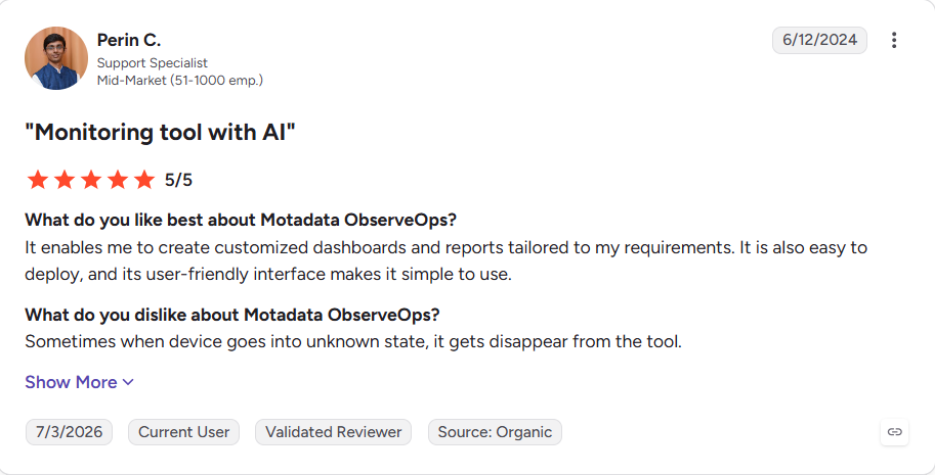
You can read more ObserveOps reviews on G2.
Pros
- Nutanix metrics land next to network, server, and app data, so correlation does not mean a second console.
- Onboarding scales with clusters rather than nodes, so adding capacity does not add monitoring work.
- Cloud and virtualization topology maps place HCI parts in a live map that refreshes itself.
- Data residency rules can be met without dropping to a cut-down feature set.
- One edition means capability planning never turns into tier shopping mid-evaluation.
Cons
- VMs are modeled as instances of their host, not standalone monitors. Per-VM alerting is coarser as a result.
- We publish the licensing model but not the prices, so you cannot size a bill from a web page.
- ObserveOps Infinity reached general availability in August 2026, so its field record is short.
- A team that runs Nutanix and nothing else is buying more platform than it needs.
- Our review count is smaller than SolarWinds' or Datadog's, so there is less peer feedback to read.
2. Nutanix Prism Central
Best for: Nutanix-only estates that want native management without adding a second platform.
Rating: 4.6/5 on Gartner Peer Insights for the Nutanix Cloud Platform.
Pricing: Prism Element ships with AOS at no extra cost. Prism Central is included for multi-cluster management. The advanced operations features are licensed through Nutanix Cloud Manager, with a 90-day trial.
Prism comes in two halves that do different jobs. Prism Element manages a single cluster. Prism Central sits above several of them, and it is the half most teams mean when they say Prism.
Nobody knows a Nutanix cluster better than Nutanix does. No API sits between the data and the console, so nothing is lost translating one vendor's metric names into another's.
The paid layer is where the advanced operations live. Nutanix Cloud Manager Intelligent Operations, called Prism Pro and Prism Ultimate before, carries the forecasting and automation work. The free baseline is narrower than most Prism screenshots suggest.
The boundary is the honest limit. Prism stops at the edge of the Nutanix estate. The top-of-rack switch, the firewall, and the app on the VM are all invisible to it. Every Nutanix shop we work with keeps Prism, then adds something around it.
Pros
- Nothing to install, integrate, or license before you get cluster health data.
- Health checks stay in step with the AOS version you run, with no integration to re-certify after an upgrade.
- Disaster recovery status sits in the same view as performance
Cons
- Visibility stops at the Nutanix boundary, so network gear and apps need a second tool.
- Capacity forecasting, anomaly detection, and automation need an NCM license on top.
- Some tasks still send you between Prism Central and Prism Element.
- Log analytics and long retention are thin next to a dedicated observability platform.
3. LogicMonitor
Best for: Teams and service providers running many infrastructure vendors behind one dashboard.
Rating: 4.5/5 on G2 across 644 reviews.
Pricing: Three published package prices at $16, $27, and $53 per hybrid unit per month. What counts as a hybrid unit varies by resource type. That is the part that makes LogicMonitor pricing hard to forecast.
LogicMonitor has the most current Nutanix integration of the third-party platforms here. Nutanix validated it through the Nutanix Ready program, which is a stronger signal than a vendor claiming support on a web page.
Active Discovery is the part teams notice daily. On a cluster where VMs come and go weekly, coverage stays current without anyone maintaining a list of what to watch.
One detail is worth a question before you buy. LogicMonitor also carries older Nutanix modules that collect over SNMPv3, and an existing account may still be running those. We would confirm which set you are on, because only one of them is built on the current API.
Pros
- The Nutanix modules target the v4 API, so they match where Nutanix is heading.
- Automatic discovery keeps monitoring current on clusters with high VM churn.
- Wide vendor coverage makes it a real single pane for a mixed estate.
Cons
- Hybrid unit licensing is hard to model up front, and cost climbs fast with resource count.
- Legacy SNMPv3 modules are still in the wild, so what you get depends partly on when your account was set up.
- It is SaaS-first, so fully air-gapped estates are not a fit.
4. SolarWinds Virtualization Manager
Best for: On-premises estates already standardized on the SolarWinds Orion platform.
Rating: 4.3/5 on G2.
Pricing: Quote-based for Virtualization Manager, with SolarWinds products starting at $370. Full SolarWinds pricing depends on which Orion modules you license with it.
Virtualization Manager is the SolarWinds module that covers Nutanix AHV, reading through the Nutanix API with SNMP alongside it. It is a mature product, and that shows in the capacity planning and VM sprawl tooling.
Its real strength is hypervisor breadth. An estate running AHV and VMware at once sees both in the same views. That is exactly the position a half-finished migration leaves you in.
Nutanix and SolarWinds also publish a joint solution brief pairing monitoring with Security Event Manager. That pairing is why SolarWinds shows up on most Nutanix shortlists.
Buying it is the awkward part. Virtualization Manager is one module in a wide portfolio. Covering Nutanix, the network, and logs usually means several licenses and the Orion platform under them. That is the sticking point we hear about most.
5. ManageEngine OpManager
Best for: Mid-market network teams that want Nutanix inside a general network monitor at a low entry price.
Rating: 4.3/5 on G2, 4.4/5 on Gartner Peer Insights.
Pricing: Three editions starting at $245, with Professional from $345. Enterprise starts at $11,545 for 250 devices. Annual maintenance runs at 20 percent of license cost, and ManageEngine pricing is published per device pack.
OpManager reaches Nutanix through the Prism API by default, then falls back to other credentials for what the API will not give up. That hybrid is how it gets to more than 30 Nutanix metrics.
Its cluster view carries setup detail other tools skip, including the AOS and NCC versions running underneath. That is genuinely useful when you are planning an upgrade and need to know what each cluster is on.
The trade-off lands at VM level. Those extra credentials have to be set per machine, which on a large estate is real work. It is the step we most often see teams miss during a trial.
Pros
- Entry pricing is the lowest of the commercial tools that use the Prism API.
- Prices and maintenance rates are published, so you can budget without a sales call.
- Nutanix sits inside a capable network monitor, not a virtualization-only tool.
Cons
- Full VM depth needs per-machine credentials beyond the Prism API, which adds setup time.
- The interface carries a lot of history and takes longer to learn than newer tools.
- Log analytics, app monitoring, and config management are separate ManageEngine products.
6. Dynatrace
Best for: Large enterprises that want Nutanix inside full-stack observability with automated root cause.
Rating: 4.5/5 on G2, 4.6/5 on Gartner Peer Insights.
Pricing: Infrastructure Monitoring bills at $0.04 per host-hour, or about $29 per month per host. Full-Stack Monitoring is $0.01 per memory-GiB-hour, about $58 a month for an 8 GiB host. Log ingest adds $0.20 per GiB, so Dynatrace pricing runs several meters at once.
Dynatrace has gone furthest on the API question. Its Nutanix Clusters extension was rebuilt on v4 rather than patched onto it. Collection now runs through Prism Central instead of older per-cluster calls.
Coverage is the widest of any third-party tool here, and the modeling is why. The extension treats the estate as objects rather than numbers. A virtual disk or a network becomes something you can alert on by itself.
Two costs come with that rebuild. Metrics disappeared in the move, so anything you built on the old extension needs revisiting. The version floor is the harder one. An older cluster has to be upgraded before the extension will talk to it at all.
Pros
- The only extension here already rebuilt on the API Nutanix is standardizing on.
- Entity modeling is the richest available, down to virtual disks and networks.
- Root cause needs less manual correlation than anything else on this list.
Cons
- Release 3.0 removed metrics, so dashboards and alerts on the old extension need rework.
- It needs AOS 7.x and Prism 2023.4 or later, so older clusters are unsupported until upgraded.
- Several meters run at once, which makes the annual number hard to forecast.
- The platform is more than a mid-sized team needs, and it prices accordingly.
7. Datadog
Best for: Cloud-native teams already on Datadog that want Nutanix beside their cloud workloads.
Rating: 4.4/5 on G2, 4.6/5 on Gartner Peer Insights.
Pricing: Infrastructure Monitoring starts at $15 per host per month billed annually, or $18 on demand. Datadog pricing adds separate meters for logs, APM, and custom metrics.
Datadog's Nutanix integration reached general availability in March 2026, making it the newest option here. There is no separate integration to install, which is the whole appeal for a team already running the Agent.
Its more interesting move is pulling Prism Central's own operational record into Datadog. Nutanix stops being a separate thing somebody remembers to check and joins the stream your team already watches.
Three limits deserve testing during the trial rather than after it. The integration will not talk to a cluster below API v4.0 at all. The other two are quieter, because they change what your VM inventory looks like instead of breaking anything outright.
Pros
- Built on Nutanix API v4.0 or later, so it targets the current API generation.
- Prism events and alerts land in the stream your team already watches.
- Setup is quick for teams that already run the Datadog Agent.
Cons
- Powered-off VMs are excluded by default, which hides part of the estate.
- VM metrics use the Prism Central VM name, not the hostname, so duplicates can appear.
- SaaS only, with no self-hosted option for data that cannot leave the building.
- The integration is new, so there is little field experience to draw on yet.
8. Site24x7
Best for: Smaller IT teams that want multi-cluster Nutanix visibility without enterprise pricing.
Rating: 4.6/5 on G2 across 469 reviews.
Pricing: Plans start at $9 per month paid annually on the Starter tier, with Pro near $35 a month. Site24x7 pricing is metered by monitor count rather than by host.
Site24x7 reaches Nutanix through an On-Premise Poller rather than a direct cloud connection. Nothing lands on the Nutanix nodes, and the poller does the talking to Prism.
Coverage is broader than the price suggests. It runs from cluster IOPS all the way down to the guest applications inside a VM, which is unusual at this tier.
Capacity work is the real surprise here. Forecasting and right-sizing normally sit behind an enterprise tier elsewhere, and reclaiming idle VMs is where most teams find their first Nutanix saving.
The poller is the catch. It is another part to deploy, patch, and keep reachable, and if it goes down your Nutanix monitoring goes with it. We would treat it as production kit, not a helper.
Pros
- The lowest entry price of any commercial tool here that uses the Prism API.
- Reclaiming idle VMs gives a small team a concrete way to claw back cluster headroom.
- Guest OS app data comes from the same console as cluster metrics.
Cons
- The On-Premise Poller is another component to run, patch, and monitor.
- Monitor-count pricing adds up once you instrument every VM and service.
- Depth and customization are thinner than the enterprise platforms above it.
9. Paessler PRTG
Best for: Small IT teams that want basic Nutanix health beside every other device on one license.
Rating: 4.7/5 on G2 across 213 reviews.
Pricing: PRTG 500 costs $200 per month paid annually and covers 500 sensors across 50 devices. PRTG 1000 is $358, PRTG 5000 is $1,300, and PRTG 10000 is $1,642 per month. PRTG pricing counts sensors, not hosts.
PRTG takes the opposite approach to everything else here. It reads Nutanix over SNMP v3 and never touches the Prism API at all.
Two sensors carry the whole integration. One watches cluster health, the other watches a single AHV host, and between them you get availability and throughput rather than diagnosis.
That design has one clear upside in 2026. Because collection never goes near Prism, the coming API retirement leaves it completely alone.
Depth is what you trade away. Cluster health and host throughput are the ceiling, and everything below that is simply not there. Sensor counting adds a second squeeze, because Nutanix competes with every switch port for room on the license you bought.
Pros
- SNMP collection is untouched by the Nutanix legacy API deprecation.
- Setup is quick, and the sensors need no Prism integration work.
- Everything you monitor shares one license and one interface.
Cons
- Two sensors are the whole integration, with no storage container or per-VM visibility.
- SNMP returns far less Nutanix detail than the Prism API does.
- Growing the Nutanix estate can push you into a larger license tier on its own.
- There is no capacity forecasting or anomaly detection for Nutanix workloads.
10. Zabbix
Best for: Teams with engineering time available and no license budget to spend.
Rating: 4.3/5 on G2 across 209 reviews, and 4.6/5 on Gartner Peer Insights.
Pricing: Free and open source, with paid support and training sold separately. Zabbix pricing is really about the people who run it.
Zabbix ships official Nutanix templates rather than leaving you to community scripts, which is more than most free options manage. They cover the Prism Element, cluster, and host layers and run on current Zabbix releases.
Coverage is solid for something that costs nothing. Discovery finds clusters, hosts, and storage containers on its own, and the metric set goes deeper than a free tool usually bothers to.
One line in the docs decides whether this works for you. The templates connect through the Prism Element REST API v2.0, and that version is on the list Nutanix is retiring. We would plan the template work into the same window as your next AOS upgrade.
Pros
- No license cost, which makes it viable where budget is the binding constraint.
- The Nutanix templates are official and maintained, not community one-offs.
- Templates and triggers can be shaped to whatever your team needs.
Cons
- The templates run on Prism Element REST API v2.0, which Nutanix is retiring.
- There is no official Prism Central template, so multi-cluster views need building.
- You run, scale, and upgrade the Zabbix server yourself, and that time is the real cost.
- Dashboards, alert logic, and correlation all need building from scratch.
What Changes for Nutanix Monitoring in 2026?
Nutanix is retiring its legacy APIs, and that changes how you should judge every tool above. The Nutanix v4 API reference is blunt about it. Legacy versions v0.8, v1, v2, and v3 lose support starting with the AOS and Prism Central release planned for the fourth quarter of 2026.
The v4 APIs went GA in Prism Central 7.3 and AOS 7.3. Their namespaces cover cluster management, VM management, monitoring, and networking. Vendors have had time to move. They have moved at very different speeds.
A second change is filling Nutanix estates faster than usual. Broadcom's licensing changes pushed a wave of VMware customers toward Nutanix. Plenty of teams now run AHV clusters while their monitoring stack was bought for VMware monitoring. We see that mismatch a lot right now, and three things follow from it.
Collection method became a renewal question: A tool built on v2 or v3 needs rework around your next AOS upgrade. That work lands on your team, not the vendor's.
Upgrades and monitoring became one project: Your AOS upgrade window and your monitoring setup now have to be planned together.
SNMP became the safe, shallow fallback: SNMP sidesteps the whole problem. It also costs you storage container, virtual disk, and per-VM depth.
Ask every vendor on your shortlist which API version they target today. Get the answer in writing before you sign.
What Should You Look for in a Nutanix Monitoring Tool?
Five checks settle most Nutanix monitoring reviews. Run them during a trial, because a feature page answers none of them honestly.
Confirm the Prism API version in writing: Ask which version the tool uses today, and what the plan is for the Q4 2026 cutoff. A confident vendor answers in one line.
Ask what a rebuild costs you: When a vendor moves to v4, metrics can vanish. Dynatrace dropped several in its Release 3 rewrite, and every dashboard built on them had to be redone.
Test whether VMs are first-class objects: Some tools model each VM as its own monitor. Others treat VMs as instances of the host. That decides how precisely you can alert on one workload.
Price the whole estate, not the cluster: Nutanix is rarely the only thing you watch. Add the switches, servers, and apps to the quote, because that total is what you pay.
Watch it during a node failure: Put a host into maintenance mode during the trial. Clean demos hide how a tool handles redundancy changes and VM migration.
We would park the dashboard question while you compare. Every tool here looks good in a screenshot. None of that tells you what happens when a controller VM starts adding latency at midnight. Running these checks alongside the usual virtual server monitoring habits will tell you far more.
Which Nutanix Monitoring Tool Is Right for Your Team?
Most teams land in one of five situations. The table below maps each one to a sensible starting point.
Your Situation | Start With | Why |
Nutanix sits beside network gear, servers and applications you also monitor | Motadata ObserveOps | Agentless Prism discovery, with Nutanix metrics correlated against the rest of the estate |
You run Nutanix and nothing else, and want no extra tooling | Nutanix Prism Central | Native depth, no integration to maintain, and no API version to track |
You manage many infrastructure vendors behind one dashboard | LogicMonitor | Nutanix modules already built on the Prism Central v4 API and certified by Nutanix |
Your team already lives in Datadog for cloud workloads | Datadog | Nutanix events and metrics land in the stream your team already watches |
Budget is fixed at zero and you have engineering time | Zabbix | Official Nutanix templates at no license cost, with template rework due before your next upgrade |
If two rows describe you, run both trials against the same cluster in the same week. The first two rows are the real fork. You either take a Nutanix-only view, or a unified observability platform that carries Nutanix beside every other signal you collect.
Paper comparisons flatter whoever writes the better docs. A week on your own cluster settles it faster than we could.
Pick the Best Nutanix Monitoring Tool for Your Business
Picking among Nutanix monitoring tools comes down to two questions. How does the tool talk to Prism, and what else does it watch while it is there?
The first question has a deadline on it this quarter. The second decides how many consoles your team opens during an incident.
Prism will always know your cluster best, and that is a good reason to keep it. What it cannot tell you is that the storage latency spike began at a misconfigured switch port. Most teams we work with pair native depth with virtualization monitoring across the wider estate. In our experience that is where the troubleshooting hours get saved.
FAQs
What should you monitor in a Nutanix cluster?
Watch storage capacity per tier, controller and hypervisor I/O latency, IOPS, host CPU and memory, oplog fill, and redundancy factor. Redundancy drift and controller latency are the two signals that warn you earliest.
Does Nutanix monitoring require an agent on every VM?
No. Most tools, ours included, collect agentlessly by authenticating to Prism over HTTPS and reading cluster, host, and storage data. You only need agents for guest OS and application metrics that Prism does not expose.
Can one tool monitor both Nutanix and VMware during a migration?
Yes, and one tool across both is the simpler path. We support VMware, Hyper-V, Citrix, and Nutanix as monitored infrastructure types, so a half-migrated estate stays in one console instead of two.
How often should Nutanix metrics be collected?
A 60-second interval suits most Nutanix estates, which is why several tools default near that mark. Shorter intervals help on latency-sensitive workloads. Polling Prism too hard adds load to the cluster you are protecting.
Is Motadata ObserveOps better than SolarWinds for Nutanix monitoring?
It depends on what you already own. SolarWinds goes deep on virtualization if you run Orion. We fit better when you want Nutanix, network, servers, logs, and apps on one platform instead of several licensed modules.
Author
Ramya Shah
Technical Writer
Ramya Shah is a technical content writer with a computer engineering background and roots in automotive journalism. He covers IT Service Management, observability, IT operations, and AI-driven automation. An early adopter of AI-assisted writing workflows, he turns complex IT processes into clear, engaging content optimized for search and answer engines (AEO), lifting content output and organic visibility.