All Features
Hybrid Infrastructure Monitoring
Nutanix Monitoring Support
Motadata ObserveOps offers a comprehensive solution for monitoring Nutanix environments. With real-time visibility, advanced analytics, and automated alerts, you can proactively identify and resolve issues, optimize performance, and ensure the highest levels of availability for your Nutanix infrastructure.
Introduction
Nutanix is a leading provider of Hyper-Converged infrastructure (HCI) solutions that revolutionize data center operations. By integrating compute, storage, and networking resources into a single, unified platform, Nutanix simplifies management, enhances scalability, and improves overall performance.
Effective Nutanix monitoring is crucial for ensuring optimal performance, troubleshooting issues promptly, and maximizing the benefits of this powerful technology. Traditional monitoring tools often fall short in providing the comprehensive visibility and insights required for Nutanix environments.
Motadata ObserveOps addresses this challenge by offering a comprehensive solution for Nutanix monitoring. With its advanced features and capabilities, Motadata ObserveOps empowers organizations to:
Gain deep visibility: Monitor Nutanix clusters, nodes, and virtual machines in real time.
Detect anomalies and issues: Proactively identify performance bottlenecks, resource constraints, and other problems.
Optimize performance: Make data-driven decisions to improve Nutanix’s performance and resource utilization.
Streamline operations: Automate tasks, reduce manual effort, and enhance overall efficiency.
By leveraging Motadata ObserveOps, organizations can unlock the full potential of their Nutanix infrastructure, ensuring optimal performance, reliability, and business continuity.
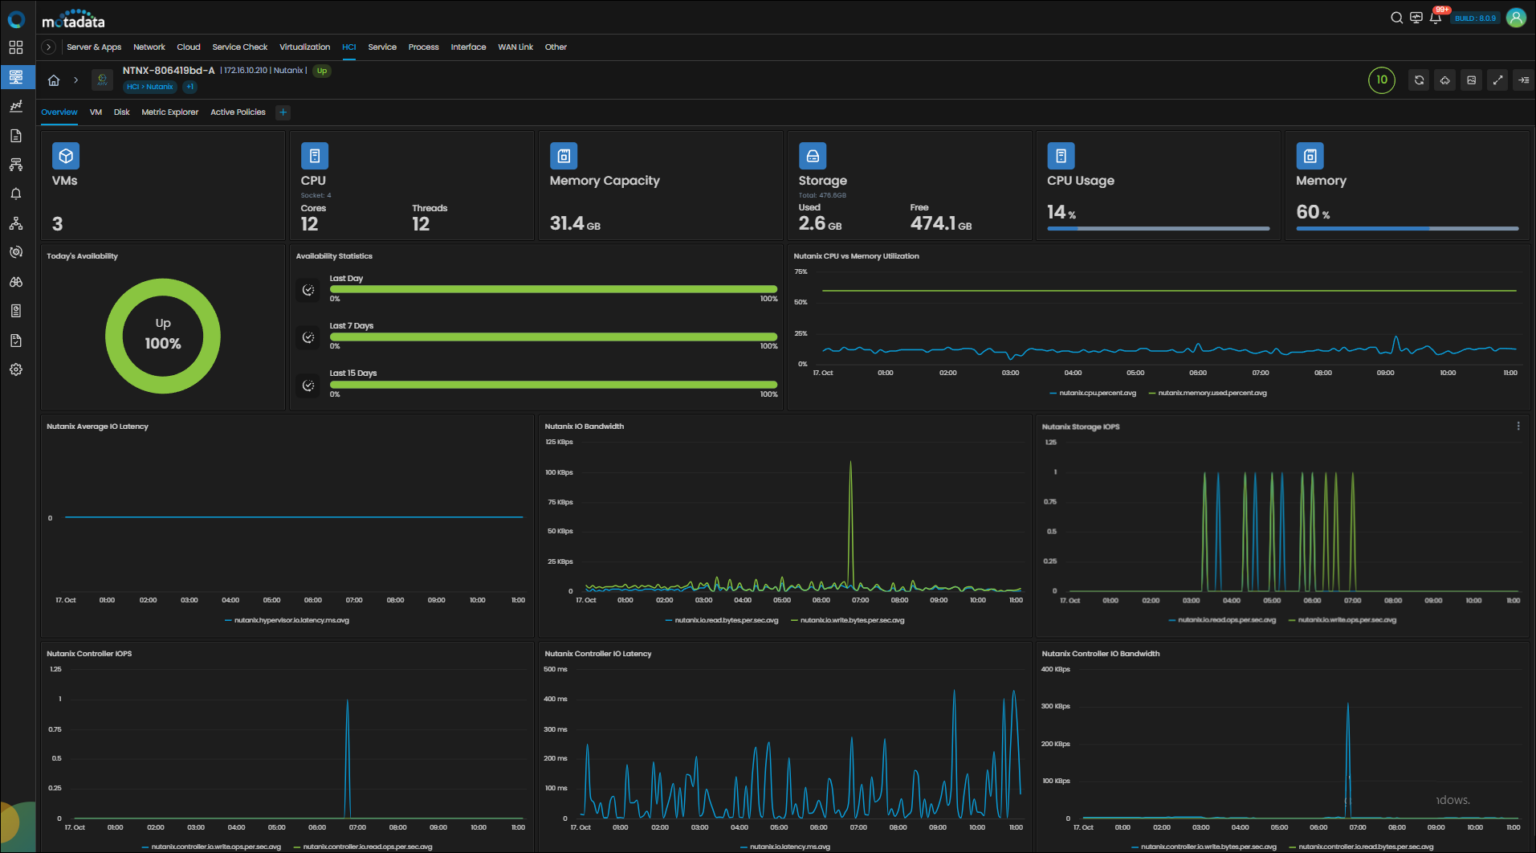
Motadata ObserveOps: Providing Granular Visibility into Nutanix Clusters, Nodes, and Virtual Machines
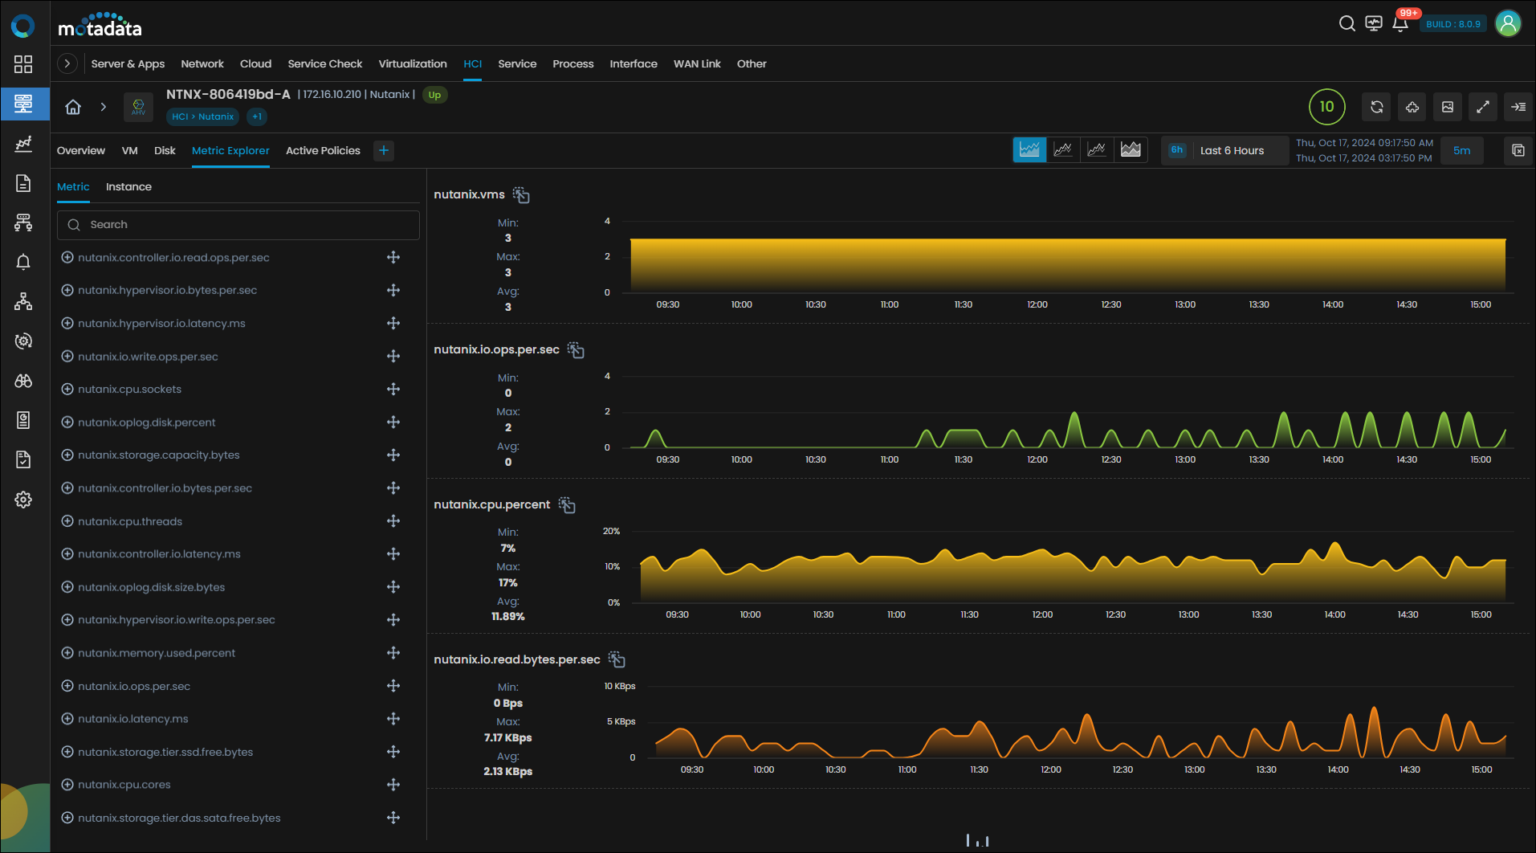
Collecting and analyzing a wide range of Nutanix metrics: Motadata ObserveOps collects data on key performance indicators (KPIs) such as CPU utilization, memory usage, storage performance, network traffic, and more. This enables you to monitor the health and performance of your Nutanix infrastructure at a granular level.
Visualizing metrics in real-time: Motadata ObserveOps presents Nutanix metrics in real-time dashboards and charts, providing a clear and up-to-date view of your infrastructure’s performance. This helps you identify issues quickly and take corrective actions.
Drilling down into specific components: You can drill down into individual Nutanix clusters, nodes, and virtual machines to view detailed performance metrics. This allows you to pinpoint specific areas where issues may be occurring.
Correlating metrics across different components: Motadata ObserveOps can correlate Nutanix metrics with other infrastructure components, such as storage arrays or network devices. This helps you identify the root causes of performance problems and take targeted corrective actions.
Customizing dashboards and reports: You can create customized dashboards and reports to focus on the specific metrics and information that is most important to your organization. This allows you to tailor the monitoring solution to your specific needs.
By providing granular visibility into Nutanix clusters, nodes, and virtual machines, Motadata ObserveOps empowers you to make informed decisions, optimize performance, and ensure the health and stability of your Nutanix infrastructure.
Key Nutanix Metrics Supported by Motadata ObserveOps
Motadata ObserveOps supports an exhaustive list of of metrics that helps you gain comprehensive visibility into your Nutanix structure. Please note, mentioned below are just a couple of key metrics and not the complete list.
Cluster Level Metrics:
Cluster Health: Overall health status of the Nutanix cluster (e.g., Up, Down, Degraded)
Capacity Utilization: Utilization of CPU, memory, storage, and network resources across the cluster
VM Count: Total number of virtual machines running in the cluster
Host Count: Number of physical nodes in the cluster
Alerts: Active and historical alerts associated with the cluster
Node Level Metrics:
Node Health: Health status of individual nodes (e.g., Up, Down, Degraded)
CPU Utilization: CPU usage for each node
Memory Utilization: Memory usage on each node
Storage Utilization: Storage capacity and utilization for each node
Network Traffic: Network traffic in and out of each node
VM Level Metrics:
VM Health: Health status of individual virtual machines (e.g., Up, Down, Suspended).
CPU Utilization: CPU usage for each virtual machine.
Memory Utilization: Memory usage by each virtual machine.
Disk I/O: Disk read/write operations for VMs.
Network Traffic: Network traffic generated by each virtual machine.
Additional Metrics:
Guest OS CPU Utilization: CPU utilization within the guest operating system of virtual machines.
Guest OS Memory Utilization: Memory utilization within the guest operating system of virtual machines.
Network Latency: Network latency between different components in the Nutanix environment.
Monitor your Nutanix Infrastructure in Real-time
Motadata ObserveOps provides real-time monitoring of Nutanix metrics, enabling you to stay informed about the performance and health of your infrastructure. This real-time visibility allows you to quickly identify and address potential issues before they escalate.
Key features:
Real-time data collection: Motadata ObserveOps continuously collects data from Nutanix clusters, nodes, and virtual machines, providing up-to-date information on key performance indicators.
Customizable dashboards: Create customized dashboards to visualize Nutanix metrics in real-time, allowing you to focus on the most important data for your organization.
Visual alerts: Motadata ObserveOps provides visual alerts on dashboards, such as color-coded indicators or flashing icons, to immediately highlight critical issues.
Threshold-based alerts: Set up custom thresholds for Nutanix metrics to trigger alerts when values exceed or fall below specified limits. This allows you to proactively monitor for potential problems.
Automated actions: Configure alerts to trigger automated actions, such as sending notifications, executing scripts, or escalating incidents to on-call teams. This streamlines your response process and reduces downtime.
By leveraging real-time monitoring and alerts, Motadata ObserveOps empowers you to:
Proactively identify issues: Detect performance problems or anomalies as they occur.
Reduce downtime: Take immediate action to address issues and prevent outages.
Improve performance: Optimize resource utilization and ensure optimal performance.
Streamline operations: Automate response processes and reduce manual effort.
Use Anomaly Detection and Predictive Analysis for Nutanix Monitoring
Motadata ObserveOps leverages advanced artificial intelligence (AI) and machine learning (ML) algorithms to detect anomalies and predict potential issues within your Nutanix infrastructure.
Anomaly Detection
Machine Learning Algorithms: Motadata employs sophisticated algorithms to analyze historical data and identify patterns that deviates from normal behavior. This enables the system to detect anomalies such as sudden spikes, sudden drops, or gradual trends in Nutanix metrics.
Real-time Analysis: The system continuously monitors Nutanix metrics and applies anomaly detection algorithms in real-time, providing immediate alerts for any detected issues.
Contextual Understanding: Motadata ObserveOps considers the context of Nutanix infrastructure and its components to accurately identify anomalies. This helps differentiate between normal fluctuations and true issues.
Predictive Analytics
Predictive Modeling: Motadata ObserveOps builds predictive models based on historical data to forecast future trends and values of Nutanix metrics. These models can predict potential resource bottlenecks, performance issues, or capacity constraints.
Proactive Planning: By anticipating future trends, organizations can proactively plan for resource allocation, capacity expansion, or optimization.
Benefits of Anomaly Detection and Predictive Analytics:
1. Proactive Problem Resolution:
By identifying anomalies and predicting potential issues early, organizations can take timely actions to prevent downtime and mitigate risks.
2. Optimized Performance:
Predictive analytics helps optimize resource allocation and identify areas for improvement, ensuring optimal performance of the Nutanix infrastructure.
3. Improved Decision Making:
The insights provided by anomaly detection and predictive analytics enable data-driven decision-making, leading to better resource management and operational efficiency.
4. Reduced Downtime:
By addressing issues proactively, organizations can minimize downtime and disruptions to business operations.
Motadata ObserveOps’ combination of anomaly detection and predictive analytics provides a powerful tool for monitoring Nutanix infrastructure, ensuring optimal performance, and driving operational excellence.
Identify Root Cause Analysis with Motadata ObserveOps
Motadata ObserveOps provides powerful tools to help you identify the root causes of performance issues or failures in your Nutanix infrastructure. Here’s how it works:
Correlation Analysis: Motadata ObserveOps can correlate Nutanix metrics with other infrastructure components, such as storage arrays, network devices, or applications. This helps you identify relationships between different factors and pinpoint the underlying cause of a problem. For example, if you see a spike in CPU utilization on a Nutanix node, Motadata ObserveOps can help you determine if it’s caused by a resource bottleneck on the storage array or a network congestion issue.
Anomaly Detection: Motadata ObserveOps uses advanced algorithms to detect anomalies in Nutanix metrics. By identifying deviations from normal behavior, you can pinpoint potential issues that may be causing performance problems.
Historical Data Analysis: Motadata ObserveOps stores historical data for Nutanix metrics, allowing you to compare current performance with past trends. This can help you identify anomalies that may be indicative of underlying issues.
Drill-Down Capabilities: Motadata ObserveOps provides drill-down capabilities, allowing you to investigate specific components and metrics in more detail. This can help you narrow down the potential causes of a problem and identify the root cause.
Automated Alerts: Motadata ObserveOps can trigger alerts when anomalies or performance issues are detected. This allows you to quickly become aware of problems and start investigating.
By combining these features, Motadata ObserveOps can help you effectively identify the root causes of performance issues and take corrective actions, reducing downtime and improving the overall health of your Nutanix infrastructure.
Leverage Customised Dashboards and Reporting
Motadata ObserveOps provides powerful customization options for creating dashboards and generating reports, allowing you to visualize Nutanix metrics in a way that best suits your needs.
Custom Dashboards:
Drag-and-drop interface: Easily create custom dashboards by dragging and dropping widgets onto the canvas.
Wide range of widgets: Choose from various widget types, such as charts, graphs, tables, and maps, to visualize Nutanix metrics in different formats.
Customization options: Customize the appearance of widgets, including colors, fonts, labels, and more, to create visually appealing dashboards.
Real-time updates: Dashboards update in real-time, providing a dynamic view of Nutanix metrics.
Sharing and collaboration: Share dashboards with other users or teams for collaboration and reporting.
Custom Reports:
Report builder: Use the built-in report builder to create custom reports based on your specific requirements.
Flexible reporting options: Choose from various report formats, such as PDF, CSV, or HTML.
Scheduling: Schedule reports to be generated automatically at regular intervals.
Data filtering and aggregation: Apply filters and aggregations to customize the data displayed in reports.
Exporting and sharing: Easily export reports for further analysis or distribution.
By leveraging custom dashboards and reporting in Motadata ObserveOps, you can:
Visualize Nutanix metrics in a way that is meaningful to you.
Create tailored reports for specific use cases.
Share insights with stakeholders and decision-makers.
Streamline your analysis and reporting processes.
Motadata ObserveOps provides a flexible and powerful reporting framework that empowers you to gain valuable insights from your Nutanix data.
Integration with Nutanix Prism Central
Motadata ObserveOps seamlessly integrates with Nutanix Prism Central, providing enhanced visibility and management capabilities for your Nutanix infrastructure. Here’s how the integration works:
Data Synchronization: Motadata ObserveOps can automatically synchronize data with Nutanix Prism Central, ensuring that both platforms have a consistent view of your Nutanix environment. This eliminates the need for manual data entry and reduces the risk of errors.
Correlated Alerts: Motadata ObserveOps can correlate alerts generated by Nutanix Prism Central with other alerts and events in your IT infrastructure. This helps you identify the root causes of issues and take more effective corrective actions.
Centralized Management: By integrating with Nutanix Prism Central, Motadata ObserveOps provides a centralized platform for managing and monitoring your Nutanix infrastructure. This simplifies your IT operations and reduces complexity.
Enhanced Visibility: Motadata ObserveOps can enrich the data provided by Nutanix Prism Central with additional metrics and insights. This provides you with a more comprehensive view of your Nutanix environment, allowing you to make informed decisions and optimize performance.
Automated Actions: You can configure Motadata AIOps to automatically trigger actions based on alerts or events generated by Nutanix Prism Central. This can help automate your IT operations and reduce manual intervention.
By integrating with Nutanix Prism Central, Motadata AIOps provides a more comprehensive and powerful solution for managing your Nutanix infrastructure. This integration enables you to:
Gain a unified view of your Nutanix environment.
Correlate alerts and events across your IT infrastructure.
Simplify IT operations and reduce complexity.
Enhance visibility and make informed decisions.
Automate tasks and workflows.
Motadata ObserveOps’ integration with Nutanix Prism Central empowers you to get the most out of your Nutanix investment and optimize your IT operations.
Scalability and Performance
Motadata ObserveOps is designed to handle large-scale Nutanix environments, ensuring that it can effectively monitor and manage your infrastructure regardless of its size or complexity. Here’s how Motadata ObserveOps delivers exceptional scalability and performance:
Scalability:
Horizontal scalability: Motadata ObserveOps can be easily scaled horizontally to accommodate growth in your Nutanix infrastructure. By adding more monitoring nodes, you can handle increased workloads and data volumes without compromising performance.
Distributed architecture: Motadata ObserveOps is designed with a distributed architecture, ensuring high availability and redundancy. This helps prevent single points of failure and ensures that your monitoring solution remains resilient.
Large-scale data handling: Motadata ObserveOps can efficiently handle large volumes of data, allowing you to monitor and analyze even the most complex Nutanix environments.
Performance:
Real-time monitoring: MotadataObserveOps provides real-time monitoring of Nutanix metrics, enabling you to detect issues and take corrective actions promptly.
Low latency: Motadata ObserveOps is designed to minimize latency, ensuring that you receive timely and accurate data.
High performance: Motadata ObserveOps can handle large numbers of metrics and data points without sacrificing performance.
Optimized for Nutanix: Motadata ObserveOps is specifically optimized for Nutanix environments, ensuring efficient data collection and analysis.
By leveraging Motadata ObserveOps’ scalability and performance capabilities, you can:
Monitor large-scale Nutanix environments effectively.
Ensure high availability and reliability.
Gain real-time insights into your infrastructure’s performance.
Make informed decisions and optimize resource utilization.
Motadata ObserveOps is a powerful and scalable solution that can handle the demands of even the largest Nutanix environments, providing you with the insights and tools you need to optimize your infrastructure and achieve your business objectives.
Conclusion
Motadata ObserveOps offers a comprehensive and unified solution for monitoring Nutanix environments, providing numerous benefits:
Enhanced Visibility: Gain deep visibility into your Nutanix infrastructure, including clusters, nodes, and virtual machines.
Real-time Monitoring: Monitor Nutanix metrics in real-time to detect issues promptly and take corrective actions.
Anomaly Detection: Proactively identify anomalies and potential problems using advanced AI/ML algorithms.
Predictive Analytics: Forecast future trends and anticipate resource needs to optimize performance.
Root Cause Analysis: Pinpoint the underlying causes of performance issues for targeted resolution.
Custom Dashboards and Reporting: Create tailored dashboards and reports to visualize Nutanix metrics and gain valuable insights.
Integration with Nutanix Prism Central: Leverage a unified platform for enhanced management and visibility.
Scalability and Performance: Monitor large-scale Nutanix environments with high performance and scalability.
Automated Actions: Streamline operations with automated actions triggered by alerts.
By using Motadata AIOps, you can:
Improve performance and reliability: Optimize resource utilization, reduce downtime, and ensure optimal performance.
Make data-driven decisions: Gain valuable insights to make informed decisions about your Nutanix infrastructure.
Enhance operational efficiency: Automate tasks, reduce manual effort, and streamline your IT operations.
Proactively address issues: Identify and resolve problems before they impact your business.
To learn more about how Motadata ObserveOps can benefit your Nutanix environment, request a demo today!
Ready to implement Nutanix Monitoring Support?
Discover how Motadata AIOps can help you monitor your infrastructure in real-time and respond to issues instantly.