How Traceroute Works and How to Read Its Output During an Outage
Users report that an internal application has gone slow, the server dashboards look normal, and the network group says nothing changed on their side. So where between the user and the application does the time actually go?
Much of that answer comes from traceroute. The command lists every router a packet crosses on the way to its destination, with a timing figure set against each one. Arguments about ownership then come down to a single device on a single route.
Every major operating system has shipped it for decades, and most IT professionals have typed it at least once. Confidence in reading the result is rarer, which is how network troubleshooting ends up built on a misread screen. Alarming traces are frequently harmless, while a tidy-looking one can hide a saturated link.
In this blog, you will see how traceroute behaves at the packet level, the way to run it on Windows, Linux and macOS, what every column of the output means, the situations where it misleads, the reasons path problems stay open far longer than they should, and how continuous path observability carries on once the command stops.
What Is Traceroute and What Does It Do?
Traceroute is a network diagnostic command that maps the route a packet takes from your machine to a destination host, then measures the round-trip time to each device along the way. Every forwarding device on that route counts as a hop, and each hop is a network node carrying its own address. What comes back is an ordered hop list with timings printed beside it.
Three spellings describe the same idea. Linux and macOS ship traceroute, Windows ships tracert, and a good deal of documentation splits it into trace route as two words. Some network operating systems shorten it to trace.
One run of the traceroute command returns four things:
Path shape: How many hops separate you from the destination and roughly where they are
Ownership boundaries: Which hops belong to your network, your provider, and the wider internet
Per-hop latency: How much time each leg of the path adds to the total
Failure point: Where responses stop coming back entirely
The failure point needs the most care of the four. A traceroute that stops responding halfway does not always mean traffic stopped there, and the section on reading output explains why.
Traceroute, Ping and Continuous Path Monitoring
Three tools get used for the same class of problem, and they answer different questions. The table below sets out what each one is good for.
Tool | Question it answers | What it cannot tell you |
Ping | Is the destination reachable, and what is the round-trip time | Which device on the path is responsible for the delay |
Traceroute | Which routers carry my traffic, and what does each one add | What the path looked like an hour ago, or how it behaves under load |
Continuous path monitoring | How the path and its latency behave over time, across every monitored route | Anything about paths it has not been configured to watch |
Ping confirms whether something is alive. Traceroute names the slow segment of the journey. Whether that segment has always been slow comes from continuous path data, and the answer decides between a configuration change and a purchase.
How Does Traceroute Work?
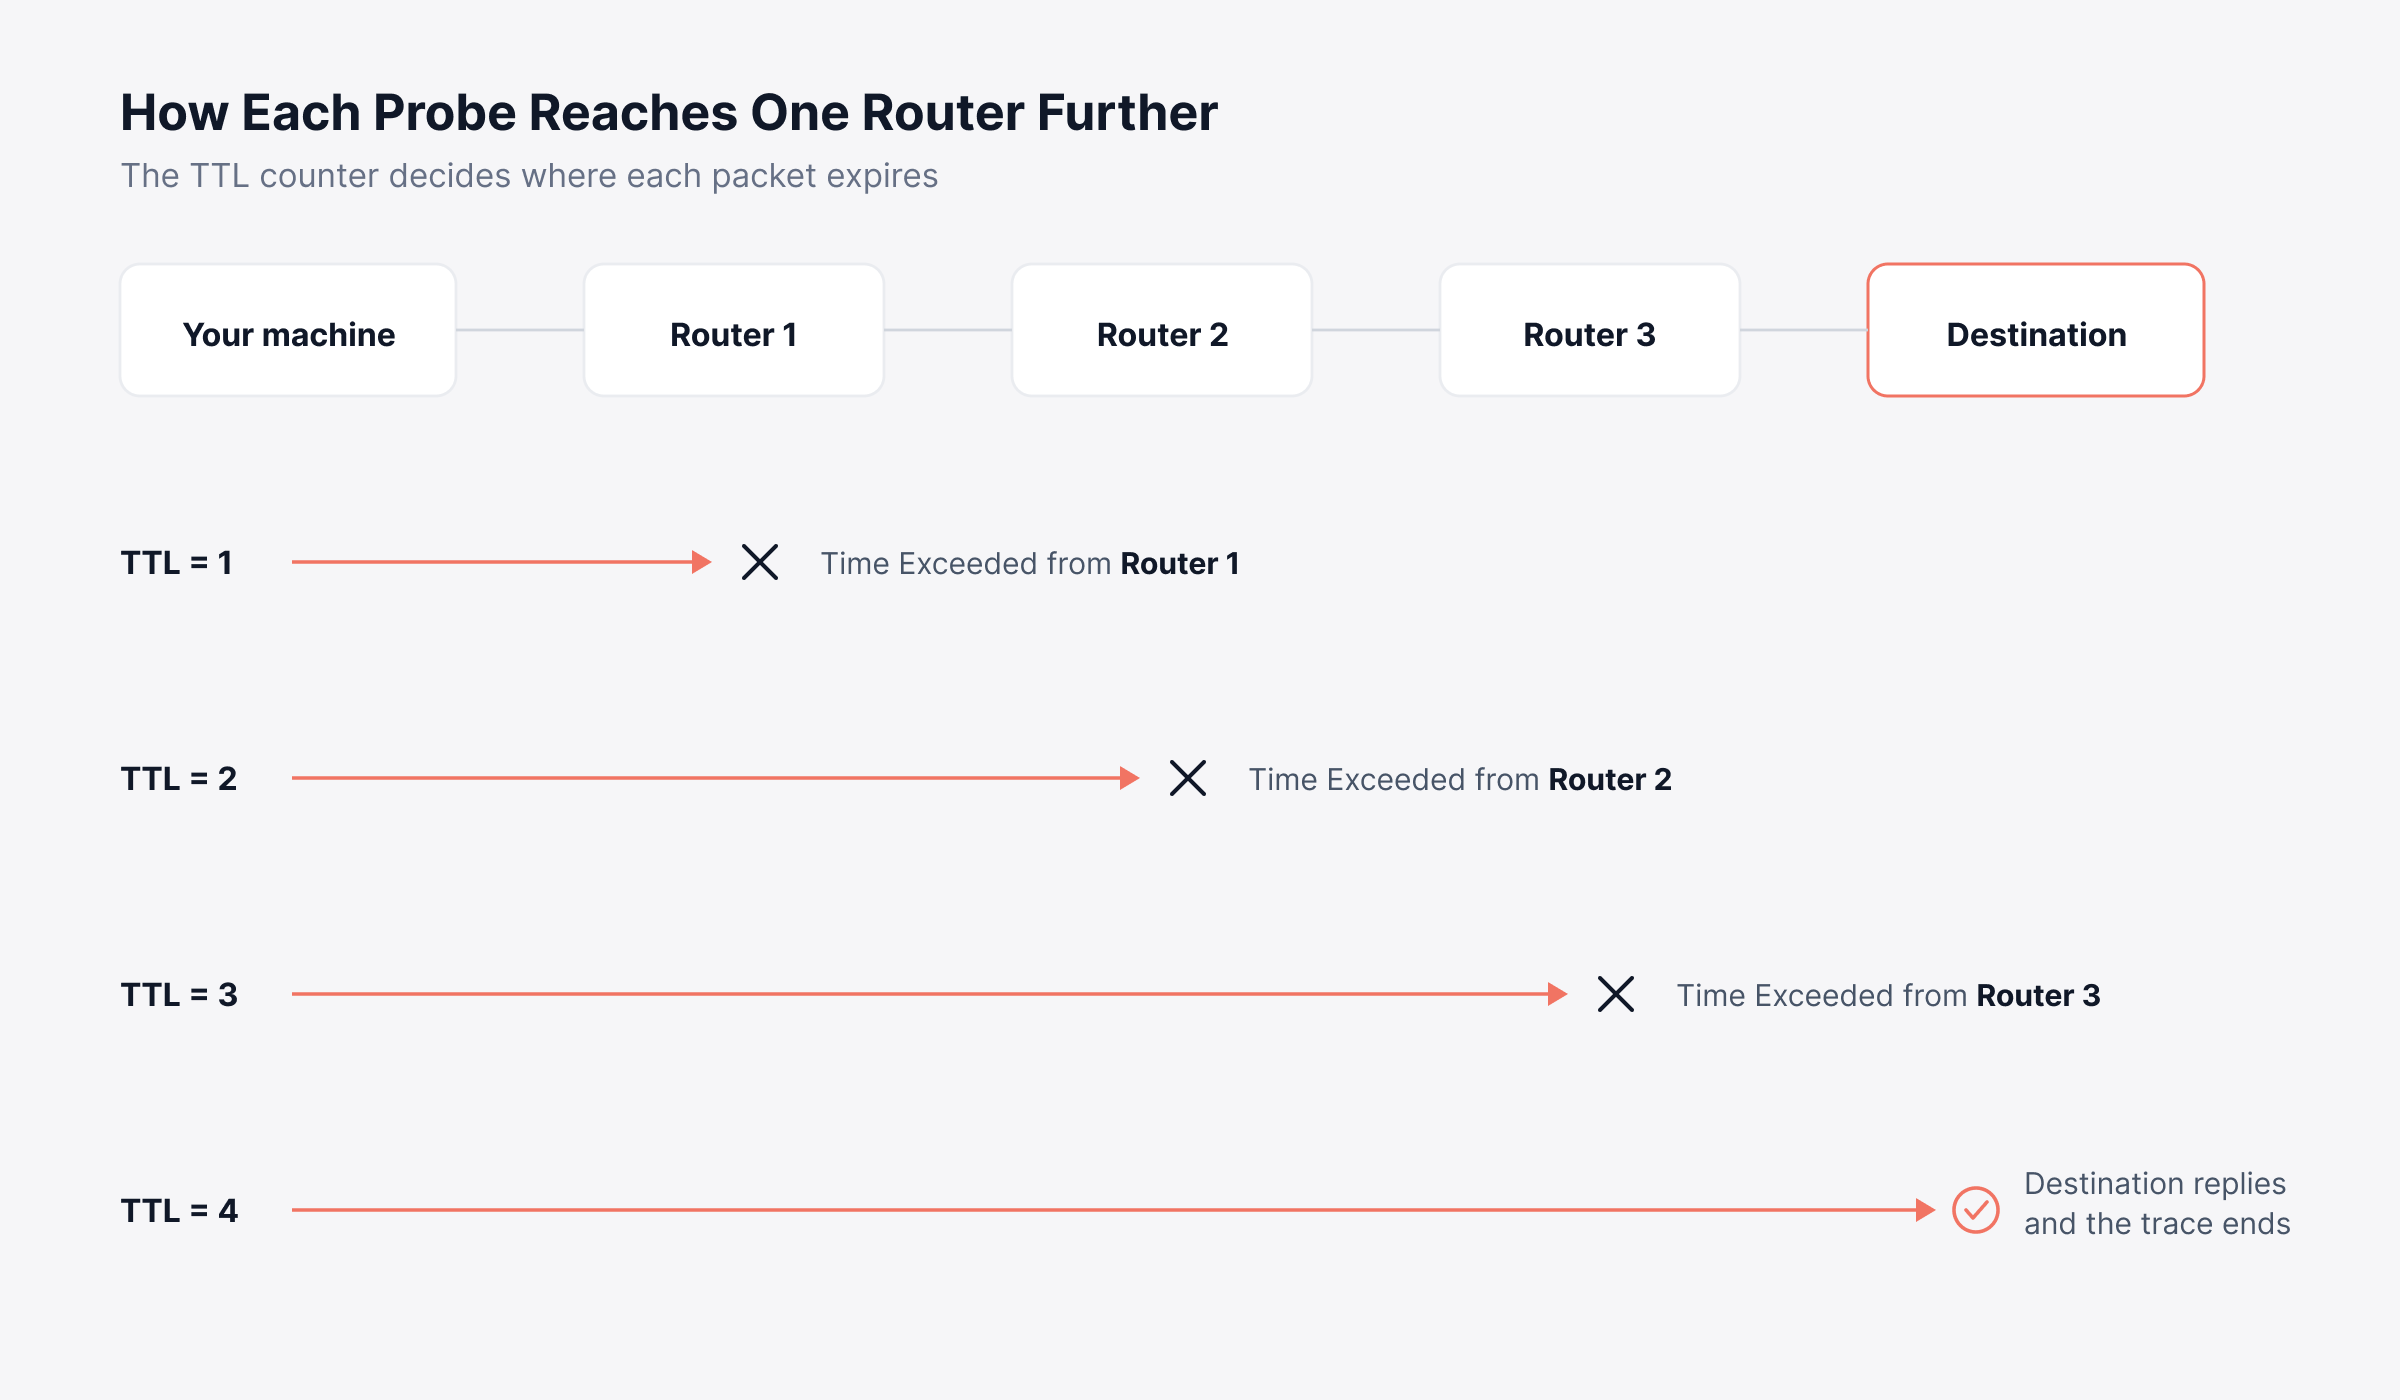
Traceroute works by sending packets built to expire before they arrive. The Time to Live field, known as TTL, travels in every IP packet as a hop counter. Routers subtract one from it as they forward, and whichever router brings it to zero throws the packet away and reports back.
That reply is what traceroute collects. An ICMP Time Exceeded message goes back from the discarding router, carrying that router's own IP address.
A single traceroute run moves through four steps:
First probe: The command sends a packet with TTL set to 1. The first router decrements it to zero, drops it, and returns a Time Exceeded message revealing hop one
Increment: The command sends the next packet with TTL set to 2, which survives the first router and expires at the second, revealing hop two
Repeat: TTL keeps incrementing by one until the packets reach the destination host
Termination: The destination replies differently, with an ICMP Echo Reply on Windows or an ICMP Port Unreachable on most Unix systems, and the trace ends
Each TTL value gets three probes by default, so every output line carries three timing figures. Three samples show the variance at that hop, where one sample might simply have been unlucky. All of it rests on standard network protocols behaving consistently across every device in the path.
Probe type varies by platform, and that variation often decides whether a trace completes at all. ICMP Echo Requests go out from Windows tracert. Linux and macOS default to UDP datagrams aimed at high-numbered ports the destination is unlikely to be using, which provokes the Port Unreachable reply at the end.
Firewall policy commonly treats ICMP and UDP as separate cases, which is why a trace failing on one platform can succeed on another. The sequence below follows the TTL counter as it walks the path hop by hop.
Firewall policy commonly treats ICMP and UDP as separate cases, which is why a trace failing on one platform can succeed on another. The sequence below follows the TTL counter as it walks the path hop by hop.
How to Run a Traceroute on Windows, Linux and macOS
Running a traceroute takes a single line in a terminal on any platform, with the command name and the flags as the only differences. Open a command prompt or terminal, enter the command, and follow it with a hostname or an IP address.
Traceroute on Windows
The traceroute Windows equivalent, tracert, runs in Command Prompt and PowerShell without any installation.
tracert www.example.com
tracert -d 203.0.113.45
tracert -h 15 www.example.com
Skipping reverse DNS lookups with -d speeds the trace up noticeably when name resolution drags. Windows also ships pathping, a command that pairs a trace with a longer packet-loss sample at every hop.
Traceroute on Linux
The Linux traceroute binary arrives preinstalled on most distributions. Where it does not, the standard repositories carry the traceroute package.
traceroute www.example.com
traceroute -I www.example.com
traceroute -n -q 5 203.0.113.45
Switching from UDP probes to ICMP with -I frequently gets a trace past a firewall that drops UDP. Add -n to traceroute Linux commands to suppress DNS resolution, and -q to change how many probes go to each hop. Many distributions also carry mtr, which repeats the trace continuously and reports loss per hop in a live view.
Traceroute on macOS
macOS carries the same underlying command as Linux, so the syntax matches almost exactly. The graphical Network Utility was removed from recent releases, so the terminal is the reliable route.
traceroute www.example.com
sudo traceroute -I www.example.com
Knowing how to use traceroute well comes down to the flags, because default behavior is rarely what you want during an incident. The table below covers the ones worth knowing.
Flag | Windows | Linux and macOS | What it changes |
Skip DNS lookup | -d | -n | Returns raw IP addresses and speeds up the trace |
Set max hops | -h | -m | Stops the trace early instead of running to the hop limit |
Change probe type | Not available | -I, -T | Switches to ICMP or TCP probes to get past filtering |
Change probe count | Not available | -q | Increases samples per hop for a better latency picture |
Set wait time | -w | -w | Controls how long to wait before marking a probe as lost |
How Do You Read Traceroute Output?
Read traceroute output one line at a time. Each line is a single router reporting on its own leg of the path, and the timings read together show where the delay builds up. A typical Linux run against an application host looks like this.
traceroute to app.example.com (203.0.113.45), 30 hops max, 60 byte packets
1 gateway (192.168.1.1) 1.204 ms 1.118 ms 1.093 ms
2 10.55.0.1 (10.55.0.1) 3.812 ms 3.744 ms 3.901 ms
3 ae-4.border1.isp.net (198.51.100.9) 8.221 ms 8.410 ms 8.377 ms
4 * * *
5 ae-11.core2.isp.net (198.51.100.62) 9.014 ms 8.998 ms 9.220 ms
6 peer-a.transit.net (203.0.113.2) 74.556 ms 74.201 ms 74.633 ms
7 app.example.com (203.0.113.45) 75.112 ms 74.880 ms 75.402 ms
Every line carries four elements:
Hop number: Position in the path, counting outward from your machine
Hostname: Reverse DNS name of the responding router, where one is published
IP address: The address that answered, which you can trace IP ownership for with a WHOIS lookup
Three timings: Round-trip time for each of the three probes sent at that TTL
Three reading rules cover most of what the output is telling you:
Read the total, then find the jump: Hop 6 adds 65 milliseconds to the path above, and hops 1 through 5 add almost nothing between them
Confirm the jump persists: A latency increase that continues on every subsequent hop reflects a genuine cost on the path, which is what happens at hop 6 and carries through to hop 7
Judge each hop against its neighbors: A hop reporting 300 ms while the hop after it reports 40 ms tells you about that one router's reply behavior, and says nothing about the path
Hostnames are worth reading closely. Provider naming conventions often encode the city, the interface and the role of the device, so a name change between hop 3 and hop 6 usually marks the point where traffic left one network and entered another. Compared with your own network metrics, those names show which organization to approach first.
What Do Common Traceroute Results Actually Mean?
Common traceroute results have plain explanations, and the alarming ones are frequently benign. Four patterns account for most of the confusion.
Asterisks and Request Timed Out
Asterisks mean the probe drew no reply inside the timeout window. Plenty of routers ignore or rate-limit ICMP Time Exceeded messages to protect their own CPU and reduce exposure, and firewalls drop these replies as a matter of course at organizational boundaries.
The distinction that matters: If asterisks appear at one hop and normal replies resume afterwards, traffic passed through that device without difficulty. If asterisks continue all the way to the hop limit, the path genuinely breaks at the last responding device.
Traces to applications hosted in a public cloud, Amazon Web Services among them, commonly show asterisks across the last few hops. The provider's internal network withholds those replies while the application itself responds normally.
A Latency Spike That Disappears at the Next Hop
A hop that shows high round-trip time while later hops show low times means that router was slow to answer your probe. The link running through it may be carrying production traffic normally.
Generating ICMP replies is a low-priority task for a busy core router, so the reply waits behind real work. Only a delay that persists across every following hop indicates a genuine contributor to latency.
The 30 Hops Limit in Traceroute
The 30 hops in traceroute output is the default maximum TTL value, there to stop the command running forever against an unreachable destination or a routing loop. Under 20 hops covers almost every internet destination, so a trace that reaches 30 has usually failed somewhere along the way. Raise the ceiling with -m on Linux or -h on Windows where the path is genuinely deep.
Where Private Addresses Turn Into Public Ones
The early hops of most traces show private RFC 1918 addresses, which belong to your own network. The transition to public addressing marks your edge, and everything after that belongs to a provider. Knowing exactly where that boundary falls saves an escalation to the wrong group.
Where Does Traceroute Fall Short?
Traceroute falls short in exactly the incidents where people reach for it most. The tool was designed as a diagnostic probe, and it makes several assumptions that modern networks break.
The return path is invisible: Each hop's reply travels back by whatever route its own routing table prefers, so the timing you see blends a forward path and a return path you cannot observe
Load balancing splits the picture: Equal-cost multipath routing, which spreads traffic across several links of equal cost, sends consecutive probes down different physical links, so one trace can interleave hops from two paths and produce timings that never occurred together
Tunnels hide the middle: MPLS and similar carrier techniques wrap your traffic inside their own, and can carry a packet across several devices that never decrement the TTL in a visible way, collapsing a long segment into what looks like one hop
One trace is one moment: Congestion that appears only under peak load leaves nothing behind if you run the command after the problem has passed
Route changes go unrecorded: A provider can reroute your traffic across a longer path, and the only evidence is a trace someone happened to run before the change
No application context: The command reports network transit and says nothing about server processing, database calls or the encrypted handshake between the two ends, which frequently hold the actual delay
The practical consequence: A traceroute is evidence, and it is rarely proof. It narrows the search area, and confirming a cause needs data collected over time from the devices themselves. That is why network performance metrics collected continuously carry more weight in a post-incident review than any single command output.
Why Do Path Problems Stay Open Longer Than They Should?
Path problems stay open because the evidence needed to close them expires the moment the slowness stops. The cost runs far past the minutes of slowness users report, and it builds up in four places no dashboard shows.
Time spent proving ownership: Application, server and network specialists each rule their own domain out, and the hours between the first ticket and the correct owner are usually the longest part of the outage
Contract commitments left unclaimed: Service credits and carrier escalations depend on documented evidence across a defined window, and one screenshot rarely qualifies
Repeat incidents: A problem closed as no fault found returns, and each recurrence restarts the same investigation with the same people
Capacity spend made on anecdote: Circuit upgrades get approved on the strength of one memorable bad afternoon, and the recurring cost continues whether or not it addressed anything
Take a distribution company whose order system slows for the same regional sites every few weeks. Each ticket closes as no fault found because the slowness clears before anyone reaches the network group, and the third recurrence ends with an approved circuit upgrade that changes nothing.
Almost nobody outside the network function wants a hop list. They want three answers: Whether this is ours or the carrier's, how long it has been going on, and what fixing it costs.
What Each Traceroute Finding Tells You to Do Next
Every line of a trace maps to a decision, and the decision is usually about who acts and who pays. The table below sets out the four findings that come up most often.
What the trace shows | What happens next |
Latency rises at the first carrier hop and stays high | The delay starts where our responsibility ends, so this becomes a carrier ticket |
Latency rises inside our own address range | The cause is internal, and it gets fixed without waiting on a third party |
Path length changed between two traces | Traffic is taking a longer route, which is a routing question for the carrier |
Timeouts at one hop, normal replies afterwards | Nothing is wrong at that point, and chasing it wastes the investigation |
Carriers move faster on a documented pattern than on a single trace, which means the collection has to be running before the incident starts.
How Do You Turn a Traceroute Into Continuous Path Visibility?
Turning traceroute into continuous visibility means collecting the same class of evidence on a schedule, from every location that carries production traffic, and keeping the history. A command run during an incident tells you what the path looks like now. A monitored path tells you what changed, which is the question that ends the investigation.
The table below maps each limitation of the manual command to what an observability platform adds.
Limitation of a manual trace | What continuous path observability adds |
One sample from one machine | Scheduled checks from every monitored location, kept as history |
No record of the previous path | Route change detection that flags deviation from the established path |
Single path visible per run | Multi-path tracking across the routes traffic can take |
Timing only, with no device context | Per-hop performance and packet loss gathered over intervals |
No link to what changed | Anomalies correlated with configuration changes on the devices involved |
Someone has to notice and run it | Severity-coded alerts raised on the affected hop or path |
None of that takes the command out of the toolkit. It means the answer is already on hand when somebody asks how long the problem has been running and what it has cost so far.
What Does Path Observability Look Like Inside Motadata ObserveOps?
Path observability inside Motadata ObserveOps runs at three levels, from an on-demand check through to a continuously analyzed path with its own history. Each level answers a different question during an incident.
Running a Traceroute From the Nearest Collector
The Traceroute utility runs from the collector, the component that polls devices in a given location, out to any target address or hostname. You set the maximum hops and the timeout per hop before running it, and results return as a hop list with addresses and response times.
Running from the collector nearest a site matters, because a trace launched from a laptop at headquarters describes a path the affected users never take. The same timeout caution applies here as in a terminal, since asterisks at an intermediate hop mean nothing when the hops after it respond normally.
Attaching Traceroute Output to an Alert
The Trace Route runbook, a saved action the platform runs on its own, automates the check without any scripting. It gets assigned to an individual monitor, a group of monitors, or an address that has not been onboarded as a monitor at all, with configurable hop limits, probe counts and timeout.
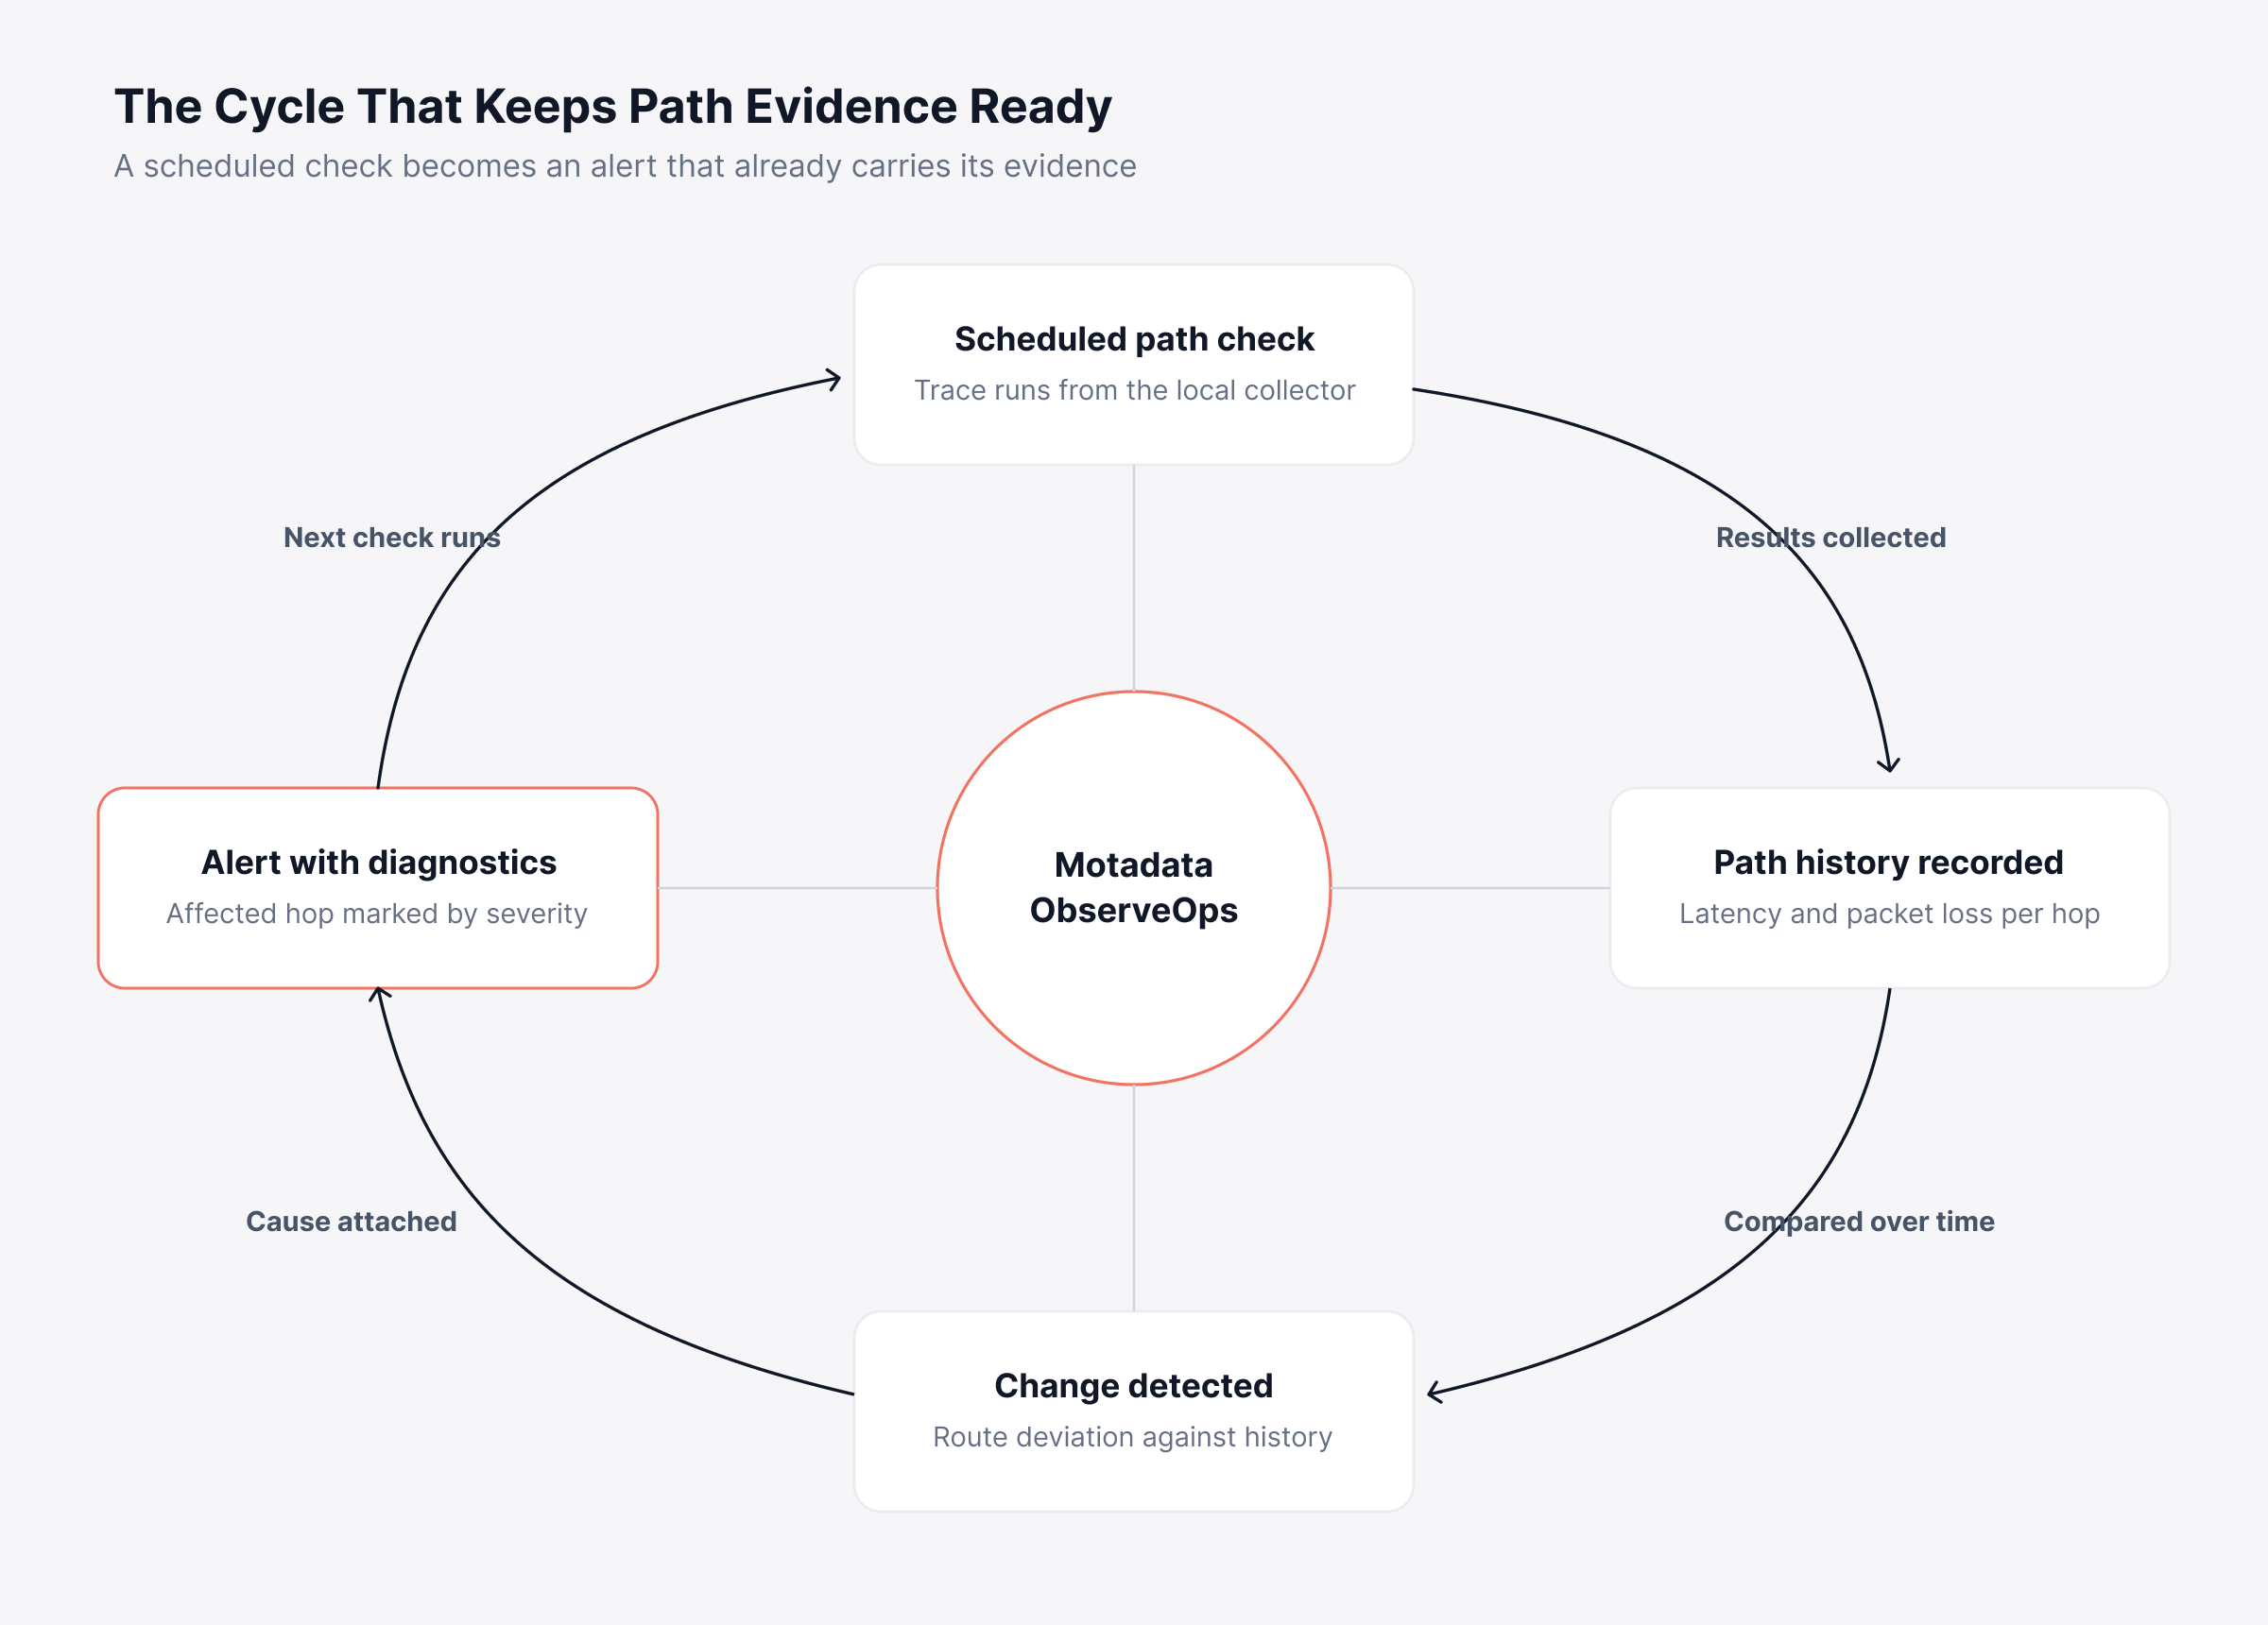
Output returns the hop count, the round-trip time and the destination address. Because runbooks can be triggered by an alert, a policy threshold or a schedule, the diagnostic arrives attached to the alert instead of waiting for someone to open a terminal.
Watching the Path Continuously With NetRoute
NetRoute carries out path analysis as an ongoing function instead of a one-off command. It presents a path-based view of the route, highlights the active path, and tracks the alternatives traffic can take across multiple routes.
The capabilities that address the limitations listed earlier:
Route change detection: Identifies deviation from the established path, so a provider rerouting your traffic surfaces as an event
Hop-by-hop performance analysis: Evaluates each hop against accumulated data to locate bottlenecks, with packet loss tracked alongside latency
Path history: Keeps availability and latency for the path at regular intervals, which is the evidence a carrier escalation needs
Correlation with configuration changes: Ties performance anomalies to changes made on the devices involved
Severity-coded alerts: Marks the affected hop or path and notifies through existing channels
Around that path view, the platform collects what no trace can see. Network flow analysis across NetFlow, sFlow, jFlow and IPFIX names the conversations filling a congested link. Auto-discovered network topology maps, built from the discovery protocols switches use to announce their neighbors, show the structure the path runs through, and device metrics record packet loss, CPU load and interface errors on the hops you own.
Consider a common scenario. Users in a branch office report slow application response, a trace from the local collector shows a large latency increase at the provider handoff, and nothing on the branch switches looks unusual. Flow data for the same window shows a backup job saturating the branch uplink, which explains the trace and the complaints without a call to the carrier.
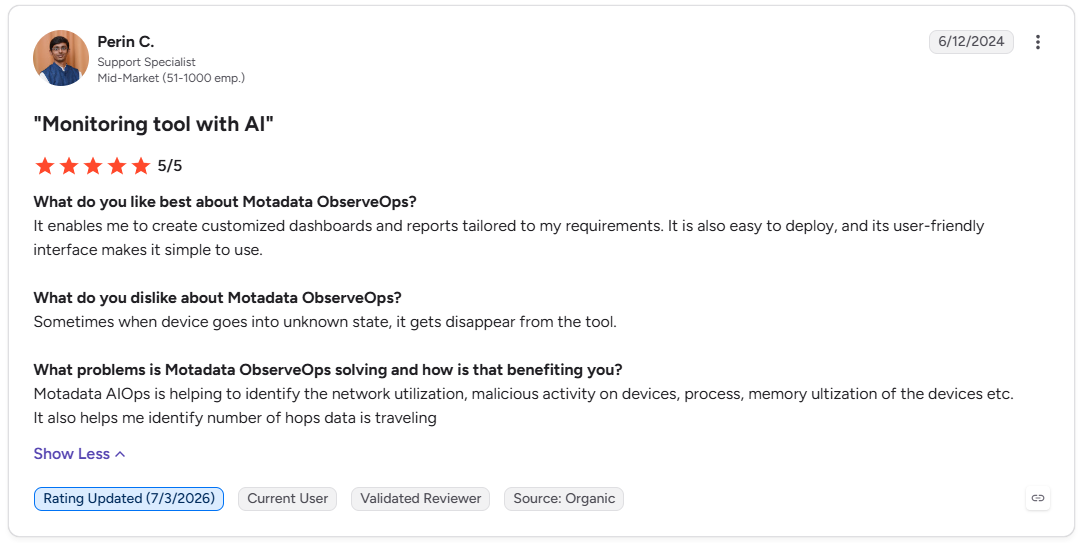
This is what one of our clients says about Motadata ObserveOps on G2.
The value shows up at handover, when an engineer sends a provider a documented pattern instead of one command output. The flow below sets out how a scheduled check becomes an alert that already carries its evidence.
When Should You Run a Traceroute During an Incident?
Run a traceroute once the destination is confirmed reachable, and before anything gets escalated outside your organization. Reaching for it as the opening move tends to produce a screenful of numbers with no context to interpret them against.
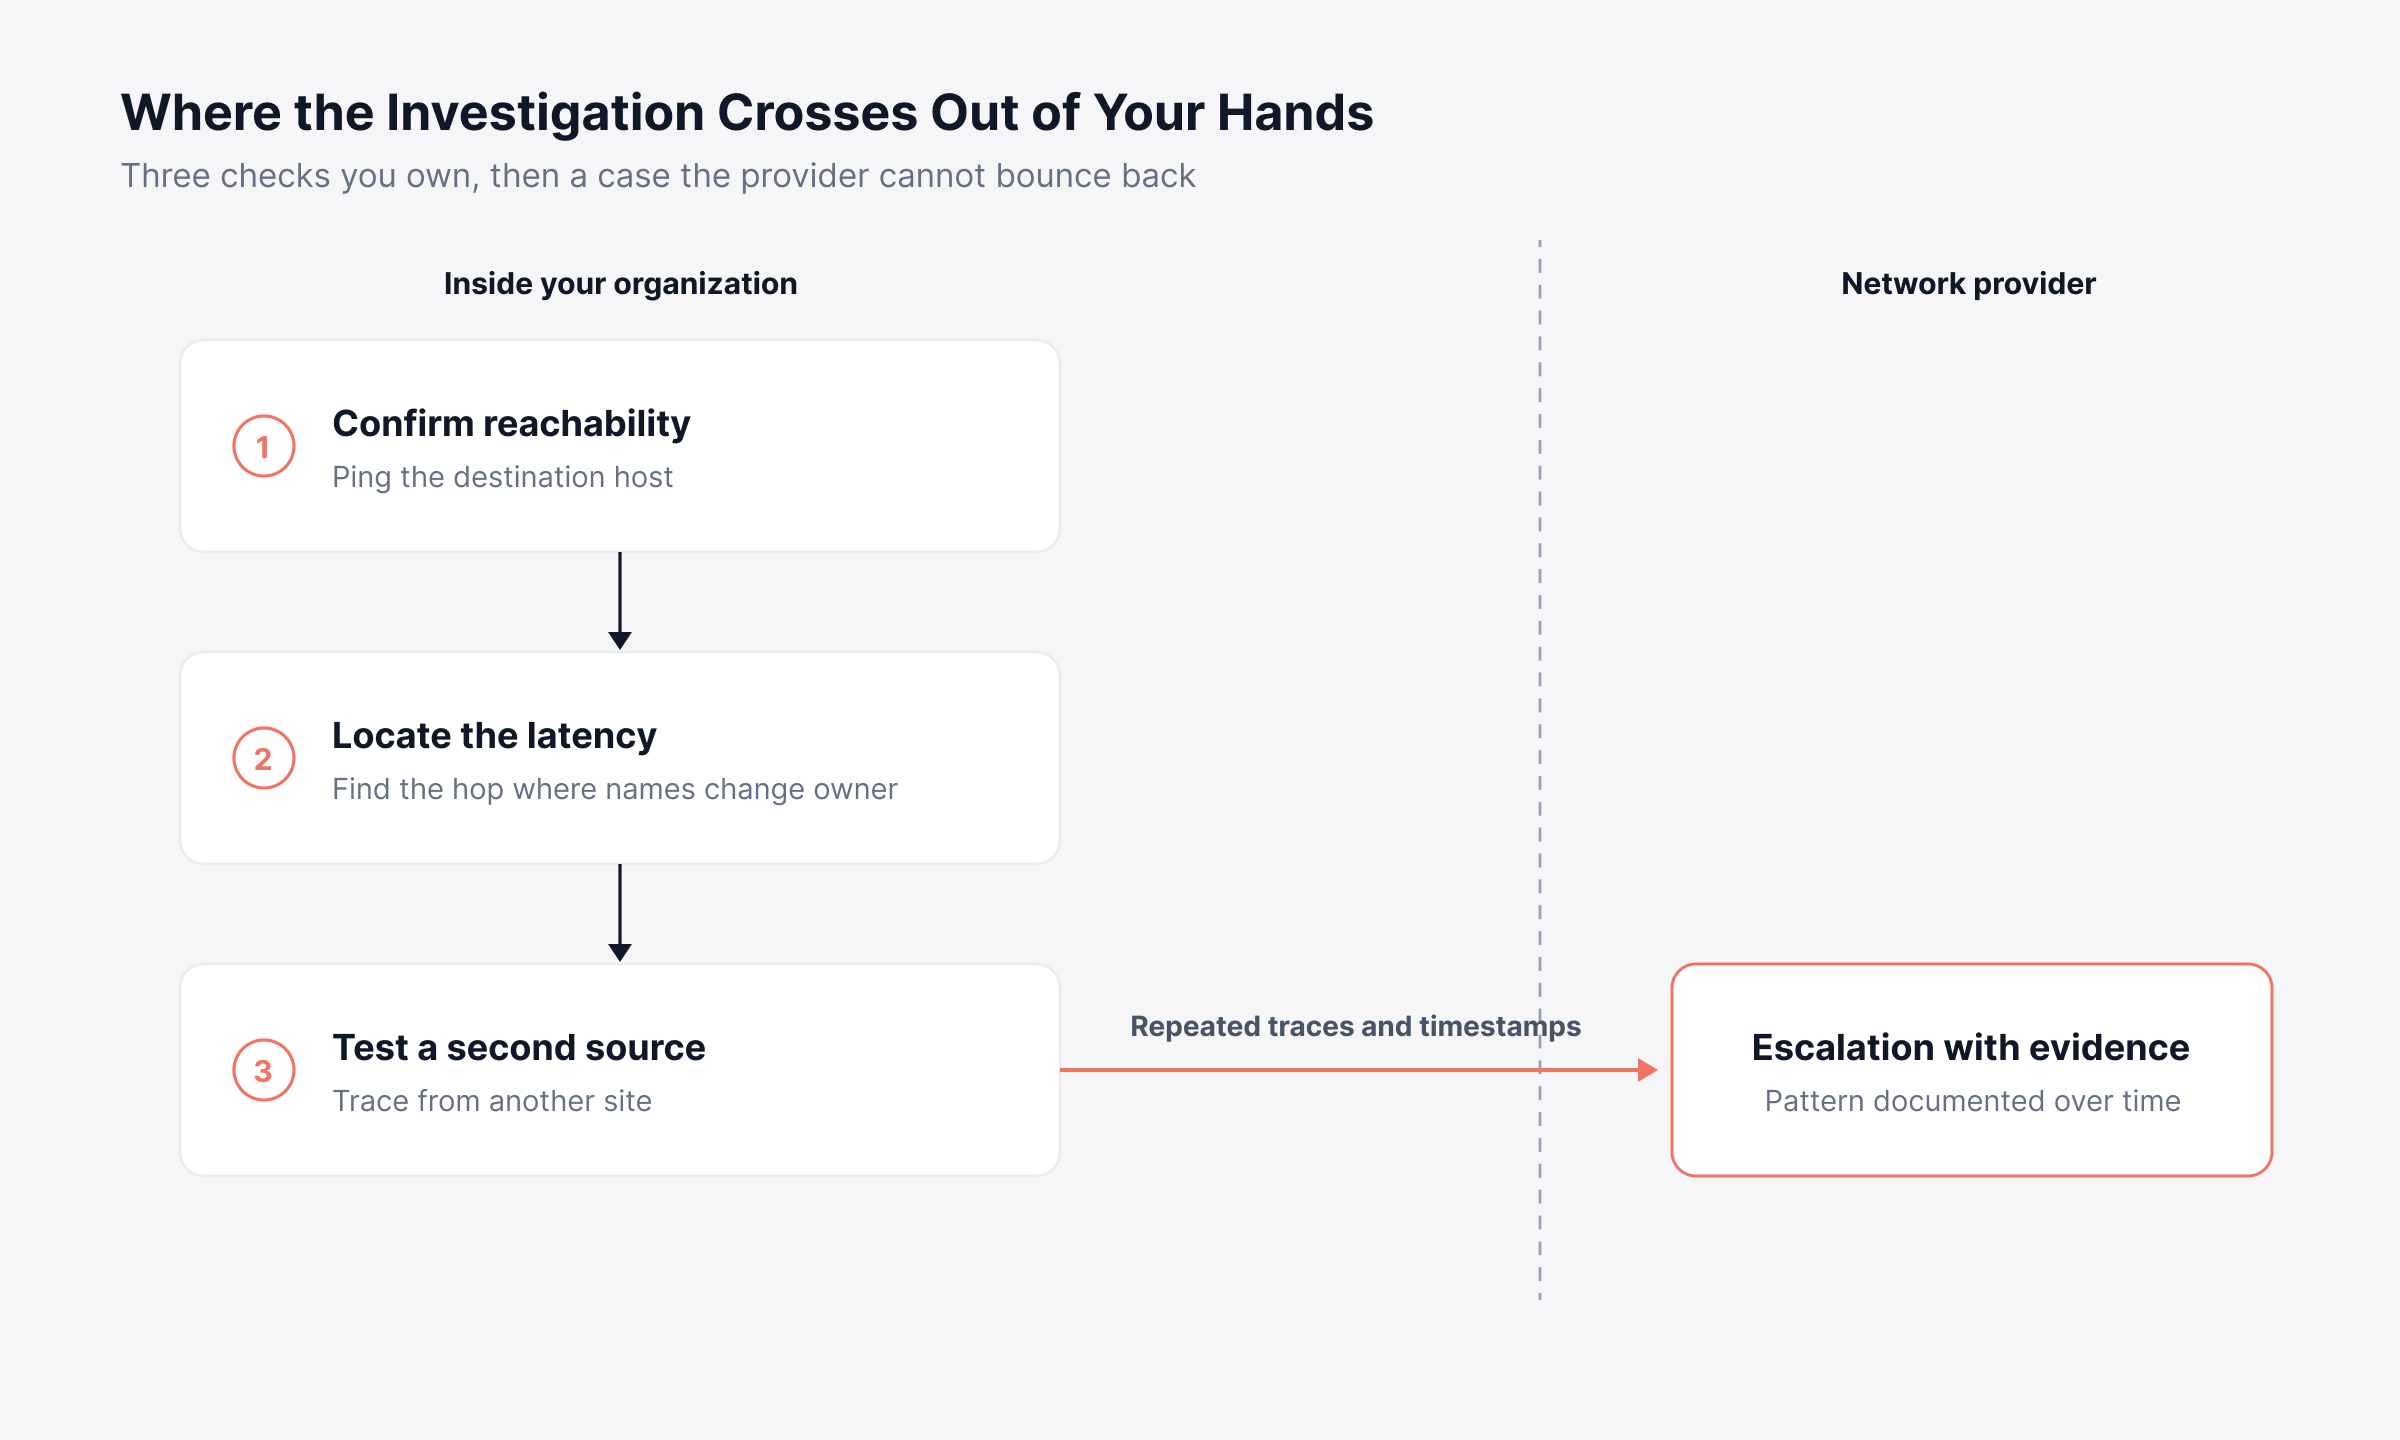
One workable order of operations:
Confirm reachability: Ping the destination to establish whether the problem is availability or performance
Trace the path: Run traceroute to locate where latency accumulates, and note the hop where hostnames change ownership
Trace from a second location: Run the same trace from another site, a cloud instance or a browser-based traceroute service to separate a local problem from a wider one
Repeat over time: Run the trace several times across the window when users report problems, since one sample proves very little
Escalate with evidence: Send the provider the traces, the timestamps, the source and destination addresses, and the pattern you observed
Most investigations stall at step 4, since nobody keeps repeating a command across several sites for long. It is also the step that proactive monitoring removes entirely.
Providers respond faster to a documented pattern than to a single trace, so the collection needs to be running already. The sequence below separates the checks you own from the point where the case leaves your hands.
Two related measurements belong in the same investigation. Variation in packet delay, measured as jitter, degrades voice and video long before average latency looks bad.
Sustained network congestion on one interface produces symptoms a trace can locate but not explain. It is one of the hidden causes behind outages that get closed as no fault is found.
Move From One-Off Traceroutes to a Path You Can Watch with Motadata ObserveOps
For a first look at a path, traceroute is still the fastest option, and no observability platform removes the need for it. Running the command still answers a question nothing else answers as quickly: what is happening on this path right now. The reading rules in this article apply whether the output comes from a terminal or a console.
What the command cannot give you is history, coverage or context. It watches one path from one machine at one moment, and it says nothing about the interface counters, traffic mix or configuration changes behind the number it reports. Investigations stall at that boundary, and they stall again the next time, because nobody was collecting the evidence needed to close them.
Motadata ObserveOps collects it continuously. Path history and route change detection stand behind every alert, trace output arrives without anyone opening a terminal, and flow and topology data explain what the path figures alone cannot.
The trace then becomes the opening step of an investigation that reaches a conclusion, instead of standing in for the whole of it. A recurring argument between IT groups ends as a closed ticket. If you are still assembling the foundations, the monitoring basics come first.
FAQs
How do you use traceroute?
Open a terminal or command prompt and type the command followed by a hostname or IP address. Windows uses tracert and Linux and macOS use traceroute. Add a flag to skip DNS resolution if the trace runs slowly.
What is traceroute and how does it work?
Traceroute maps the routers between your machine and a destination by sending packets with an increasing Time to Live value. Each router that discards an expired packet reports its own address back. The command records those replies in order along with round-trip times.
Is it safe to run a traceroute?
Running a traceroute is safe and generates very little traffic. It sends a small number of probe packets and reads the replies. Some organizations restrict ICMP at their perimeter, so a trace may return incomplete results without indicating any problem.
What is 30 hops in traceroute?
Thirty hops is the default maximum number of routers the command will probe before it stops. The limit prevents an endless trace when a destination is unreachable. Most internet destinations respond well within 20 hops.
Can an observability platform replace traceroute?
An observability platform covers what a single trace cannot, including path history, route change detection and per-hop performance data. Motadata ObserveOps runs trace route checks on a schedule and attaches results to alerts. The manual command still has a place for live investigation.
Author
Poonam Lalani
Content Strategist
Poonam Lalani is a B2B content strategist and writer with a background in computer engineering and experience across enterprise technology domains, including AI, cloud, DevOps, data engineering, and IT operations. She specializes in creating research-driven content that simplifies complex ideas and supports product education, thought leadership, and business growth.