7 Best Network Sniffing Tools for 2026
Ever wondered what is actually using your network when it suddenly slows down?
It could be a device sending too much data, a backup running at the wrong time, or an application taking too long to respond. Without visibility into network traffic, finding the real cause can take hours.
That’s where network sniffing tools can help.
They let you inspect network traffic, capture packets, and see what is happening between devices, servers, and applications. Some tools focus on packet-level analysis, while others use flow data to give you a broader view of network activity.
In this guide, I’ve covered seven network sniffing tools that can help you monitor traffic, troubleshoot problems, and find what is affecting your network.
Psst: By the end of this blog, you’ll know which network sniffing tool is right for your setup.
Our pick: Motadata ObserveOps is the best overall option if you want traffic analysis alongside device, application, infrastructure, and log monitoring in one place.
What is a Network Sniffing Tool?
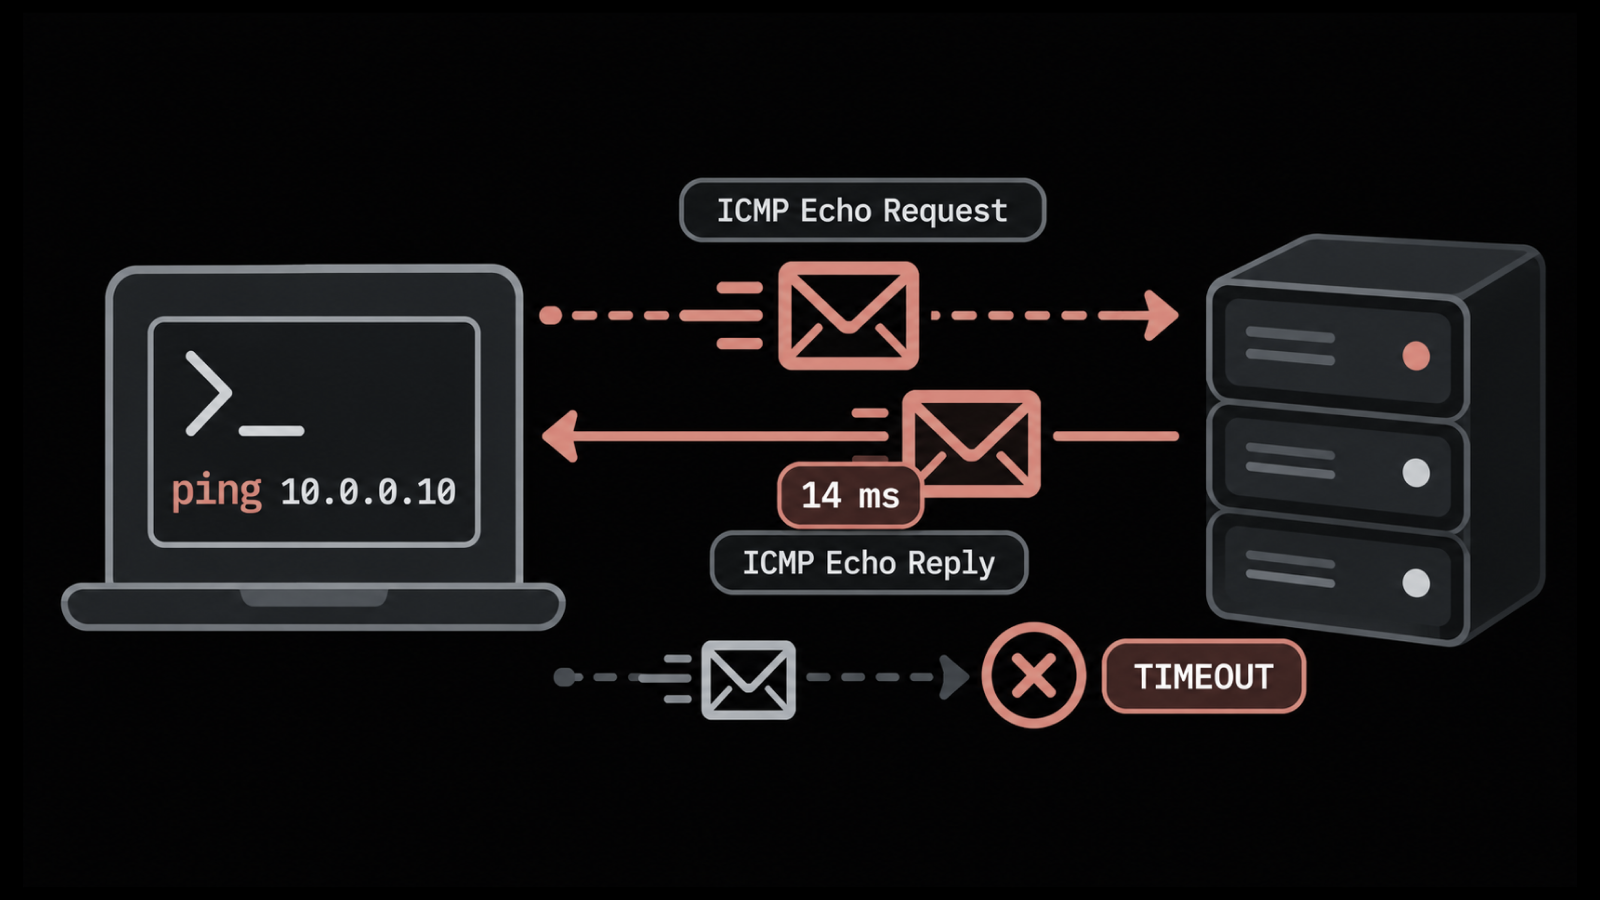
A network sniffing tool examines traffic moving between devices. Network traffic is divided into small units called packets. Each packet contains information about its source, destination, and protocol.
Network sniffing tools generally analyze traffic in two ways:
Packet capture: Captures packets from a network interface, mirror port, or network TAP. The tool can inspect packet headers and, when available, the packet payload.
Flow analysis: Reads flow records such as NetFlow, sFlow, J-Flow, and IPFIX. Flow records summarize a network conversation by showing its source, destination, ports, protocol, data volume, and duration without storing every packet.
They can help you identify:
Failed connections
Slow application responses
High bandwidth usage
Traffic between specific devices
Source and destination of network traffic
Protocols and ports in use
Delays within network connections
Unusual traffic patterns
Packet capture gives you more detail about individual connections, while flow analysis gives you a broader view of traffic across the network. The tools covered below use packet capture, flow analysis, or both.
7 Best Network Sniffing Tools Compared at a Glance
Let’s have a quick overview of top network sniffing tools.
Tool | Best for | Traffic analysis method | Deployment | Starting price |
Motadata ObserveOps | Teams that want network traffic, device, application, and log monitoring together | Packet capture and flow analysis | On-premises, cloud, and hybrid | Custom quote. A 30-day trial is available. |
SolarWinds Network Performance Monitor with NetFlow Traffic Analyzer | IT teams that need packet inspection and flow monitoring | Deep packet inspection and multi-vendor flow analysis | Self-hosted | Network Performance Monitor starts at $2,829. NetFlow Traffic Analyzer starts at $1,873. |
ManageEngine NetFlow Analyzer | Teams that need flow reports and packet-based response time data | Flow analysis and deep packet inspection | Self-hosted on Windows or Linux | The Professional Edition starts at $245 for 10 interfaces and two users. |
PRTG Network Monitor | Teams that want packet header, flow, and device monitoring | Packet header inspection and flow analysis | Self-hosted on Windows | The PRTG 500 plan costs $200 per month with annual billing. |
Progress WhatsUp Gold | Teams that want device monitoring and flow analysis | NetFlow, IPFIX, sFlow, J-Flow, and NetStream analysis | Self-hosted on Windows | The Enterprise Plus plan starts at $3,469 per year for 50 devices. |
LogicMonitor | Teams that want cloud-based monitoring for hybrid networks | Flow records and Cisco application traffic data | Cloud service with local collectors | The Essentials plan starts at $16 per hybrid unit per month. A minimum purchase applies. |
Site24x7 Network Monitoring | Teams that want traffic, server, cloud, and website monitoring | NetFlow, J-Flow, sFlow, IPFIX, NetStream, AppFlow, and CFlow analysis | Cloud service with an on-premises poller | The Professional plan costs $42 per month with annual billing. |
7 Top Network Sniffing Tools in Detail
Let’s learn each tool in detail by understanding its features, pricing, pros, and cons.
1. Motadata
Best for: IT teams that want traffic, device, application, infrastructure, and log monitoring in one product.
Motadata ObserveOps monitors network devices, links, interfaces, and traffic. You can use it to find a traffic problem and check the affected device, application, or service from the same product.
ObserveOps collects network data through Simple Network Management Protocol (SNMP), flow records, and packet agents. Flow Explorer shows which users, applications, protocols, and conversations are using bandwidth. It supports NetFlow, sFlow, J-Flow, and IPFIX.
Packet agents collect traffic from monitored Windows and Linux devices. The team can compare this data with device health, topology maps, application performance, and logs. If a service becomes slow, technicians can check the network, server, and application without moving between separate products.
ObserveOps works well for a team that wants ongoing network and traffic monitoring. A team that only needs to capture packets once in a while may not use its other monitoring features.
Pros
- The IT team can monitor network traffic, devices, applications, infrastructure, and logs from one platform.
- ObserveOps supports both flow analysis and packet collection for deeper network visibility.
- Flow Explorer helps identify users, applications, protocols, and conversations that are using network bandwidth.
- Layer 2 and Layer 3 network maps help technicians trace issues across connected devices and links.
- ObserveOps can be deployed on-premises, in the cloud, or across a hybrid environment.
Cons
- Motadata does not publish a fixed price for ObserveOps.
- A team that only needs occasional packet checks may not use the wider monitoring features.
Pricing
Motadata does not publish a fixed price for ObserveOps. The final price depends on your environment and the modules you choose. Contact the Motadata sales team for a quote.
Motadata also offers a 30-day free trial. You do not need a credit card to start the trial.
2. SolarWinds
Best for: IT teams that want device monitoring, packet inspection, and flow reports.
SolarWinds Network Performance Monitor checks routers, switches, firewalls, wireless controllers, and other network devices. You can use it to track availability, latency, packet loss, interface use, and hardware health.
The product also reads packet data to measure network and application response times. SolarWinds shows this information in its Quality of Experience dashboard. The dashboard helps technicians see whether a delay starts in the network or the application. It can identify traffic from more than 1,200 applications.
SolarWinds NetFlow Traffic Analyzer adds flow monitoring. It supports NetFlow, J-Flow, sFlow, IPFIX, and NetStream. Its reports show which users, applications, protocols, and IP addresses are using bandwidth.
NetFlow Traffic Analyzer works as an add-on to Network Performance Monitor. Both products must use matching licence levels. This setup gives the team packet, flow, and device data, but the company must pay for both products.
If SolarWinds does not fit your budget or deployment requirements, compare SolarWinds alternatives to find other options.
Pros
- The IT team can check packet, flow, device, and network path data in one system.
- The flow reports work across network devices from different vendors.
- Response time reports show whether technicians should check the network or the application first.
Cons
- NetFlow Traffic Analyzer requires Network Performance Monitor, so the company must buy both products.
- The IT team must maintain the monitoring server and database.
Pricing
SolarWinds Network Performance Monitor starts at $2,829. NetFlow Traffic Analyzer starts at $1,873. Each product includes a fully functional 30-day trial.
The two lowest starting prices add up to $4,702. The final price depends on the matching licence levels you choose. Before buying, check the support cost, database requirements, and any extra polling engines you need.
3. ManageEngine
Best for: IT teams that need detailed flow reports and packet-based response time data.
ManageEngine NetFlow Analyzer monitors network traffic and bandwidth. You can use it to see which interfaces, applications, protocols, sources, and destinations are using network capacity.
The product supports NetFlow, sFlow, IPFIX, J-Flow, NetStream, AppFlow, and other flow formats. This support is useful when the network includes devices from Cisco, Juniper, VMware, HP, and other vendors.
The Network Packet Sensor captures mirrored packets from a server or network segment. It can work as a NetFlow generator, a deep packet inspection engine, or both. The sensor measures network response time and application response time.
These two measurements help technicians find where a delay starts. A high network response time points to the connection. A high application response time points to the application server.
NetFlow Analyzer also includes traffic alerts, capacity reports, application monitoring, and past traffic data. It works well for teams that need detailed traffic reports. A team that only needs basic device alerts may not use many of these features.
If you are considering other network monitoring tools, you can also compare ManageEngine alternatives
Pros
- Packet-based response times help technicians find whether a delay starts in the network or the application.
- The product can collect flow records from network devices made by different vendors.
- The Professional and Enterprise editions include unlimited storage for historical data.
Cons
- The Professional Edition starts with 10 interfaces, so the price increases when the team adds more interfaces.
- The team must set up flow exports or mirrored traffic before NetFlow Analyzer can examine the data.
Pricing
The Professional Edition starts at $245 for 10 interfaces and two users. The price includes deep packet inspection and the Network Packet Sensor. The Enterprise Edition starts at $3,795 for 100 interfaces.
ManageEngine lets you add interfaces to the Professional and Enterprise editions. It also offers a free edition and a 30-day trial. Check the price of any add-ons your team needs.
ManageEngine NetFlow Analyzer offers several editions based on interface count. See ManageEngine pricing to compare the available options.
4. PRTG
Best for: IT teams that want packet header and flow monitoring with device monitoring.
PRTG Network Monitor uses sensors to check different parts of a network. You can use one sensor for a traffic source, device, service, interface, or another item you want to monitor.
The Packet Sniffer sensor reads packet headers from a network card. It sorts traffic by protocol, IP address, and connection. The sensor does not read the full data inside every packet.
PRTG also collects NetFlow, IPFIX, sFlow, and J-Flow records. Its Toplists show the busiest devices, connections, and protocols. PRTG saves this data, so technicians can see what was using bandwidth before a problem was reported.
Packet, flow, ping, SNMP, server, and service data appear in the same dashboards. PRTG works well for a team that wants to manage many network checks from one product.
Pros
- PRTG includes packet and flow sensors, so the company does not need a separate traffic add-on.
- Technicians can compare traffic with device, server, and service data during an investigation.
- Stored traffic data helps the team investigate a bandwidth spike after it has ended.
Cons
- The Packet Sniffer sensor does not show the full packet contents needed for a detailed packet investigation.
- Sensor use can increase quickly when the team checks several measures on every device.
Pricing
The PRTG 500 plan costs $200 per month with annual billing. The plan includes up to 500 sensors and is designed for about 50 devices.
The PRTG 1000 plan costs $358 per month with annual billing. Paessler also offers an unrestricted 30-day trial. Count the packet, flow, device, interface, and service sensors you need before choosing a plan.
If PRTG does not match your network monitoring requirements, compare PRTG alternatives to see other options.
5. WhatsUp Gold
Best for: IT teams that want device monitoring and traffic trends across a business network.
Progress WhatsUp Gold monitors network devices, servers, applications, and services. You can use its automated discovery to find devices and place them on an interactive network map.
Network Traffic Analysis Plus collects flow data from routers, switches, and firewalls. It supports NetFlow, IPFIX, sFlow, J-Flow, and NetStream. Reports show traffic by user, application, source, destination, port, and interface.
The add-on uses flow records instead of full packet captures. It helps the team find bandwidth problems and review traffic trends. It does not show every field inside an individual packet.
WhatsUp Gold includes Network Traffic Analysis Plus in the Enterprise Plus plan. This plan also includes configuration management and supports up to four WhatsUp Gold installations.
Pros
- The IT team can check device health, network maps, and traffic reports in one product.
- Historical reports help the team review an earlier bandwidth spike and plan for growth.
- Device-based pricing can cost less when each monitored device has many interfaces.
Cons
- Network Traffic Analysis Plus is available only with the Enterprise Plus plan.
- WhatsUp Gold reads flow records and does not show traffic packet by packet.
Pricing
The Enterprise Plus plan starts at $3,469 per year for 50 devices. This plan includes Network Traffic Analysis Plus.
The Business plan starts at $1,229 per year for 50 devices, but it does not include Network Traffic Analysis Plus. Progress also offers perpetual licences and a free trial.
If WhatsUp Gold does not meet your traffic monitoring requirements, compare WhatsUp Gold alternatives for other network monitoring options.
6. LogicMonitor
Best for: IT teams that want cloud-based monitoring across networks, servers, and cloud services.
LogicMonitor is a cloud-hosted monitoring platform for on-premises and cloud infrastructure. You use a local collector to gather data from network devices and send it to the LogicMonitor platform.
The network traffic monitoring feature supports NetFlow v5, v7, and v9, Flexible NetFlow, IPFIX, sFlow, and J-Flow. LogicMonitor can also read Cisco Network-Based Application Recognition 2 (NBAR2) data. This data helps the product identify application traffic.
Traffic reports show top talkers, endpoints, ports, applications, and flows. LogicMonitor uses flow records and does not save full packet captures. You still need a packet analyzer when you want to inspect a protocol in detail.
LogicMonitor also checks servers, storage, cloud services, wireless access points, and other infrastructure. It works well for a team that wants a hosted product and does not want to maintain the main monitoring server.
Pros
- LogicMonitor hosts the main platform, so the IT team has less monitoring software to maintain.
- One local collector can gather data from many devices without software on every device.
- Technicians can compare network data with server, cloud, storage, and application data.
Cons
- LogicMonitor uses flow records and does not provide full packet capture.
- The minimum purchase can make LogicMonitor costly for a small network.
Pricing
The Essentials plan starts at $16 per hybrid unit per month. The Advanced plan starts at $27 per hybrid unit per month. The Signature plan with Edwin AI starts at $53 per hybrid unit per month.
One hybrid unit covers one on-premises device or one cloud Infrastructure as a Service (IaaS) resource. It can also cover seven cloud Platform as a Service (PaaS) resources or five wireless access points.
LogicMonitor requires a minimum purchase for these prices. Its standard contract terms also apply. A 15-day trial is available.
7. Site24x7
Best for: IT teams that want network traffic monitoring with server, cloud, and website monitoring.
Site24x7 Network Monitoring is a cloud service for network devices and interfaces. You use an On-Premise Poller to collect data from devices inside the company network.
Site24x7 NetFlow Analyzer supports NetFlow, J-Flow, sFlow, IPFIX, NetStream, AppFlow, and CFlow. It shows traffic by device, interface, application, and conversation.
The reports help technicians find traffic peaks, busy applications, and top conversations. The team can set a traffic limit for each device or interface. Site24x7 sends an alert when traffic goes above that limit.
Site24x7 uses flow records and does not save full packet captures. The same account can also monitor network devices, servers, websites, applications, and cloud services.
Pros
- One Site24x7 account can monitor network traffic, servers, cloud services, applications, and websites.
- The Professional plan includes 10 network components, so a small team can start without a network add-on.
- The On-Premise Poller collects data from devices behind a firewall without exposing them to the internet.
Cons
- Site24x7 does not provide full packet capture for detailed protocol checks.
- NetFlow monitoring uses one network component licence for every interface it analyzes.
Pricing
The Professional plan costs $42 per month with annual billing or $49 with monthly billing. It includes 10 network components. You can buy more network components as add-ons.
Site24x7 uses one network component licence for each interface analyzed by NetFlow Analyzer. The company offers a 30-day trial. Count the devices and flow interfaces you need before calculating the final price.
If Site24x7 does not fit your monitoring requirements, compare Site24x7 alternatives to see other options.
How to Choose the Right Network Sniffing Tool
The right network sniffing tool should match the traffic you need to inspect, the devices you monitor, and your budget. Use the following points to compare your options and see whether a tool can help your team find network problems.
Start with the problems you need to solve: List the network issues your team handles most often, such as slow applications, busy links, packet loss, or unexpected traffic.
Choose between packets and flow records: Packet inspection shows what happens inside a connection. Flow records show who is communicating, which applications are active, and how much bandwidth they use.
Check how the tool collects traffic: Find out whether it needs a mirror port, network TAP, packet agent, or flow data from your routers, switches, and firewalls.
Confirm device and flow support: Make sure the tool works with your network devices and supports the flow formats they use, such as NetFlow, sFlow, J-Flow, and IPFIX.
Check application visibility: Make sure the tool can identify the applications using your network and show which ones are causing delays or using too much bandwidth.
Review remote-site monitoring: Check whether the tool can collect traffic from branch offices, data centres, and cloud networks and show it in one place.
Choose how you want to run it: Decide whether you want the software on your own servers, in the cloud, or across both environments.
Review alerts and reports: Check whether alerts point to the affected device, interface, or application and whether reports help you find the cause.
Test a problem your team already knows: Use a past network issue and see how quickly the tool helps you find the busy interface, top user, or slow application.
Check how long data is stored: Make sure the tool keeps packet or flow data long enough for your team to investigate past problems and compare traffic over time.
Understand the pricing model: Check whether the vendor charges by device, interface, sensor, collector, or monitoring unit.
Calculate the full cost: Include licences, extra modules, collectors, storage, support, maintenance, training, and any servers you need to run the tool.
What Can Network Sniffing Tools Help You Find?
Network sniffing tools help identify what is happening across a network. They can help identify the following:
Bandwidth usage: Network sniffing tools show which devices, applications, and connections are using the most bandwidth.
Traffic spikes: Network sniffing tools help identify sudden increases in network traffic that may affect performance.
Slow response times: Network sniffing tools help identify connections or applications that are taking longer to respond.
Unusual connections: Network sniffing tools can reveal unexpected traffic between devices.
Individual connections: Packet-based tools provide detailed information about individual network connections.
Traffic patterns: Flow-based tools show traffic patterns across multiple devices over longer periods.
The comparison below shows what each tool can monitor and how it analyzes network traffic.
FAQs
What does a network sniffing tool do?
A network sniffing tool examines the traffic moving across a network. It can show which devices are communicating, which applications are using bandwidth, where connections are slow, and whether unusual traffic is present.
Is network sniffing the same as network monitoring?
No. Network sniffing examines packet or flow data to show what is moving across the network. Network monitoring checks the health and availability of devices, interfaces, and services. Products such as Motadata ObserveOps, SolarWinds, ManageEngine, and PRTG cover both types of work.
Which network sniffing tool is best for a small IT team?
ManageEngine NetFlow Analyzer may suit a small team that wants published interface-based pricing and packet or flow analysis. PRTG may suit a team that also wants device monitoring and prefers sensor-based pricing. Site24x7 may suit a team that wants a cloud service with network, server, cloud, and website monitoring.
How much does network sniffing software cost?
The price depends on what the vendor counts. ManageEngine NetFlow Analyzer Professional Edition starts at $245 for 10 interfaces and two users. PRTG 500 costs $200 per month with annual billing. Site24x7 Professional costs $42 per month with annual billing. Other vendors provide a custom quote or require more than one product for device and traffic monitoring.
Does every business need full packet capture?
No. Flow monitoring is usually enough when the team needs to find top users, busy applications, and bandwidth use across many devices. Full packet capture is more useful when technicians need to inspect an individual connection or study a protocol problem in detail.
Author
Ramya Shah
Technical Writer
Ramya Shah is a technical content writer with a computer engineering background and roots in automotive journalism. He covers IT Service Management, observability, IT operations, and AI-driven automation. An early adopter of AI-assisted writing workflows, he turns complex IT processes into clear, engaging content optimized for search and answer engines (AEO), lifting content output and organic visibility.