Best Logstash Alternatives: 10 Log Processing Tools Compared
Most teams looking at Logstash alternatives like what Logstash does. It turns almost any line into named fields, and over 200 plugins cover the sources nothing else reaches. What sends teams looking is the cost of keeping it running, and version 9.4.0 made that cost concrete.
Logstash now requires Java 21 and no longer supports Java 17, because the JRuby underneath it moved to version 10. That upgrade also stopped several bundled plugins from loading. Your grok patterns still work, and the upgrade still lands on your team.
In this blog, you will see:
Ten alternatives compared: Scored on runtime, transformation depth, and cost model, with Logstash as the baseline row.
A full review of every tool: Where each one fits, where it does not, and the cons worth knowing.
The four types of Logstash alternative: Picking your type cuts the shortlist faster than any feature grid.
Where Elastic is taking collection: The 9.2 agent change tells you more than any single feature does.
By the end, you will know which two or three deserve a test on your own log volume.
Why Do Teams Look for a Logstash Alternative?
Teams look for a Logstash alternative for three reasons. The JVM underneath it is a second system to run. Pipeline config takes more time than anyone budgets. And a runtime change can stop a pipeline that worked the day before.
1. The JVM Underneath It Is a Second System to Run
Logstash runs on the Java Virtual Machine, and that machine has its own upgrade path. In release 9.4.0, Elastic moved JRuby to version 10, because the 9.x line had reached end of life. JRuby 10 needs Java 21, so Logstash needs it too.
The effects reach past the version number. Elastic notes that from JDK 21.0.10, all TLS_RSA cipher suites are off by default, because they lack forward secrecy. Any connection still using one fails until it moves to an ECDHE suite. We have watched that work land mid-quarter on teams who had not planned for it.
2. Pipeline Configuration Is Where the Time Goes
Every one of those 200 plus plugins is a choice somebody has to make and then maintain. Inputs, filters, and outputs get wired together in a config file, and the filters are where the hours go.
Grok is the usual culprit. Turning an unstructured line into named fields means writing a pattern and testing it, then revisiting it whenever a vendor changes a format upstream. The same holds for log parsing rules that map several sources onto one schema.
3. A Runtime Change Can Stop a Pipeline That Worked Yesterday
Logstash 9.4 shipped Ruby 3.2 through the new JRuby, and Ruby 3.2 removed two long-standing constants. Elastic's release notes then record a run of plugin fixes.
Edn and edn_lines codecs: A missing Bignum constant stopped the codec loading. Elastic states any pipeline using it failed to start.
Anonymize filter: A missing Fixnum constant broke the MURMUR3 algorithm on 9.4 and later.
JMS input: The same missing constant broke decoding of a JMS MapMessage.
Dissect filter: It needed a code change to support JRuby 10 at all.
Elastic fixed all of them quickly. What matters to a buyer is the shape of the dependency, where a runtime decision three layers down reached your parsing stage. The Kafka integration plugin tells the same story.
None of this makes Logstash a weak tool. Its persistent queue gives at-least-once delivery if a node fails, and a dead letter queue holds what cannot be processed.
What Are the Four Types of Logstash Alternatives?
Logstash alternatives fall into four types. Choosing your type removes more of the list than comparing features across all ten.
Lightweight shippers: Fluent Bit and Filebeat. They collect and forward with light processing, and something downstream does the heavy work.
General-purpose pipelines: Vector, Fluentd, the OpenTelemetry Collector, and Apache NiFi. Data goes in, gets reshaped, and gets routed out.
Syslog-native and security collectors: syslog-ng and NXLog Platform. Both assume your sources are syslog or Windows events.
Platforms and commercial pipelines: Motadata ObserveOps and Cribl Stream. One folds the stages into the platform that stores the data. The other sells routing as its own product.
Most teams work through the first three types before the fourth, and in our experience the fourth is often what they needed. Swapping one free binary for another still leaves a pipeline, a search cluster, and a dashboard layer to run. Teams on a unified observability and IT service management platform run that arithmetic differently.
How Did We Evaluate These Logstash Alternatives?
We scored these ten tools against vendor docs, release notes, and license files, all checked in September 2026. The criteria come from our log aggregation tools checklist, cut down to what separates processing tools.
Five criteria carried the most weight.
Source and integration coverage: Whether a new source costs a config change or a support case.
Parsing and transformation depth: How much reshaping happens in flight, and whether complex logic needs a second tool.
Runtime and footprint: What has to be installed and upgraded under the binary, since this is the complaint that sends most people looking.
Deployment fit and data sovereignty: Cloud, self-hosted, or air-gapped, and whichever your compliance team signs off.
Total cost, including the operating half: A free license is not a free tool, so we model engineering time too.
One warning covers every page on this topic, ours included. Almost every published Logstash comparison is written by a vendor selling a destination, and its speed multiples are self-measured.
The 10 Best Logstash Alternatives Compared
Here is the shortlist, with Logstash as the baseline row so every column reads against what you run today.
Tool | Best For | Type | Runtime | License and Cost |
Logstash (baseline) | Elastic Stack estates needing deep filters | General pipeline | JVM, Java 21 from 9.4.0 | Free, Elastic's terms |
1. Motadata ObserveOps | Processing inside the log platform | Platform absorbs the pipeline | Platform service, no separate tier | Commercial, per log source |
2. Vector | Transformation depth without the JVM | General pipeline | Single Rust binary | Open source, MPL 2.0 |
3. OpenTelemetry Collector | New builds, three signals | General pipeline | Single binary | Open source, CNCF |
4. Fluent Bit | Kubernetes, edge, small hosts | Lightweight shipper | C, about 450kb | Open source, CNCF graduated |
5. Fluentd | A large plugin set, CNCF governed | General pipeline | Mostly C, thin Ruby wrapper | Open source, Apache 2.0 |
6. Filebeat and Elastic Agent | Staying on Elastic, but lighter | Lightweight shipper | Embedded OTel Collector from 9.2 | Free, Elastic's terms |
7. syslog-ng and AxoSyslog | Sources that already speak syslog | Syslog-native collector | C daemon | Open source, plus a paid edition |
8. NXLog Platform | Windows-heavy, air-gapped estates | Security collector | Agent plus central platform | Commercial, per data source |
9. Cribl Stream | One stream, several destinations | Commercial pipeline | Worker tier, hosted or your own | Credits, free to 1 TB a day |
10. Apache NiFi | Complex routing built visually | General pipeline | JVM, Java 21 for NiFi 2 | Open source, Apache 2.0 |
The runtime column does most of the filtering. Two of these ten also run on a JVM, and one of them is the free option people reach for first.
Detailed Overview of the 10 Best Logstash Alternatives in 2026
1. Motadata ObserveOps
Best for: Teams that want parsing, enrichment, exclusion, and indexing configured inside the platform that stores the logs.
License: Commercial, and ObserveOps Infinity is the current edition.
ObserveOps runs the processing stages as config inside the log platform, not as a service in front of it. Rules for log enrichment and exclusion sit beside the detection policies that depend on them.
That shape changes the arithmetic against a free shipper. You stop comparing two pipelines and start deciding whether to run one as a separate system. ObserveOps Infinity puts the pipeline in the base edition, so it is not a tier you upgrade into.
Pros
- No separate processing tier: There is no JVM fleet to size, patch, or upgrade beside the platform.
- Licensing tracks sources, not volume: The meter counts how many things you watch, not how much they emit.
- Detection and exclusion share a home: You cannot quietly drop a log that an active rule still needs.
- On-premises is genuinely covered: Six deployment modes, including high availability and disaster recovery.
Cons
- Logstash costs nothing to license and this does not: If the JVM footprint is your only problem, a free binary fixes it.
- There is no config converter: Grok patterns and filter chains get rebuilt by hand.
- You take the whole platform: Teams that want a routing layer in front of Elasticsearch want the opposite shape.
- The pipeline is built around logs: Vector and the OpenTelemetry Collector also carry metrics and traces.
- The current edition is young: Infinity reached general availability in August 2026, so its field record is the shortest here.
Pricing: Quote-based. The licensing model is published, metered per monitored device and per log source, but the prices are not. A free trial is available.
How it compares with Logstash: Logstash is a stage you run between your sources and your store. ObserveOps makes that stage config inside the store itself.
A feature list only tells you what a platform can do. Here is what one of our customers has to say about the product.
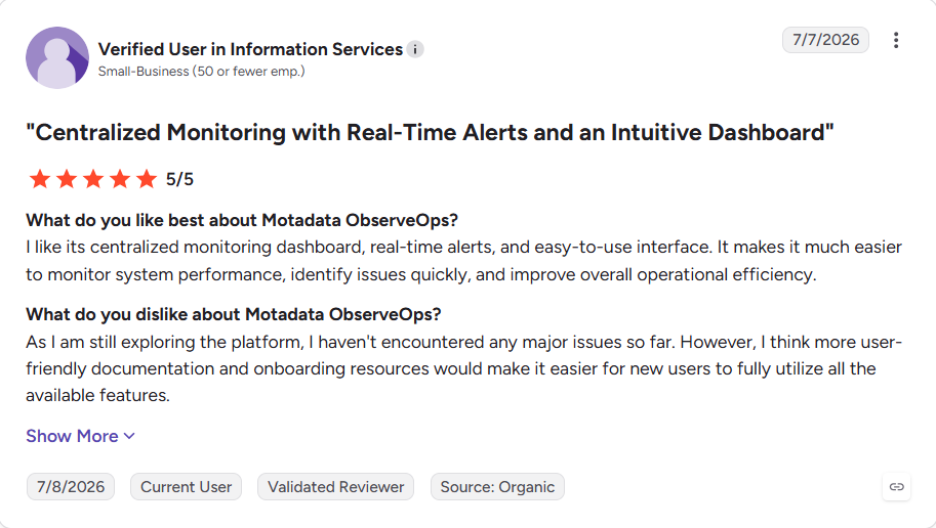
You can read the rest of the ObserveOps reviews on G2.
2. Vector
Best for: Teams that want Logstash's transformation depth without a runtime underneath it.
License: Open source, Mozilla Public License 2.0.
Vector is the closest thing here to a like-for-like swap. It collects, transforms, and routes logs and metrics, and it ships as a single binary with no dependencies. Timber Technologies built it, Datadog acquired Timber in February 2021, and Datadog's community open source team maintains it now.
The trade is worth naming before you commit. Reshaping a telemetry pipeline in Vector means writing its remap language, so the configuration effort moves rather than disappears. Your team gains a memory-safe binary and picks up a language it did not have to know before.
Pros
- Rust rather than a JVM: There is no separate runtime with its own upgrade schedule.
- Scale is stated publicly: The project reports that its largest user processes over 500 TB daily.
- Vendor neutral by design: Destinations are a config line rather than a commitment.
Cons
- VRL is another language to learn: Complex parsing logic still has to be written and kept current.
- MPL 2.0 is weak copyleft: Some legal teams review it differently from Apache 2.0.
- The steward sells a destination: Datadog maintains it, which matters if neutrality is why you are moving.
Pricing: Free and open source.
How it compares with Logstash: Logstash does this work on a JVM with a persistent queue behind it. Vector does it in one binary with VRL.
3. OpenTelemetry Collector
Best for: New builds that want one collector for logs, metrics, and traces with no vendor attached.
License: Open source, under the Cloud Native Computing Foundation.
The Collector receives, processes, and exports telemetry in a vendor-agnostic way. The project's stated goal is removing the need to run several agents at once.
Its place on this list rests on more than popularity. Elastic Agent has run an embedded OpenTelemetry Collector since version 9.2, replacing the model where the agent supervised separate Beats processes. The company behind Logstash now runs this collector in its own collection layer, and we rate that above any benchmark.
Pros
- No vendor attached: Changing backend is a config change rather than a migration.
- Fewer collectors to run: One agent covers what three often cover today.
- The ecosystem is moving this way: Elastic Agent embedding it from 9.2 is the clearest evidence.
Cons
- Component stability is mixed, and the project says so: Its own docs state core components sit at different stability levels.
- Logs arrived after traces and metrics: The log tooling is younger than the rest of the project.
- Transformation is thinner than Logstash filters: Heavy parsing often needs a dedicated tool behind it.
Pricing: Free and open source.
How it compares with Logstash: Logstash is a log pipeline for the Elastic Stack, and the Collector is a telemetry pipeline for anything.
4. Fluent Bit
Best for: Kubernetes, edge deployments, and any host where the collector's footprint is the constraint.
License: Open source, a CNCF graduated project.
Fluent Bit is written in C and built to disappear into the host it runs on. That is why it turns up as a Kubernetes DaemonSet more often than anything else here.
It is also further along on OpenTelemetry than most tools on this list. The trade is scope, because it was built to collect and forward rather than run a heavy filter chain.
Pros
- The smallest option here: It fits in places a JVM application cannot go at all.
- Very large install base: The project reports more than fifteen billion deployments.
Cons
- Transformation is lighter than Logstash filters: That is the trade you make for the footprint.
- Extending it means writing C: There is no plugin gem for a quick custom filter.
- Complex parsing needs a partner: Multi-stage work pairs it with something heavier downstream.
Pricing: Free and open source.
How it compares with Logstash: Logstash does heavy work in one place, and Fluent Bit does light work everywhere.
5. Fluentd
Best for: Teams that want a large plugin ecosystem under foundation governance rather than one vendor's.
License: Open source, Apache 2.0.
Fluentd is a data collector for a unified logging layer, and it treats every log as JSON. It joined the CNCF in November 2016 and graduated in April 2019. Its own docs report a largest user collecting from more than 50,000 servers.
Two details are worth correcting, because comparison pages get both wrong. Fluentd's own docs describe it as written mostly in C with a thin Ruby wrapper, not as a Ruby application. Its plugin count is also smaller than the four-figure number that circulates.
Pros
- Foundation governance since 2019: A graduated CNCF project rather than one vendor's roadmap.
- Apache 2.0 licensing: The simplest license story of the open source options here.
- One family with Fluent Bit: Light collection and aggregation share a project.
Cons
- Heavier than Fluent Bit: Which is why the Fluent project ships both of them.
- Ruby gem dependencies: Plugins bring their own versions to manage, which will feel familiar.
- Buffering is where teams slip: Getting memory against file buffering wrong shows up under load.
Pricing: Free and open source.
How it compares with Logstash: Fluentd is lighter to run, and Logstash transforms more deeply with stronger delivery guarantees behind it.
6. Filebeat and Elastic Agent
Best for: Teams staying on the Elastic Stack that want collection to get lighter without leaving it.
License: Free to download under Elastic's own terms.
Filebeat is Elastic's light shipper, and it fed Logstash rather than competing with it. What makes it current is the architecture around it. Since version 9.2, Elastic Agent runs an embedded OpenTelemetry Collector instead of supervising separate Beats processes.
Elastic is clear that the change is incremental and backward compatible. The migration happens underneath you across releases, which is comfortable if you are staying and beside the point if you are not. Logstash stays a supported destination throughout.
Pros
- Much lighter than Logstash: Collection stops carrying a transformation engine with it.
- No migration required: Elastic states existing configs work without changes.
- Central management through Fleet: Policies and integrations apply across the fleet.
Cons
- It is light because it does less: Heavy transformation still goes to Logstash or an ingest pipeline.
- It is built for Elastic: The wrong choice if leaving the Elastic Stack is the point.
- The architecture is mid-transition: What runs where depends on your agent version.
Pricing: Free to download under Elastic's license terms.
How it compares with Logstash: Choosing Filebeat means moving transformation into an ingest pipeline instead. Teams weighing a wider move usually read about Elasticsearch alternatives at the same time.
7. syslog-ng and AxoSyslog
Best for: Estates where most sources already speak syslog and always will.
License: Open source editions, plus a paid Premium Edition from One Identity.
syslog-ng is an enhanced log daemon covering syslog, unstructured text, queueing, SQL, and NoSQL destinations. It sorts incoming messages by content and by source host, application, and priority. Since version 3.7 of the open source edition, it can send messages straight to Elasticsearch.
The lineage now runs in two lines, which is worth knowing before you pick one. One Identity holds the syslog-ng name and its commercial edition. Axoflow, staffed by people who worked on the original project, maintains AxoSyslog as a separate open source distribution. Both lines are under active development.
Pros
- Built for syslog from the start: No translation layer where that is what your sources emit.
- Very long production record: This lineage has run in enterprise estates for decades.
- A supported paid path: Teams that need a contract have one without changing tools.
Cons
- Its config language is its own: Nothing you learned writing Logstash filters transfers over.
- Structured processing is weaker: Without AxoSyslog and FilterX, the transformation set trails Logstash.
- Binaries come from elsewhere: One Identity states it provides sources only for the open source edition.
Pricing: The open source editions are free. syslog-ng Premium Edition is commercial, with figures on request.
How it compares with Logstash: Logstash parses anything into named fields. syslog-ng starts by assuming it is syslog, which is simpler where that assumption holds. rsyslog is the other long-running daemon here, and it describes itself as a high-performance system for log processing pipelines.
8. NXLog Platform
Best for: Windows-heavy, regulated, and air-gapped estates that cannot use a vendor-hosted control plane.
License: Commercial, with figures on request.
NXLog Platform is an on-premises telemetry pipeline built for hybrid and air-gapped networks. A SaaS version is stated as roadmap rather than shipping. One agent covers collection and aggregation, since any agent can be made a relay.
Windows depth is where it separates from everything else here. Most tools on this list treat Windows as one source type among many. NXLog goes down to Active Directory, DNS, DHCP, IIS, and SQL Server, and it covers industrial control systems that the rest leave alone.
Pros
- Genuine air-gap support: Few tools here run with no vendor connectivity at all.
- Windows is first-class: Event log handling is native rather than adapted from a Linux design.
- Volume-independent licensing: Per data source, so the bill does not follow your data curve.
Cons
- On-premises first: A fully managed service is on the roadmap rather than available.
- Analytics are shallower than a SIEM: NXLog says so itself.
- Commercial, and you still run the infrastructure: The control you gain is paid for in servers and staff time.
Pricing: Per data source and volume independent, with figures on request.
How it compares with Logstash: Logstash treats Windows Event Log as one input among many. NXLog reads it through the OS APIs as a primary source, which settles Windows-heavy shortlists on its own.
9. Cribl Stream
Best for: Large estates routing one stream to several destinations with different content in each.
License: Commercial, with a free tier.
Cribl Stream sits between your sources and your destinations, and it is the only tool here sold purely as that layer. Cribl also sells separate products for collection, search, and storage around it.
It answers a different question from Logstash's. Logstash usually sits on one path into one store. Cribl gets bought when several destinations and a rising ingest bill turn out to be the same problem.
Pros
- Destination-neutral by design: It does not sell you the place your data ends up.
- A genuinely useful free tier: Up to 1 TB a day with no license required.
- Built for estate-wide routing: The design target is many sources and many destinations.
Cons
- Commercial, where most of this list is free: It answers a cost complaint with an invoice.
- The free tier has real ceilings: One worker group, ten worker processes, and 50 GB of lake capacity.
- It is a layer, not a replacement: You still run whatever platform stores the data.
Pricing: Consumption-based credits, consumed at ingest. Free covers 1 TB a day, Standard covers 5 TB with 8x5 support, and Enterprise is unlimited with 24x7 support.
How it compares with Logstash: Logstash is free, configured in files, and points at one store. Cribl is licensed, configured in a console, and built for many.
10. Apache NiFi
Best for: Complex routing that a team would rather build visually than in a config file.
License: Open source, Apache Software Foundation.
Apache NiFi is a general dataflow system rather than a log tool. That is both the reason to consider it and the reason most teams do not.
One thing needs saying plainly before it reaches your shortlist. NiFi 2 requires Java 21, exactly like Logstash 9.4.0, so it does not answer the JVM complaint at all. It earns a place when the routing logic is the problem, not the runtime.
Pros
- Routing you can see: Complex branching is easier to review when it is drawn.
- Apache Software Foundation governance: No single vendor sets the roadmap.
- It handles more than logs: One system can cover several unrelated data flows.
Cons
- NiFi 2 requires Java 21: The same runtime bar that sends many teams away from Logstash.
- Log tooling is thinner: It is a general engine, so log parsing is less developed.
- It is the heaviest option here: Operating it takes more than any other tool on this list.
Pricing: Free and open source.
How it compares with Logstash: Logstash expresses a pipeline in a config file, and NiFi expresses it as a flow you watch running.
Fluentd vs Logstash: Which One Should You Run?
Fluentd and Logstash do the same job with different trade-offs. Logstash gives you deeper transformation on a JVM, under one vendor's roadmap. Fluentd gives you a lighter runtime and a bigger plugin set under foundation governance.
Here is how the two line up on the points that usually decide it.
Point of Comparison | Logstash | Fluentd |
Runtime | JVM, Java 21 or later from 9.4.0 | Mostly C with a thin Ruby wrapper |
Governance | Elastic, a single vendor | CNCF graduated since April 2019 |
License | Elastic's own terms | Apache 2.0 |
Plugin ecosystem | Over 200 plugins | Over 500 community plugins |
Event model | Named fields, Elastic Common Schema | Every log handled as JSON |
Durability | Persistent queue with at-least-once delivery, plus a dead letter queue | Buffer plugins, memory or file backed |
Natural home | The Elastic Stack | Kubernetes and the EFK stack |
Those rows point to a clean split. Stay on Logstash when your destination is Elasticsearch and the durability guarantees are load-bearing. Move to Fluentd when your estate is Kubernetes-shaped, or when Apache 2.0 matters to legal.
Our own position is that this comparison is smaller than most teams expect. Both are pipeline software you install, configure, and keep running, so swapping one for the other changes the runtime and not the workload.
What Are the Best Open Source Logstash Alternatives?
Six of the ten tools above are free and open source. They are Vector, the OpenTelemetry Collector, Fluent Bit, Fluentd, Apache NiFi, and the syslog-ng open source editions. Each one wins on a different quality.
Smallest footprint: Fluent Bit, at roughly 450kb with no dependencies.
Closest to Logstash's transformation depth: Vector, through Vector Remap Language.
Most permissive license: Fluentd and Apache NiFi, both Apache 2.0.
Most future-proof collection layer: The OpenTelemetry Collector, which Elastic Agent now embeds.
Best fit for syslog-only estates: syslog-ng OSE or AxoSyslog.
One caution belongs with that list. A free license is not a free tool, and the cost moves from the invoice to the calendar. Somebody writes the parsing rules, tunes the buffering, handles the upgrade when the runtime shifts, and sizes the storage your log retention policy implies.
Teams that move to another open source pipeline usually fix the resource complaint and keep the maintenance one. We would set that expectation before a migration, not after.
Which Logstash Alternatives Work Best for Security Operations?
Three tools here are shaped for security operations. They are NXLog Platform, syslog-ng with AxoSyslog, and Cribl Stream. Start by naming the constraint Logstash cannot meet in your environment, then match that constraint to the tool.
Data and config cannot leave your network: NXLog Platform is the only air-gap capable option here.
Your evidence is mostly Windows: NXLog reads Security, System, and ETW logs through the OS APIs.
Your sources are syslog: syslog-ng or AxoSyslog removes a translation layer.
Your SIEM bill is the problem: Cribl Stream routes one stream to many destinations.
We would settle one thing before any of them. Cutting what reaches a SIEM is a detection risk before it is a saving. Decide up front how you will prove nothing you dropped was feeding a live rule. That sits underneath the wider SIEM vs log management decision.
How Do You Choose the Right Logstash Alternative?
Start from the constraint you cannot compromise on. That single answer clears most of this list before any feature comparison begins. Match your situation below, then trial two rather than five.
Your Situation | Start With | Why |
Pipeline, search, and dashboards are three systems on one team | Motadata ObserveOps | Processing is config inside the platform that stores the data |
Your filters do real work and the JVM is the only problem | Vector | Programmable transforms in one binary, no runtime |
You are building new and want to stay off one backend | OpenTelemetry Collector | One collector across three signals, and Elastic embeds it |
Collection runs on Kubernetes or constrained hardware | Fluent Bit | Roughly 450kb with native OTLP support |
You want a large plugin set without one vendor's roadmap | Fluentd | CNCF graduated, Apache 2.0, 500 plus plugins |
You are staying on Elastic and want lighter collection | Filebeat and Elastic Agent | An embedded OTel Collector since 9.2, configs unchanged |
Nearly everything you collect is already syslog | syslog-ng or AxoSyslog | Built for syslog, with a paid edition available |
You are air-gapped, Windows-heavy, or running OT | NXLog Platform | On-premises first, native Windows event and ICS collection |
One stream must reach several destinations with different content | Cribl Stream | Fan-out routing with reduction, free to 1 TB a day |
The routing logic is complex enough to want to see it | Apache NiFi | Flows built and watched visually, but the JVM stays |
Every row above resolves to one question. Are you replacing a pipeline, or removing the need to run one? The two answers do not overlap.
When Is Logstash Still the Right Choice?
Logstash is still the right answer in several situations, and a comparison that pretends otherwise is not worth trusting. Keep it when durability and plugin coverage matter more than the runtime.
Your delivery guarantees are load-bearing: The persistent queue gives at-least-once delivery, and the dead letter queue lets you replay failures.
Elasticsearch is the destination and will stay: Nothing else here integrates with the Elastic Stack as closely.
Your filters already work: Rewriting a mature set of grok patterns costs more than a Java upgrade does.
Ingest spikes are your normal: Elastic states it absorbs them with no external queue layer, and over 200 plugins is hard to match.
The Java 21 requirement is also a one-time upgrade rather than a recurring tax. If your platform team can absorb it, we would stay put and revisit at the next major version. A log aggregation architecture is expensive to redo twice.
Replace Logstash With Motadata ObserveOps
Logstash earned its place, and the persistent queue and plugin library are still hard to beat. Staying is defensible whenever Elasticsearch is your destination and your filters are doing real work.
Motadata ObserveOps suits the teams where that stopped being true. The observability pipeline stages run inside the platform that indexes and searches the data, with no runtime underneath carrying its own upgrade path.
It is not right for everyone. Teams set on a backend-neutral routing layer should pick Vector, and a Kubernetes fleet that only needs collection should pick Fluent Bit.
What no tool settles is how much pipeline maintenance your team can carry each quarter, and that answer only shows up after a real migration.
FAQs
Is Logstash being deprecated?
Logstash is not being deprecated. It is actively developed, with 9.5.3 among the recent releases, and it remains a supported output for Elastic Agent. What changed is the runtime, since 9.4.0 requires Java 21.
Do you still need Logstash if you already run Elasticsearch?
Elasticsearch ingest pipelines already handle much of the parsing that Logstash filters do. Logstash earns its place when you need heavy transformation, several destinations, or a persistent queue in front of the cluster.
Can you replace Logstash without rewriting your grok patterns?
No tool converts a Logstash config automatically. Expect to rebuild parsing logic in the replacement's own language, and budget that work first. It is the largest hidden cost in a migration.
What does it actually cost to run Logstash?
The license is free and the operating cost is not. Budget for the JVM upgrade path, for plugin maintenance when a runtime change breaks something, and for filter work when a log format shifts.
Is Motadata ObserveOps a good Logstash alternative?
It suits teams that want processing inside the log platform rather than in front of it. Parsing, enrichment, exclusion, indexing, and forwarding are configured once as one flow, with licensing metered per log source.
Author
Ramya Shah
Technical Writer
Ramya Shah is a technical content writer with a computer engineering background and roots in automotive journalism. He covers IT Service Management, observability, IT operations, and AI-driven automation. An early adopter of AI-assisted writing workflows, he turns complex IT processes into clear, engaging content optimized for search and answer engines (AEO), lifting content output and organic visibility.